. 2012;2(12):1223-37.
doi: 10.7150/thno.5576. Epub 2012 Dec 31.

Optimization of the ultrasound-induced blood-brain barrier opening

Affiliations

Optimization of the ultrasound-induced blood-brain barrier opening

Elisa E Konofagou. Theranostics. 2012.

Abstract

Current treatments of neurological and neurodegenerative diseases are limited due to the lack of a truly non-invasive, transient, and regionally selective brain drug delivery method. The brain is particularly difficult to deliver drugs to because of the blood-brain barrier (BBB). The impermeability of the BBB is due to the tight junctions connecting adjacent endothelial cells and highly regulatory transport systems of the endothelial cell membranes. The main function of the BBB is ion and volume regulation to ensure conditions necessary for proper synaptic and axonal signaling. However, the same permeability properties that keep the brain healthy also constitute the cause of the tremendous obstacles posed in its pharmacological treatment. The BBB prevents most neurologically active drugs from entering the brain and, as a result, has been isolated as the rate-limiting factor in brain drug delivery. Until a solution to the trans-BBB delivery problem is found, treatments of neurological diseases will remain impeded. Over the past decade, methods that combine Focused Ultrasound (FUS) and microbubbles have been shown to offer the unique capability of noninvasively, locally and transiently open the BBB so as to treat central nervous system (CNS) diseases. Four of the main challenges that have been taken on by our group and discussed in this paper are: 1) assess its safety profile, 2) unveil the mechanism by which the BBB opens and closes, 3) control and predict the opened BBB properties and duration of the opening and 4) assess its premise in brain drug delivery. All these challenges will be discussed, findings in both small (mice) and large (non-human primates) animals are shown and finally the clinical potential for this technique is shown.

Keywords: blood-brain barrier; drug delivery; focused ultrasound; mechanism; microbubble..


Conflict of interest statement

Competing Interests: The authors have declared that no competing interest exists.

Figures

FIGURE 1
FIGURE 1
a) Block diagram and illustration of the experimental setup. The PCD was positioned at 60◦ relative to the longitudinal axis of the FUS beam. The overlap between the focal regions of PCD (blue) and FUS (red) occurring inside the murine brain is illustrated in the inset; b) Lateral cross-section of a brain capillary: the micron-sized bubbles are flowing in the lumen and oscillate when activated by the FUS beam.
FIGURE 1
FIGURE 1
a) Block diagram and illustration of the experimental setup. The PCD was positioned at 60◦ relative to the longitudinal axis of the FUS beam. The overlap between the focal regions of PCD (blue) and FUS (red) occurring inside the murine brain is illustrated in the inset; b) Lateral cross-section of a brain capillary: the micron-sized bubbles are flowing in the lumen and oscillate when activated by the FUS beam.
FIGURE 2
FIGURE 2
Spectrogram during the first 0.2 ms sonication. Broadband acoustic emissions were detected at (b) 0.45 MPa and (c) 0.60 MPa but not at (a) 0.30 MPa. Corresponding MRI images confirm that the blood-brain barrier (BBB) could be opened at 0.30 MPa, i.e., without inertial cavitation ,. The red arrows indicate the location of BBB opening which is the hippocampus.
FIGURE 3
FIGURE 3
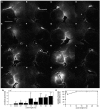
Qualitative fluorescence images of the (A, C, E, G, I, K, M, O) left and (B, D, F, H, J, L, N, P) right brain regions of interest (ROI) that have been exposed to pulse length (PL) of (A) 0.033, (C) 0.1, (E) 0.2, (G) 1, (I) 2, (K) 10, (M) 20, and (O) 30 milliseconds. The white scale bar in (A) indicates 1 mm. Quantitative (Q) normalized optical density (NOD) of the left focused ultrasound (FUS)-targeted ROI and (R) probability of localized dextran delivery. The left ROI was sonicated at different PLs. The single asterisk (*) indicates an NOD increase from the sham, whereas the double asterisk (**) indicates a significant increase (p<0.05) compared with the 0.033-, 0.1-, and 0.2-millisecond PLs .
FIGURE 4
FIGURE 4
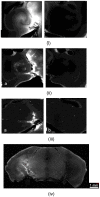
Study of the molecular size through the BBB opening using Dextrans and fluorescence imaging: Horizontal slice of Dextran of molecular weight equal to i) 3, ii) 70 and iii) 2000 kDa on the a) left (targeted) and b) right (not targeted) hippocampus; iv) Coronal slice of the entire brain at 70 kDa Dextran showing the fluorescent left hippocampus (crescent-shaped); v) Fluorescent albumin (67 kDa) permeated in the putamen through the opened BBB.
FIGURE 5
FIGURE 5
Comparison between MRI (left) and histology (center (1x) and right (200x near the region of most enhanced BBB opening according to the MRI) after FUS-induced BBB opening on the left hippocampus at i) 0.45 and ii) 0.75 MPa peak rarefactional pressure. It shows that at lower pressures ((i)) the endothelial and neurons are intact (red) while at higher pressures ((ii)) there is extravasation of red blood cells (indicated by arrowhead) and neuronal death (indicated by arrow). This indicates the safety window of the FUS technique in BBB opening.
FIGURE 6
FIGURE 6
T1 MRI images of A) BBB opening, B) BBB closing (24 hours); and C) fluorescence imaging with 3-kDa dextran of the left (sonicated hippocampus).
FIGURE 7
FIGURE 7
MRI permeability image (first column in (i) and (ii)), T1-weighted image (first column in (i) and (ii)) of BBB opening in the left hippocampal formation (right one served as the control), H&E histology of both the left and right hippocampi (40x) (last row in (i) and (ii)) and cavitation spectrograms (bottom row in (iii) with corresponding T1 images on top) at 0.45 MPa ((i) and right column in (iii) and 0.30 MPa ((ii) and left column in (iii)). Note the harmonic peaks (parallel lines) in the spectrograms at 1.5, 3, 4.5 MHz, etc at 0.3 MPa and the inertial cavitation (harmonics and broadband noise) on the spectrogram at 0.45 MPa. No structural damage was noted at either pressure or cavitation phenomena in 48 mice studied . The permeability maps show increase of a 100 fold in the area sonicated, i.e., the left hippocampal formation. The entorhinal cortex is designated using a green arrow. At higher pressures, damage was detected and therefore the highest pressure to be used in this study will be 0.45 MPa.
FIGURE 8
FIGURE 8
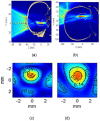
Theoretical simulations with experimental validation for predicting the area of BBB opening (in red) relative to the hippocampus (white dashed contour through the skull) of a) non-human primates at 800 kHz and b) human at 500 kHz. In both cases, there is formation of a uniform focal spot with the largest dimension along the longest dimension of the hippocampus in both cases. c) Experimental validation of a uniform focal spot (transverse view) through the ex vivo primate skull of the d) simulated focal spot at 800 kHz .
FIGURE 9
FIGURE 9
In vivo BBB opening in monkeys: (A,B,C) BBB opening experiment targeting the caudate using custom made microbubbles and applying 0.6 MPa (purple dashed line shows region of interest). (D,E,F) BBB opening experiment targeting hippocampus using Definity® microbubbles and applying 0.6 MPa (orange dashed line shows region of interest). (A,B,D,E) 3D Spoiled Gradient-Echo (SPGR) T1-weighted sequence was applied after intravenous (IV) injection of gadodiamide 1 h after sonication. (A,D) Sagittal slices at the region of interest. (B,E) Corresponding coronal slices. (C,F) 3D T2-weighted sequence, an edema was visible using custom made microbubbles while no damage was detected using Definity® microbubbles.
FIGURE 10
FIGURE 10
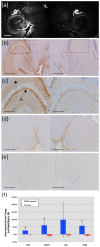
(a) Fluorescent image of a 100-micron frozen brain section from a mouse that was sacrificed 20 min after sonication. The sonicated hippocampus (left) shows much higher fluorescent intensity than the un-sonicated hippocampus (right), depicting blood-brain barrier opening and the extravasation of fluorescent-tagged (Alexa Fluor 594) BDNF in the sonicated region; (b) a 5-micron frozen section from the same mouse was immunohistochemically stained using a primary antibody against phosphorylated MAPK (pMAPK). Consistent with the fluorescent image in (a), the intensity of DAB staining is much greater in the left sonicated hippocampus compared to the right control; the black box shows the enlarged area in (c), where immunoreactivity to pMAPK is shown in mossy fiber terminals (arrowhead), suprapyramidal CA3 dendrites (black star), and the axons of the Schaffer collateral system (hollow star); (d) immunohistochemical staining of a 5-micron frozen section from a mouse that was sacrificed 3 min after sonication; the same primary antibody against pMAPK was used. No difference in DAB intensity is observed between the sonicated and the control hippocampus; (e) Negative control for the same mouse in (a); no primary antibody (against pMAPK) was added to this 5-micron frozen section during the staining procedure. All magnifications are 40x and scale bars are 500 μm except for (c), which is 100x and 200 μm, respectively. In (f), immunohistology stain intensity analysis shows percentage change between the left (FUS) and the right (no FUS) sides of the mice brains. A significant difference (p<0.05, N=3; depicted by asterisks) was found between the BDNF administered animal group and the control (no BDNF) animal group for the TrkB, MAPK, and CREB antibodies. Bars represent mean ± standard deviation.

References

    1. Pardridge WM. The blood-brain barrier: bottleneck in brain drug development. NeuroRx. 2005;2:3–14. - PMC - PubMed
    1. Abbott NJ, Ronnback L, Hansson E. Astrocyte-endothelial interactions at the blood-brain barrier. Nat Rev Neurosci. 2006;7:41–53. - PubMed
    1. Stewart P Aand Tuor UI. Blood-eye barriers in the rat: correlation of ultrastructure with function. J Comp Neurol. 1994;340:566–76. - PubMed
    1. Pardridge WM. Molecular trojan horses for blood-brain barrier drug delivery. Curr Opin Pharmacol. 2006;6(5):494–500. - PubMed
    1. Bakay L, Ballantine HT Jr, Hueter TF. et al. Ultrasonically produced changes in the blood-brain barrier. AMA Arch Neurol Psychiatry. 1956;76:457–67. - PubMed

Publication types