. 2013;8(1):e52416.
doi: 10.1371/journal.pone.0052416. Epub 2013 Jan 29.

Intermittent fasting dietary restriction regimen negatively influences reproduction in young rats: a study of hypothalamo-hypophysial-gonadal axis

Affiliations

Intermittent fasting dietary restriction regimen negatively influences reproduction in young rats: a study of hypothalamo-hypophysial-gonadal axis

Sushil Kumar et al. PLoS One. 2013.

Abstract

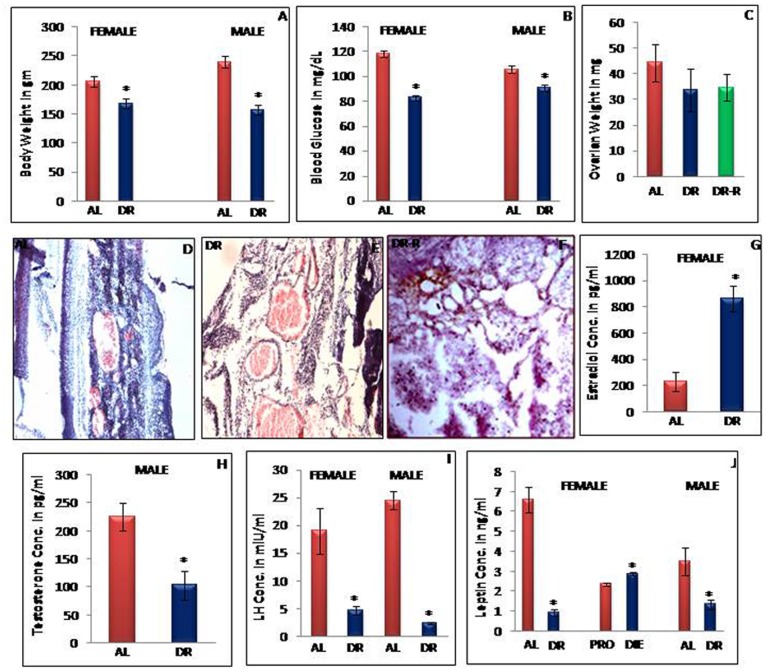
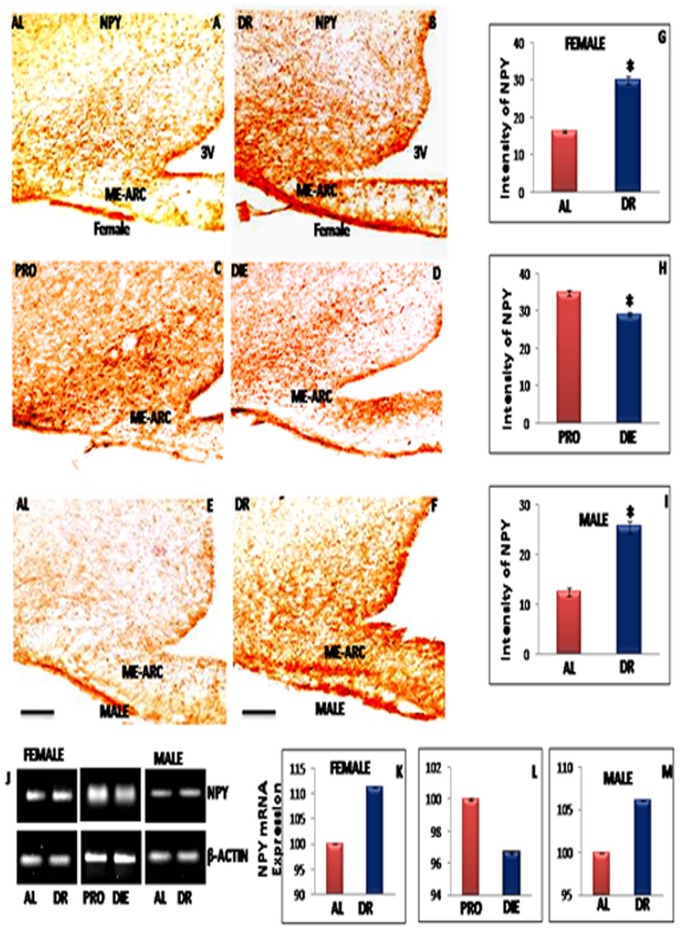
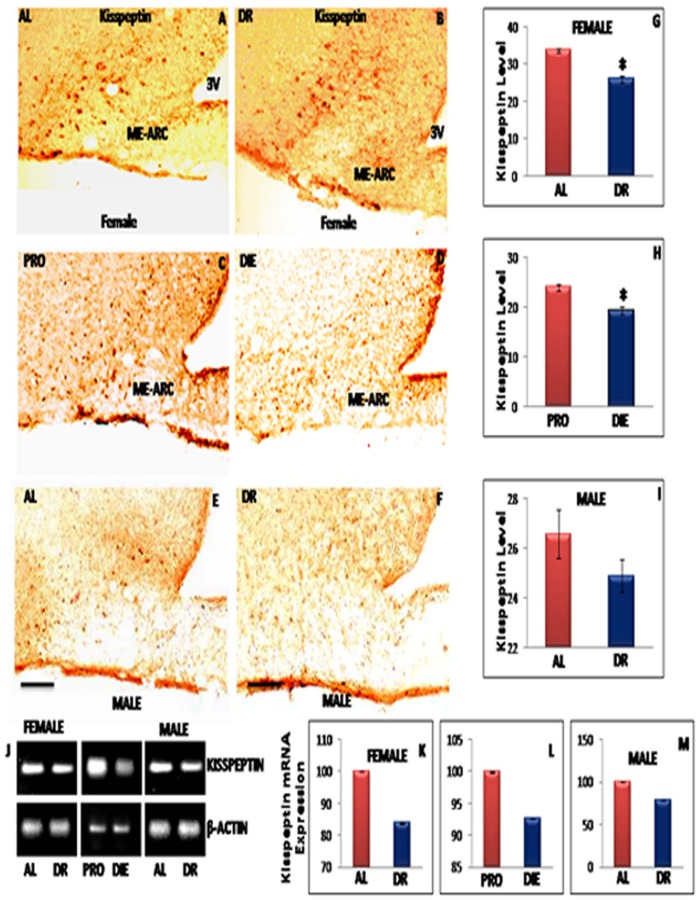
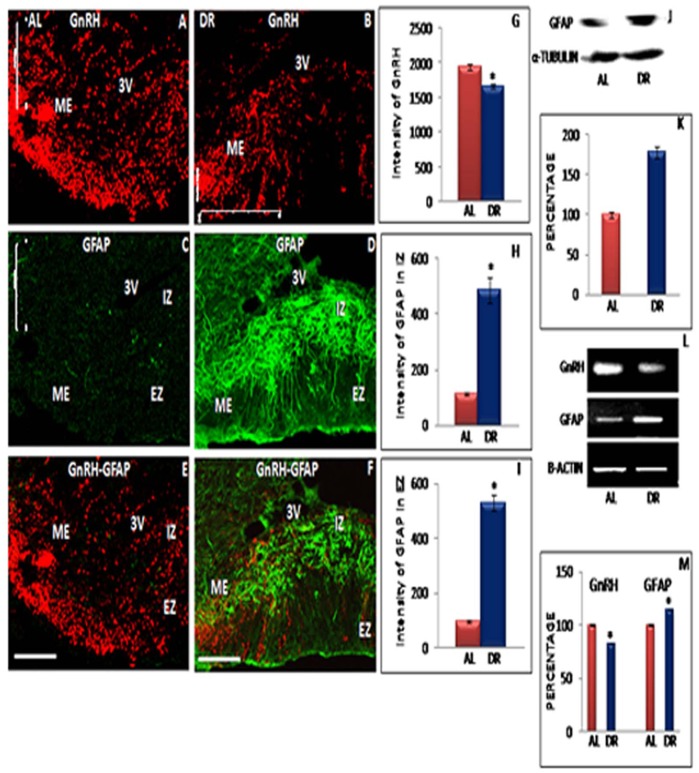
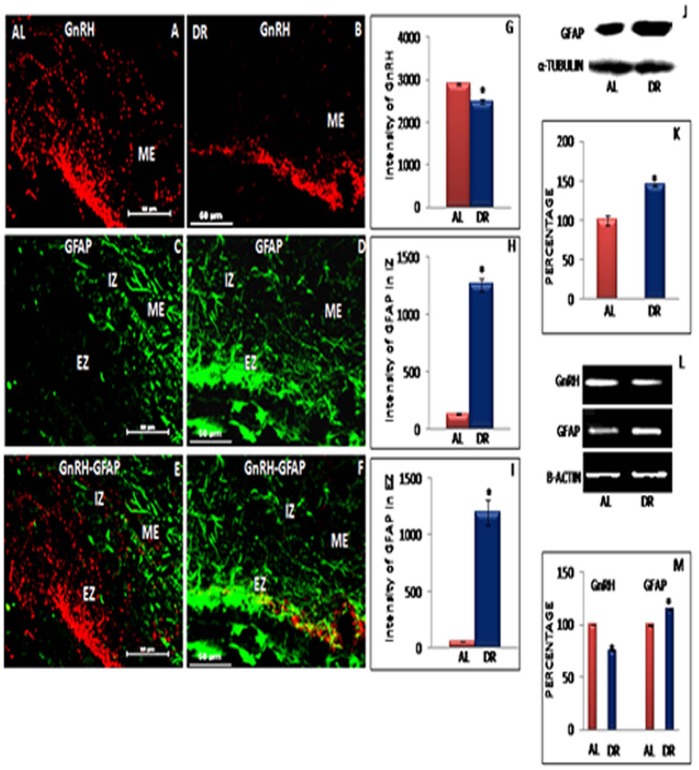
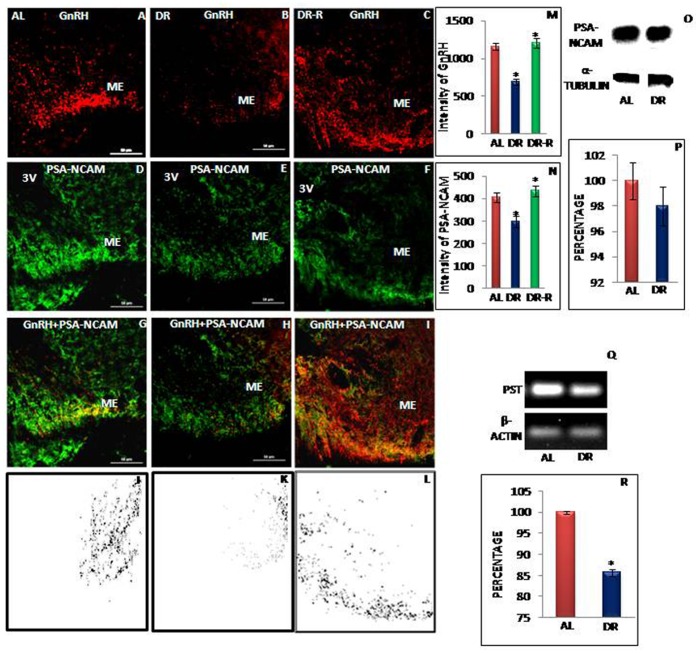
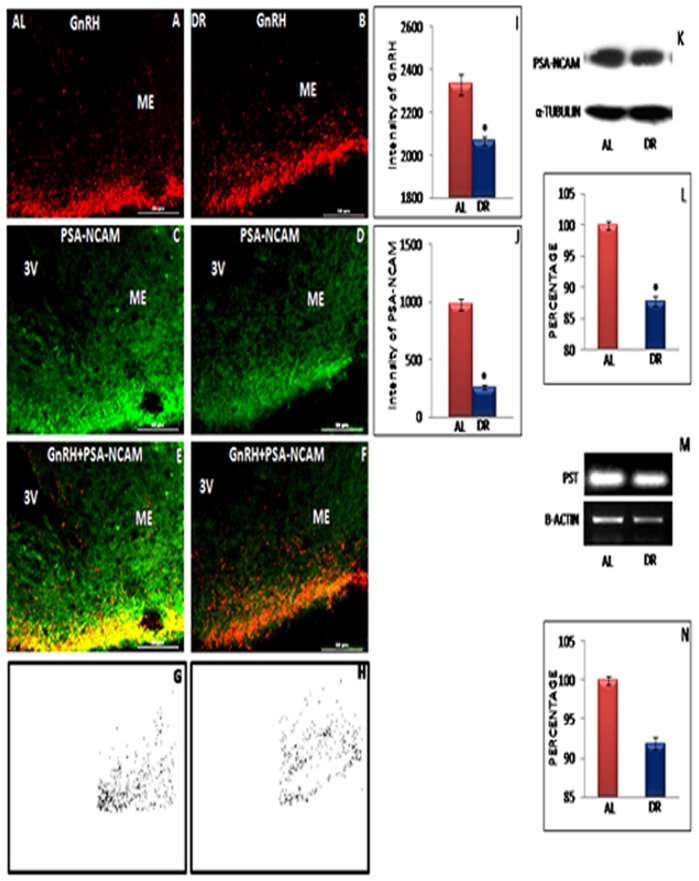
Nutritional infertility is very common in societies where women fail to eat enough to match their energy expenditure and such females often present as clinical cases of anorexia nervosa. The cellular and molecular mechanisms that link energy balance and central regulation of reproduction are still not well understood. Peripheral hormones such as estradiol, testosterone and leptin, as well as neuropeptides like kisspeptin and neuropeptides Y (NPY) play a potential role in regulation of reproduction and energy balance with their primary target converging on the hypothalamic median eminence-arcuate region. The present study was aimed to explore the effects of negative energy state resulting from intermittent fasting dietary restriction (IF-DR) regimen on complete hypothalamo-hypophysial-gonadal axis in Wistar strain young female and male rats. Significant changes in body weight, blood glucose, estrous cyclicity and serum estradiol, testosterone and LH level indicated the negative role of IF-DR regimen on reproduction in these young animals. Further, it was elucidated whether serum level of metabolic hormone, leptin plays a mechanistic role in suppressing hypothalamo-hypophysial-gonadal (HPG) axis via energy regulators, kisspeptin and NPY in rats on IF-DR regimen. We also studied the effect of IF-DR regimen on structural remodeling of GnRH axon terminals in median eminence region of hypothalamus along with the glial cell marker, GFAP and neuronal plasticity marker, PSA-NCAM using immunostaining, Western blotting and RT-PCR. Together these data suggest that IF-DR regimen negatively influences reproduction in young animals due to its adverse effects on complete hypothalamus-hypophysial-gonadal axis and may explain underlying mechanism(s) to understand the clinical basis of nutritional infertility.


Conflict of interest statement

Competing Interests: The authors have declared that no competing interests exist.

Figures

Figure 1
Figure 1. Effect of IF-DR regimen on body weight, ovarian histology, blood glucose, serum leptin, LH, estradiol and testosterone level.
Comparison of Body weight gain (in gm), blood glucose (in mg/dL), ovarian histology, ovarian weight (in mg), Serum estradiol and testosterone (in pg/ml), LH (in mlU/ml), leptin (in ng/ml) level in ad libitum fed (AL), Intermittent fasting dietary restricted (IF-DR), DR-R female and male rats (n = 6 each). All the parameters were observed after 12 weeks of alternate day feeding of 3–4 months old and (B) Blood glucose level were significantly lower in IF-DR animals of both sexes as compared to AL group. (C) Reduced ovarian weight in IF-DR female rats. (D–F) Large sized corpora lutea and fibrous tissue were seen in ovarian sections of IF-DR as compared to AL fed and DR-R female rats. (G) Higher level of serum estradiol in IF-DR as compared to AL female rats. (H) Reduced testosterone concentration in IF-DR male rats as compared to control animals. (I) Serum LH level was reduced in IF-DR animals of both the sexes. (J) Serum leptin level was lower in IF-DR animals of both sexes as compared to their respective control group. Diestrous female rats showed higher level of serum leptin than pro-estrous phase rats. Values are mean ±SEM. *pValue<0.05.
Figure 2
Figure 2. Representative immunohistochemical staining and RT-PCR data of NPY.
Immunostained images of 30 µ thick coronal sections from median eminence-arcuate (ME-ARC) region of female rats in pro-estrous (PRO) and diestrous (DIE) phase, ad libitum fed (AL) and Intermittent fasting dietary restricted female and male (n = 5 each) rat brain. The DAB staining in the ME-ARC region for NPY is shown for AL and IF-DR female rats (A and B), PRO and DIE phase female rats (C and D), and AL and IF-DR male rats (E and F), respectively. NPY-ir was higher in IF-DR rats as compared to their corresponding control (AL) female (B and A) and male (F and E) rats. NPY-ir was reduced in DIE phase as compared to PRO phase in female rats. (J) Median eminence-arcuate region NPY mRNA expression was enhanced in IF-DR male and female rats as compared to control group; however NPY mRNA expression was reduced in diestrous phase as compared to pro-estrous phase female rats. (G, H, I, K, L and M) depicts relative intensity measurement ±SEM of NPY-ir, and mRNA expression performed by an observer blind to the experiments. *pValue<0.05. Scale bar = 100 µ (A–F).
Figure 3
Figure 3. Representative immunohistochemical staining and RT-PCR data of kisspeptin.
Immunostained images of 30 µ thick coronal sections from median eminence-arcuate (ME-ARC) region of female rats in pro-estrous (PRO) and diestrous (DIE) phase, ad libitum fed (AL) and Intermittent fasting dietary restricted female and male (n = 5 each) rat brain. The DAB staining in the ME-ARC region for Kisspeptin is shown for AL and IF-DR female rats (A and B), PRO and DIE phase female rats (C and D), and AL and IF-DR male rats (E and F), respectively. Kisspeptin-ir was reduced in IF-DR rats as compared to their corresponding control (AL) female (B and A) and male (F and E) rats. Kisspeptin-ir was also reduced in DIE phase as compared to PRO phase in female rats. (J) Median eminence-arcuate region Kisspeptin mRNA expression was reduced in IF-DR male and female rats as compared to control group; Also, Kisspeptin mRNA expression was reduced in diestrous phase as compared to pro-estrous phase female rats. (G, H, I, K, L and M) depicts relative intensity measurement ±SEM of kisspeptin-ir and mRNA expression level, performed by an observer blind to the experiments. *pValue<0.05. Scale bar = 100 µ (A–F).
Figure 4
Figure 4. Representative immunofluorescent staining, Western blot and RT-PCR data of GnRH and GFAP in female rats.
Confocal immunofluorescent images of 30 µ thick coronal sections from median eminence (ME) region of ad libitum fed (AL) and Intermittent fasting dietary restricted (IF-DR) female (n = 5 each) rat brain. The immunostaining in the ME region for GnRH and GFAP is shown for GnRH (A and B), GFAP (C and D) as well as dual immunofluorescence of GnRH and GFAP (E and F) for AL and IF-DR animals, respectively. GnRH-ir was reduced in IF-DR rats as compared to their corresponding control AL fed rats (B and A). GFAP immunostaining is visible in both internal and external zone of ME in IF-DR animals (D), whereas, GFAP-ir was reduced and restricted to internal zone of median eminence in AL group (C). Further (E) and (F) represent colocalization of GFAP and GnRH. (J) Western blot hybridization for GFAP and α-tubulin from median eminence region of AL and IF-DR female rats. (L) RT-PCR results for GnRH, GFAP and actin from median eminence region of AL and IF-DR female rats. (G, M) depicts relative intensity measurement ±SEM of GnRH immunofluorescence and relative optical density, performed by an observer blind to the experiments. (H and I) depict relative intensity measurement ±SEM of GFAP immunofluorescence from internal and external zone of ME. (K and M) depict relative optical density ±SEM of GFAP western blot analysis and mRNA expression from median eminence region. *pValue<0.05. Scale bar = 60 µ (A–F).
Figure 5
Figure 5. Representative immunofluorescent staining, Western blot and RT-PCR data of GnRH and GFAP in male rats.
Confocal immunofluorescent images of 30 µ thick coronal sections from median eminence (ME) region of ad libitum fed (AL) and Intermittent fasting dietary restricted (IF-DR) male (n = 5 each) rat brain. The immunostaining in the ME region for GnRH and GFAP is shown for GnRH (A and B), GFAP (C and D) as well as dual immunofluorescence of GnRH and GFAP (E and F) for AL and IF-DR animals, respectively. GnRH-ir was reduced in IF-DR rats as compared to their corresponding control AL fed rats (B and A). GFAP immunostaining is visible in both internal and external zone of ME in IF-DR animals (D), whereas, GFAP-ir is reduced and restricted to internal zone of median eminence in AL group (C). Further (E) and (F) represent colocalization of GFAP and GnRH. (J) Western blot hybridization for GFAP and α-tubulin from median eminence region of AL and IF-DR male rats. (L) RT-PCR results for GnRH, GFAP and actin from median eminence region of AL and IF-DR male rats. (G, M) depicts relative intensity measurement ±SEM of GnRH immunofluorescence and relative optical density, performed by an observer blind to the experiments. (H and I) depict relative intensity measurement ±SEM of GFAP immunofluorescence from internal and external zone of ME. (K and M) depict relative optical density ±SEM of GFAP western blot analysis and mRNA expression from median eminence region. *pValue<0.05. Scale bar = 60 µ (A–F).
Figure 6
Figure 6. Representative immunofluorescent staining, Western blot and RT-PCR data of GnRH and PSA-NCAM in female rats.
Confocal immunofluorescent images of 30 µ thick coronal sections from median eminence-arcuate (ME) region of ad libitum fed (AL), Intermittent dietary restricted (IF-DR) and DR-R female (n = 5 each) rat brain. The immunostaining in the ME region for GnRH and PSA-NCAM is shown for GnRH (A–C), PSA-NCAM (D–F) as well as dual immunofluorescence of GnRH and PSA-NCAM (G–I) for AL fed, IF-DR and DR-R animals, respectively. Both GnRH (A–C) and PSA-NCAM (D–F) immunostaining was reduced in IF-DR animals as compared to their corresponding control as well as DR-R female rats. (O) Western blot hybridization for PSA-NCAM and α-tubulin from median eminence region of AL and IF-DR female rats. (Q) RT-PCR results for PST and actin from median eminence-arcuate region of AL and IF-DR female rats. (M) depicts relative intensity measurement ±SEM of GnRH immunofluorescence, performed by an observer blind to the experiments. (N) depict relative intensity measurement ±SEM of PSA-NCAM immunofluorescence from ME region. (P, R) depict relative optical density ±SEM of PSA-NCAM western blot analysis and PST mRNA expression level from median eminence-arcuate region. *pValue<0.05. Scale bar = 60 µ (A–I).
Figure 7
Figure 7. Representative immunofluorescent staining, Western blot and RT-PCR data of GnRH and PSA-NCAM in male rats.
Confocal immunofluorescent images of 30 µ thick coronal sections from median eminence-arcuate (ME) region of ad libitum fed (AL) and Intermittent fasting-dietary restricted (IF-DR) male (n = 5 each) rat brain. The immunostaining in the ME region for GnRH and PSA-NCAM is shown for GnRH (A and B), PSA-NCAM (C and D) as well as dual immunofluorescence of GnRH and PSA-NCAM (E and F) for AL and IF-DR animals, respectively. Both GnRH (A and B) and PSA-NCAM (C and D) immunostaining was reduced in IF-DR animals as compared to their corresponding control rats. (K) Western blot hybridization for PSA-NCAM and α-tubulin from median eminence region of AL and IF-DR male rats. (M) RT-PCR results for PST and actin from median eminence region of AL and IF-DR male rats. (I) depicts relative intensity measurement ±SEM of GnRH immunofluorescence, performed by an observer blind to the experiments. (J) depict relative intensity measurement ±SEM of PSA-NCAM immunofluorescence from ME region. (L and N) depict relative optical density ±SEM of PSA-MCAM western blot analysis and PST mRNA expression from median eminence region. *pValue<0.05. Scale bar = 60 µ (A–F).

References

    1. Wade G, Jones E (2004) Neuroendocrinology of nutritional infertility. Am J Physiol Regul Integr Comp Physiol 287: 1277–1296. - PubMed
    1. Tropp J, Markus EJ (2001) Effect of mild food deprivation on the estrous cycle of rats. Physiol Behav 73: 553–559. - PubMed
    1. Hill JW, Elmquist JK, Elias CF (2008) Hypothalamic pathways linking energy balance and reproduction. Am J Physiol Endocrinol Metab 294: E827–32. - PMC - PubMed
    1. Booth PJ, Cosgrove JR, Foxcroft GR (1996) Endocrine and metabolic responses to realimentation in feed-restricted prepubertal gilts: associations among gonadotropins, metabolic hormones, glucose, and uteroovarian development. J Anim Sci 74: 840–8. - PubMed
    1. Quesnel H, Pasquier A, Mounier AM, Prunier A (1998) Influence of feed restriction during lactation on gonadotrophic hormones and ovarian development in primiparous sows. J Anim Sci 76: 856–63. - PubMed

Publication types

MeSH terms