. 2013;8(1):e52955.
doi: 10.1371/journal.pone.0052955. Epub 2013 Jan 31.

A role of eye vergence in covert attention

Affiliations

A role of eye vergence in covert attention

Maria Solé Puig et al. PLoS One. 2013.

Abstract

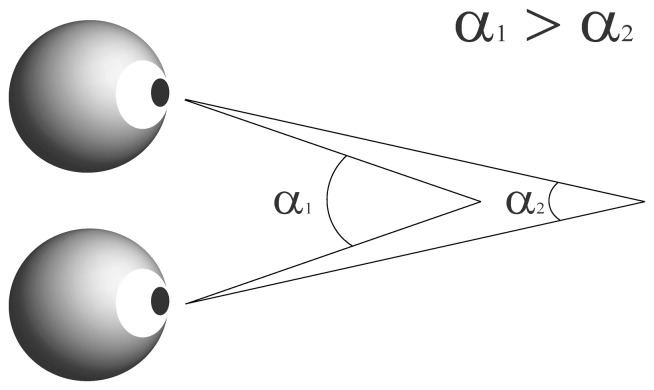
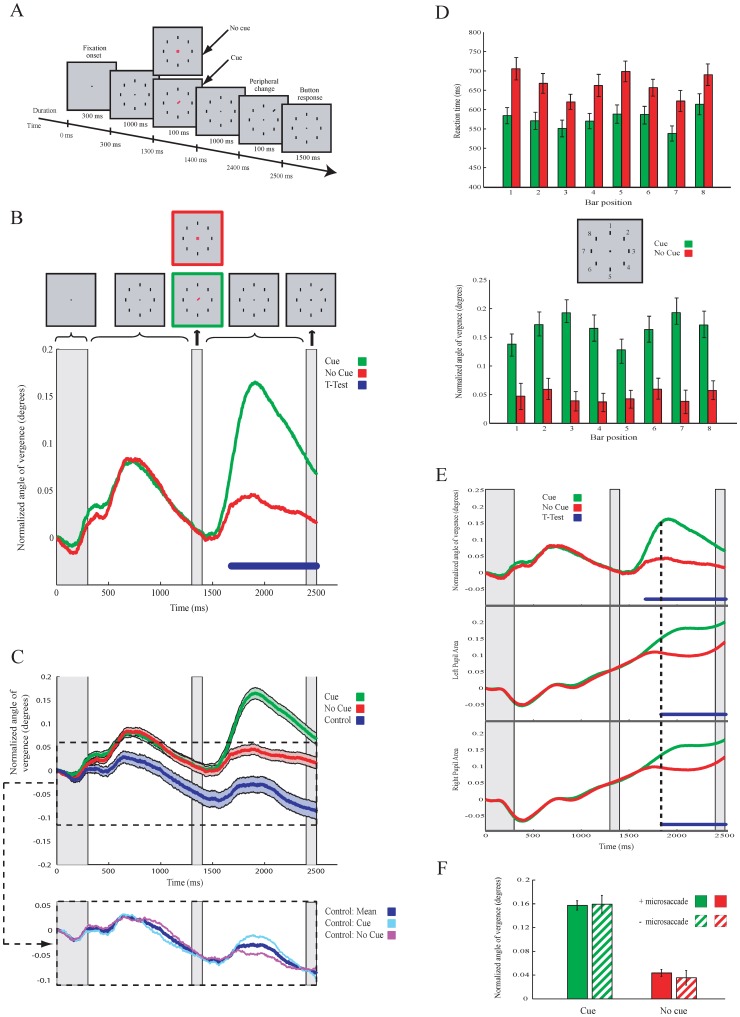
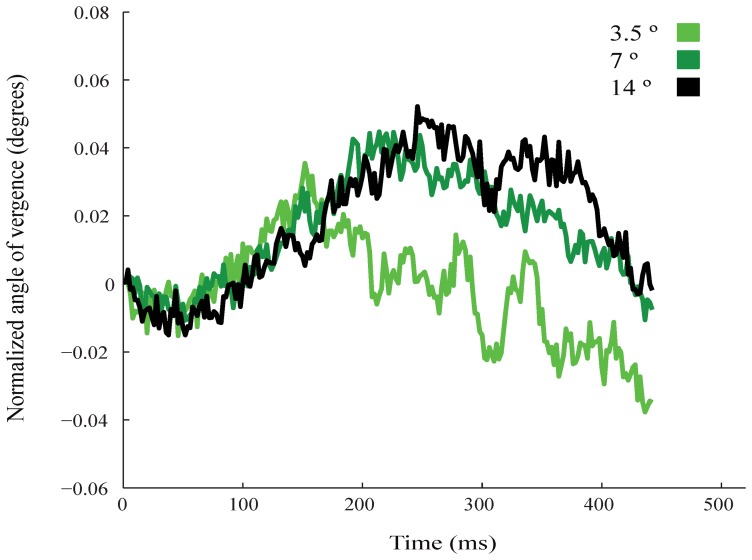
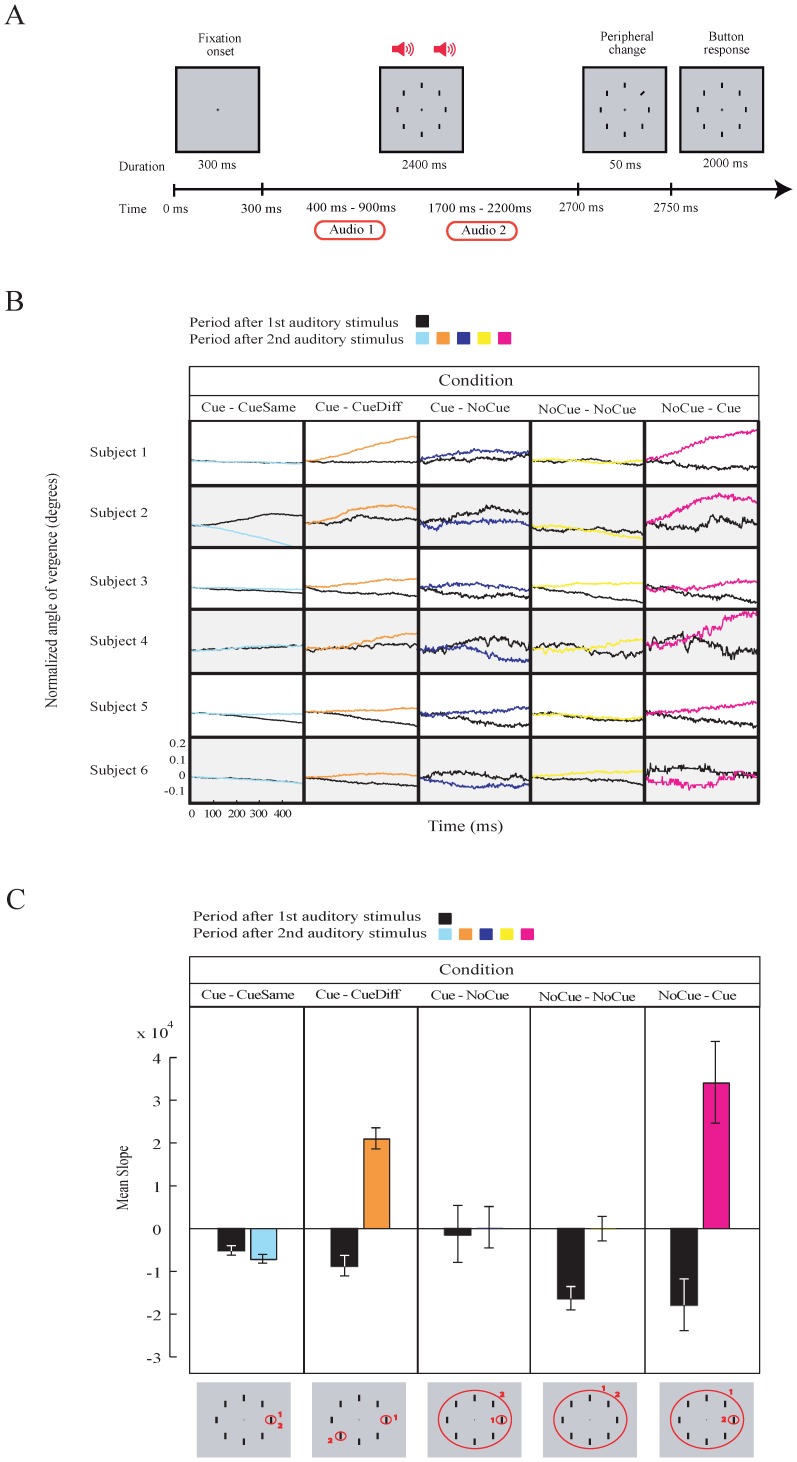
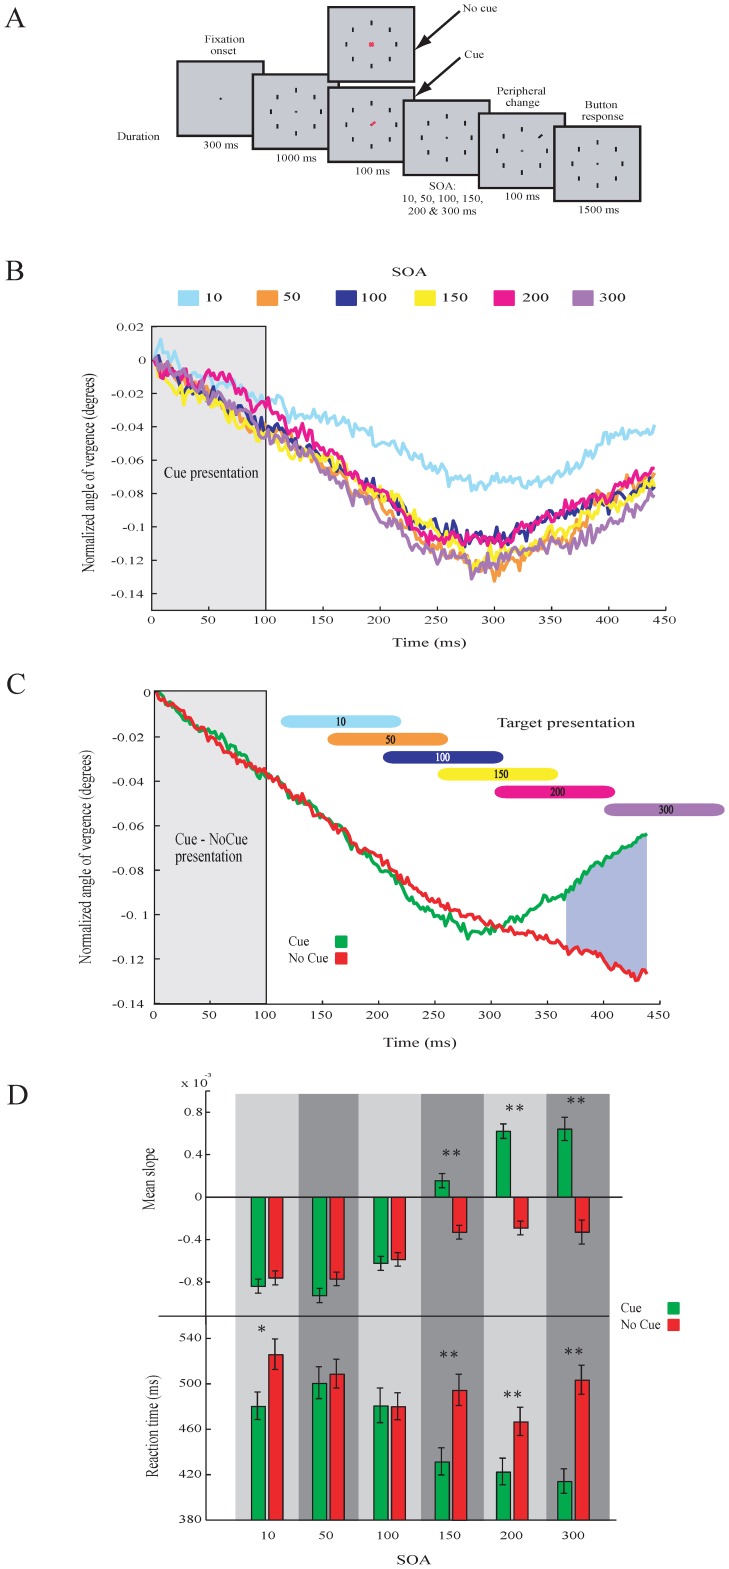
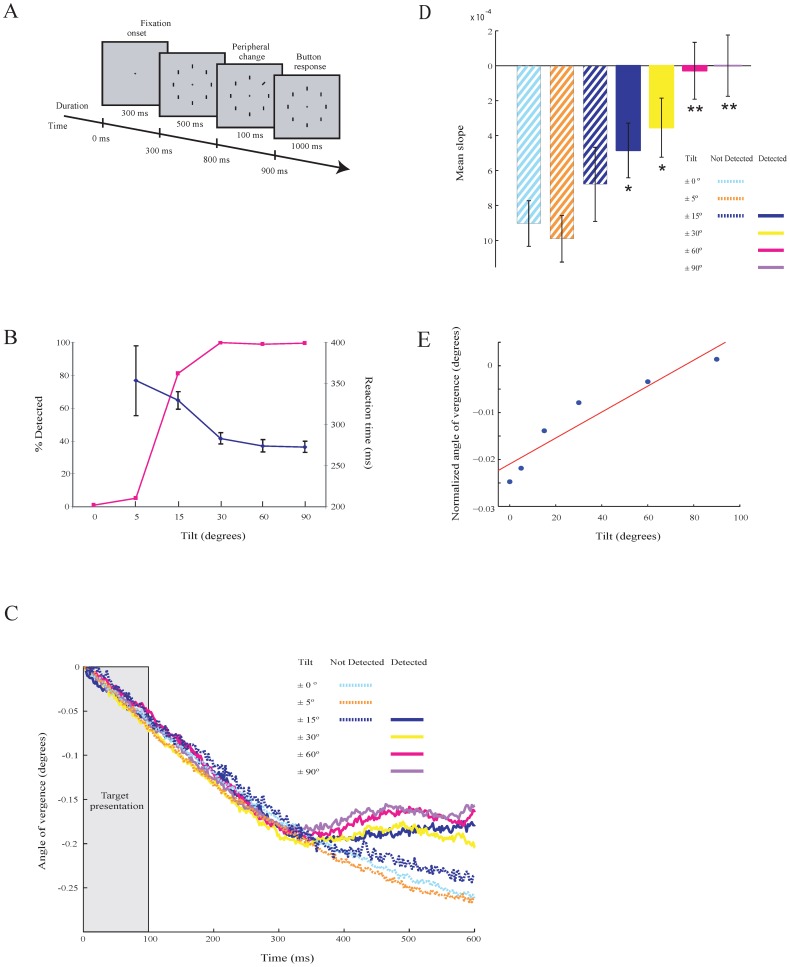
Covert spatial attention produces biases in perceptual and neural responses in the absence of overt orienting movements. The neural mechanism that gives rise to these effects is poorly understood. Here we report the relation between fixational eye movements, namely eye vergence, and covert attention. Visual stimuli modulate the angle of eye vergence as a function of their ability to capture attention. This illustrates the relation between eye vergence and bottom-up attention. In visual and auditory cue/no-cue paradigms, the angle of vergence is greater in the cue condition than in the no-cue condition. This shows a top-down attention component. In conclusion, observations reveal a close link between covert attention and modulation in eye vergence during eye fixation. Our study suggests a basis for the use of eye vergence as a tool for measuring attention and may provide new insights into attention and perceptual disorders.


Conflict of interest statement

Competing Interests: The authors have declared that no competing interests exist.

Figures

Figure 1
Figure 1. Schematic explanation of the angle of eye vergence.
The eyes focus on a single point in space. The angle of eye vergence relates to the distance of the focus point to the eyes. For a near point the vergence angle (α1) is larger than for a far point (α2). α represents the angle of eye vergence.
Figure 2
Figure 2. Visual search task of Experiment 1 and modulation in eye vergence while performing the task.
A. Illustration of the Cue/no-cue task. B. Average (across all subjects) size of AoEV in the cue (green) and no-cue (red) conditions over time. Time points (blue) indicate a significant difference in AoEV between both conditions. C. As in B, but with the average modulation in AoEV (blue trace) from a control task (Experiment 2). Shaded areas represent ±1 times SEM around the mean. Lower panel shows the modulation in AoEV separately for the cue and no-cue conditions of the control task. D. Mean reaction time and size of the AoEV for individual targets. Error bars are SEM. E. Modulation of AoEV (upper panel) and pupil size of the left (middle) and right (lower) eye. F. Mean sizes of AoEV in trials with and without micro-saccades in the cue and no-cue condition. Error bars are SEM.
Figure 3
Figure 3. Control task showing modulation in eye vergence for targets located at different eccentricities from the fixation point.
Data is from the cue condition. Colors denote eccentricity. Time is 320 ms from cue onset.
Figure 4
Figure 4. Visual search task combined with auditory cues
(Experiment 3) and modulation in eye vergence. A. Illustration of the auditory task. Symbols denote cue. Two consecutive cues are given to the subjects B. Average size of AoEV after the onset of the 1st (black traces) and 2nd (colored traces) auditory cue for individual subjects. C. Comparison between the slopes of the modulation (taken from windows in B) of AoEV after the 1st and 2nd auditory cue. Grey panels below illustrate the shift in visuospatial attention (red circles) for each condition. Small circles indicate focused attention to a single target while a large circle indicates global or more spread attention to all possible target location. Numbers indicate the size and position of the attention window after the 1st (1) and 2nd (2) cue. Error bars are SEM.
Figure 5
Figure 5. Visual search task
(Experiment 4) with different SOA and modulation in eye vergcence. A. Illustration of the task. B. Average modulation across all subjects in AoEV separately for the different conditions (SOA). C. Average modulation in AoEV across all conditions. Colored vertical bars indicate the window of target presentation. Blue shaded area denotes a significant (p<0.01) difference between the cue and no-cue condition. D. Slopes of the modulation of AoEV and mean reaction times for the cue and no-cue of the different conditions (SOA). Bars represent the mean slopes, calculated for each condition (windows of 100 ms after target onset). Asterisks denote significant (* = p<0.05, ** = p<0.01, t-test) differences. Error bars are SEM.
Figure 6
Figure 6. Detection task
(Experiment 5) and responses. A. Illustration of the task. B. Detection performance (red) and reaction times (blue). Error bars are SEM. C. Modulation in AoEV of one subject separately for the different conditions (tilt) and behaviors (detected and undetected). D. Slopes of the modulation of the AoEV for the different conditions and behaviors. Asterisks denote significant (* = p<0.05, ** = p<0.01) differences (compared to condition 00). Error bars are SEM. E. Mean vergence angle of selected window from all conditions plotted as a function of stimulus contrast. A linear regression line (red) is fitted.

References

    1. Posner MI (1980) Orienting of attention. The 7th Sir F.C. Bartlett Lecture. Quartly Journal Experimental Psychology 32: 3–25. - PubMed
    1. Wright RD, Ward LM (2008) Orienting of Attention. Oxford University Press.
    1. Bisley JW (2011) The neural basis of visual attention. J Physiology 589: 49–57. - PMC - PubMed
    1. Hafed ZM, Clark JJ (2002) Microsaccades as an overt measure of covert attention shifts. Vision Research 42: 2533–2545. - PubMed
    1. Engbert R, Kliegl R (2003) Microsaccades uncover the orientation of covert attention. Vision Research 43: 1035–1045. - PubMed

Publication types