. 2013;8(1):e53853.
doi: 10.1371/journal.pone.0053853. Epub 2013 Jan 31.

Signaling pathways of ESE-16, an antimitotic and anticarbonic anhydrase estradiol analog, in breast cancer cells

Affiliations

Signaling pathways of ESE-16, an antimitotic and anticarbonic anhydrase estradiol analog, in breast cancer cells

Barend Andre Stander et al. PLoS One. 2013.

Erratum in

  • PLoS One. 2013;8(10). doi: 10.1371/annotation/6afd5e63-46d6-42a1-b661-6688a04bfd16

Abstract

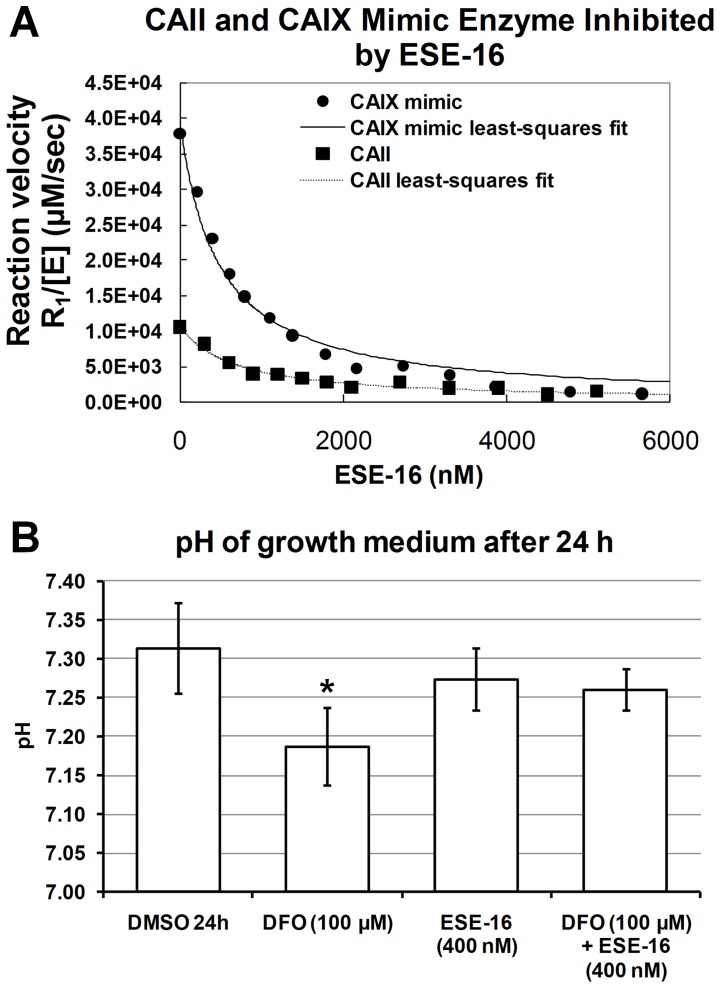
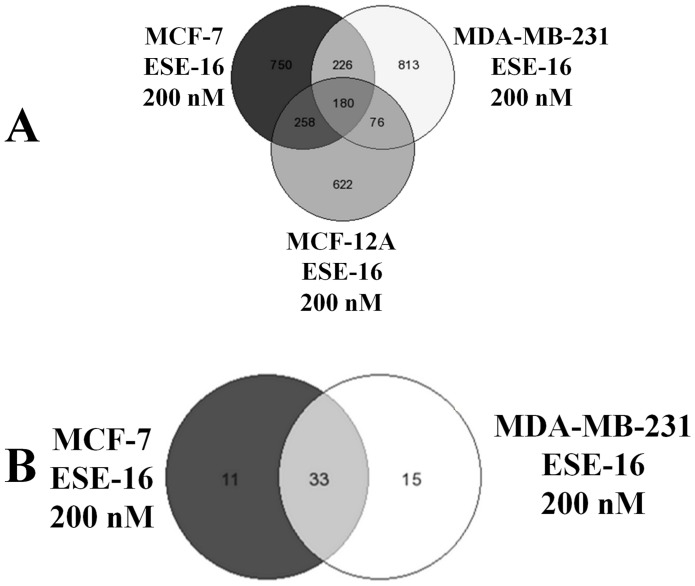
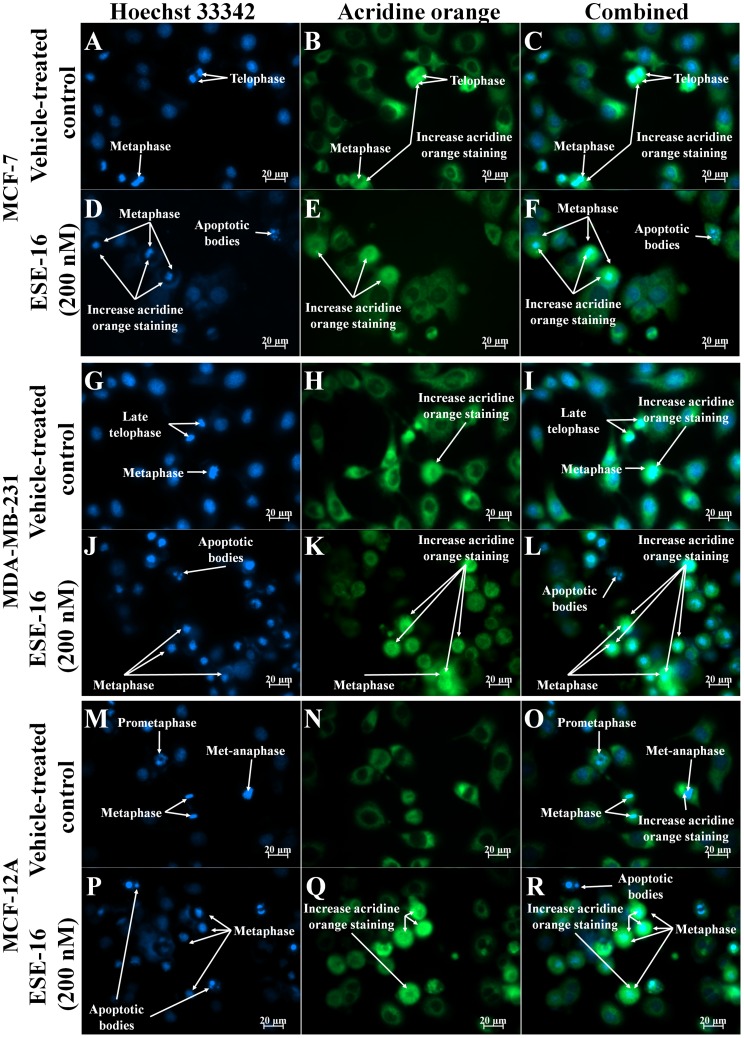
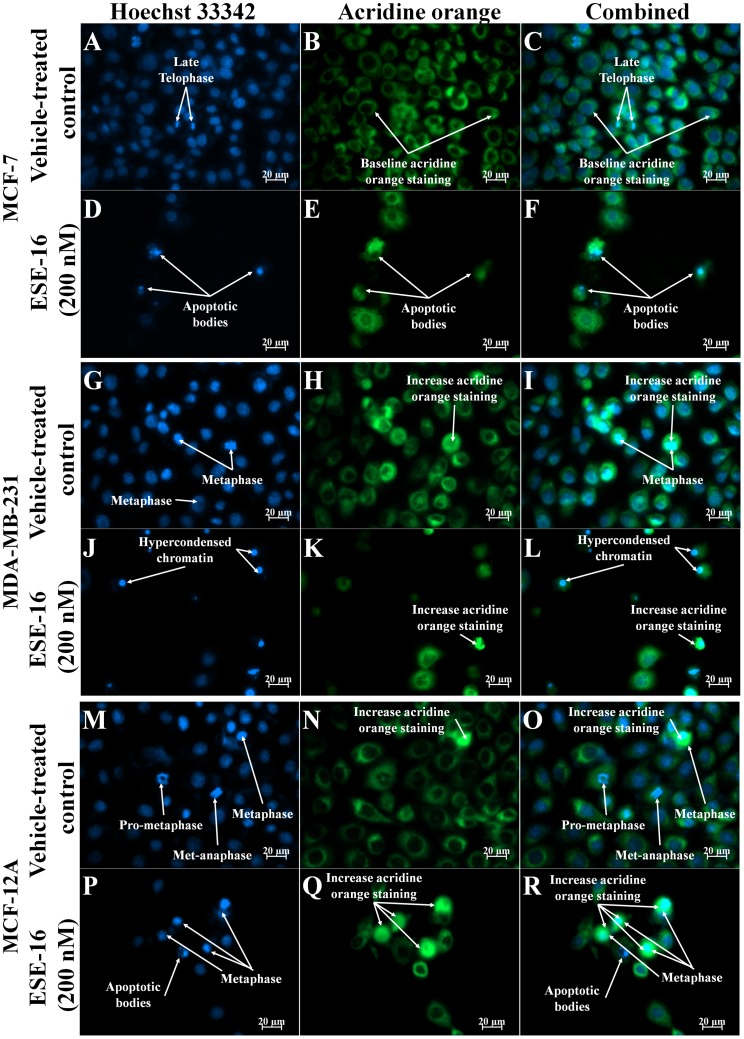
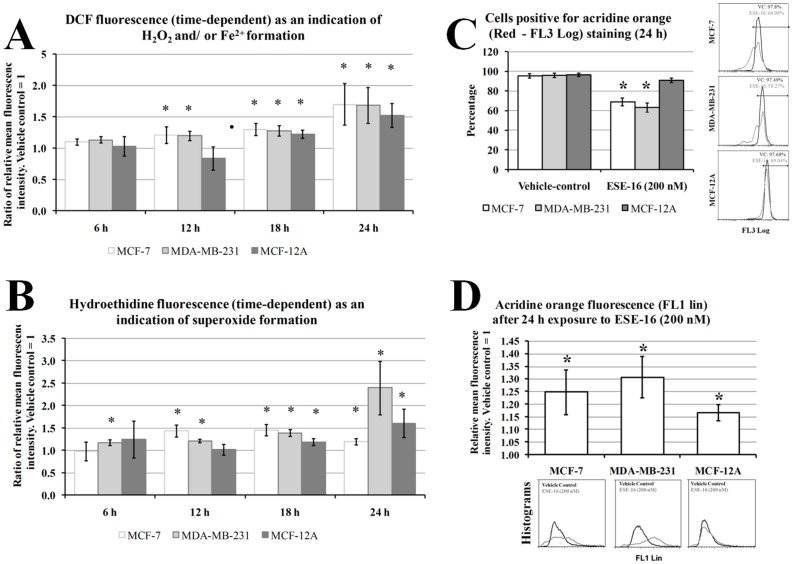
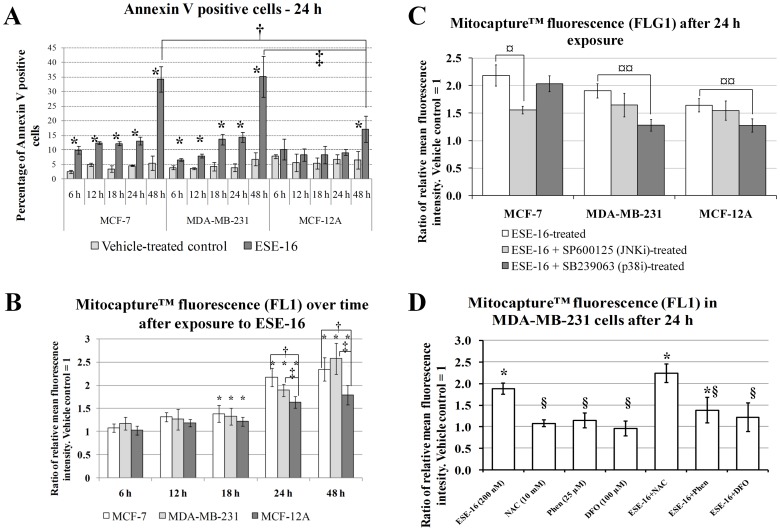
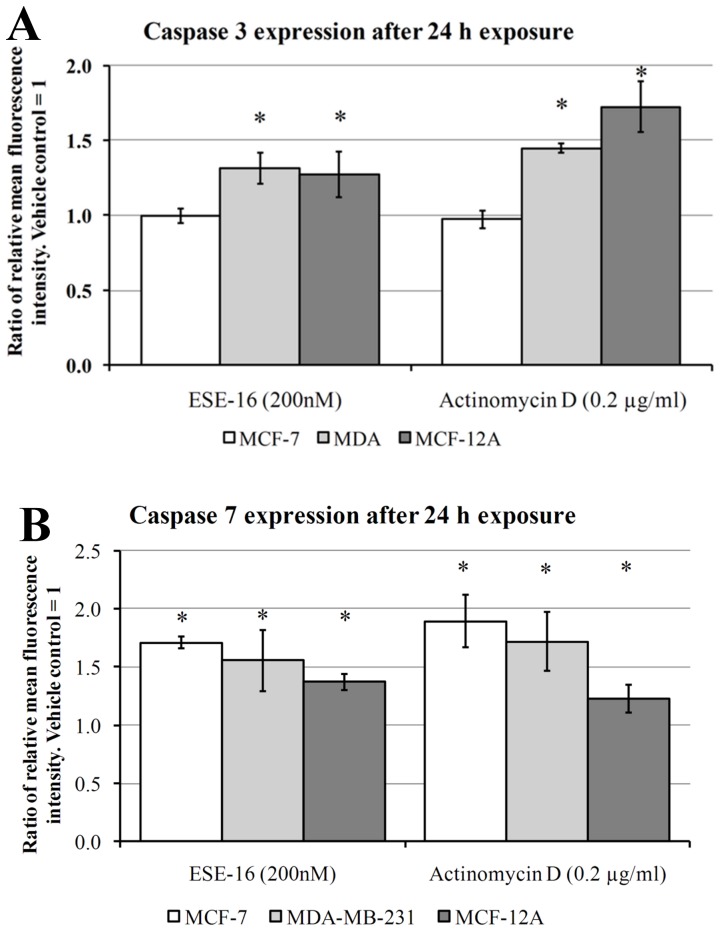
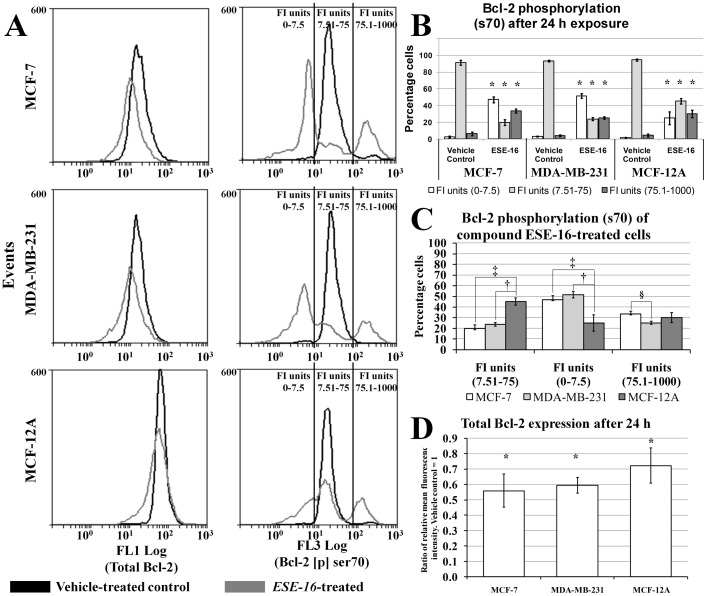
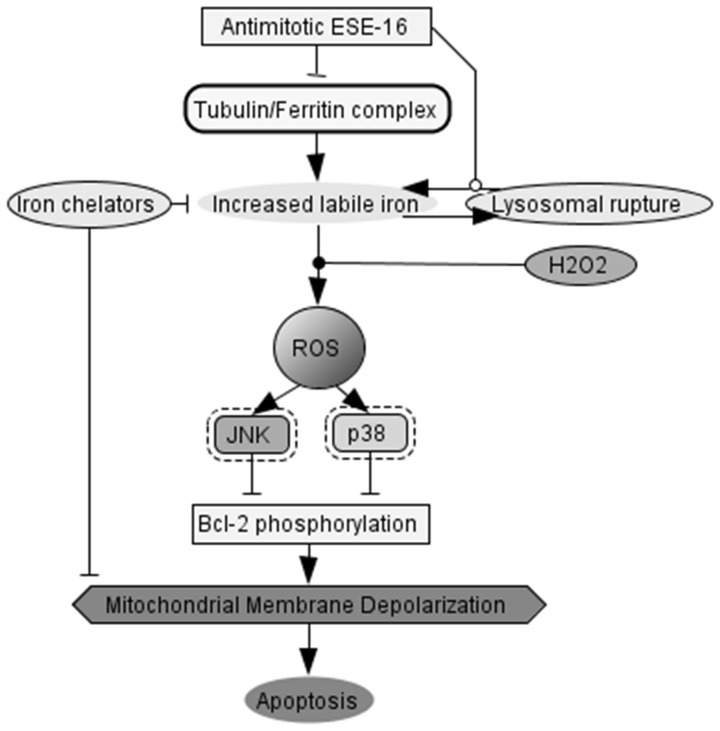
The aim of this study was to characterize the in vitro action of 2-ethyl-3-O-sulphamoyl-estra-1,3,5(10)16-tetraene (ESE-16) on non-tumorigenic MCF-12A, tumorigenic MCF-7 and metastatic MDA-MB-231 breast cancer cells. ESE-16 is able to inhibit the activity of a carbonic anhydrase II and a mimic of carbonic anhydrase IX in the nanomolar range. Gene and protein expression studies using various techniques including gene and antibody microarrays and various flow cytometry assays yielded valuable information about the mechanism of action of ESE-16. The JNK pathway was identified as an important pathway mediating the effects of ESE-16 while the p38 stress-induced pathway is more important in MDA-MB-231 cells exposed to ESE-16. Lysosomal rupture and iron metabolism was identified as important mediators of mitochondrial membrane depolarization. Abrogation of Bcl-2 phosphorylation status as a result of ESE-16 also plays a role in inducing mitochondrial membrane depolarization. The study provides a basis for future research projects to develop the newly synthesized compound into a clinically usable anticancer agent either alone or in combination with other agents.

Keywords: Antimitotic, anticarbonic anhydrase IX, apoptosis, autophagy, cell cycle arrest, Bcl-2, JNK, p38, mitochondrial membrane depolarization, flow cytometry, gene expression and protein microarray, anticancer.


Conflict of interest statement

Competing Interests: The authors have declared that no competing interests exist.

Figures

Figure 1
Figure 1. Kinetics data of ESE-16 and the effects of ESE-16 on extracellular acidity in MDA-MB-231 cells after 24 h exposure.
A) Variation with concentration of ESE-16 of the reaction velocity (R1/[E]) of wild-type CAII and a mimic of CAIX as determined by the catalysis of 18O exchange. Wild-type CAII Ki = 569±61 nM and CAIX mimic Ki = 453±43 nM, calculated using the Henderson method for tight-binding inhibitors. B) Changes in extracellular pH of confluent MDA-MB-231 cells treated with the CAIX inducer, DFO, and ESE-16 and a combination of DFO and ESE-16. ESE-16 inhibited DFO-induced reduction in extracellular pH.
Figure 2
Figure 2. GeneVenn diagram showing of statistically significant differentially expressed genes and proteins in MCF-7, MDA-MB-231 and MCF-12A cells after 24 h exposure.
Common genes (A) affected in MCF-7, MDA-MB-231 and MCF-12A cells, and common proteins (B) affected in MCF-7 and MDA-MB-231 cells exposed to ESE-16 (200 nM) for 24 h.
Figure 3
Figure 3. Hoechst 33342 and acridine orange-stained MCF-7, MDA-MB-231 and MCF-12A cells at 400× magnification after 24 h exposure.
Cells completing cell division are observed in vehicle-treated cells (A–C, G–I and M–O) while an increase in the number of cells blocked in metaphase is observed in and ESE-16-treated (200 nM) cells (D–E, J–L and P–R). Acridine orange staining appears to be more concentrated in actively dividing cells in both treated and untreated cells.
Figure 4
Figure 4. Hoechst 33342 and acridine orange-stained MCF-7, MDA-MB-231 and MCF-12A cells at 400× magnification after 48 h exposure.
Vehicle-treated cells (A–C, G–I and M–O) in various stages of the cell cycle are observed. Formation of apoptotic bodies are observed in ESE-16-treated cells (G–I). An increase in the number of cells in metaphase is observed in ESE-16-treated MCF-12A (P–R) cells when compared to vehicle-treated MCF-12A cells (M–O). An increase in the formation of apoptotic bodies are observed in ESE-16-treated MCF-7 (D–E) and MDA-MB-231 (J–L) cells when compared to vehicle-treated cells (A–C and G–I).
Figure 5
Figure 5. Effects of ESE-16 on ROS and lysosomal activity in MDA-MB-231, MCF-7 and MCF-12A cells after 24 h exposure.
Relative mean fluorescence intensity of DCF (FL1) (A) hydroethidine (FL3) (B) in MCF-7, MDA-MB-231 and MCF-12A cells exposed to ESE-16 (200 nM). DCF and HE fluorescence increased over time, indicating increased formation of ROS. Red (C) and green (D) acridine orange (AO) fluorescence as indicators of lysosomal stability. Red fluorescent AO accumulates in healthy lysosomes while green fluorescent AO occurs in the cytosol. Decreased red red fluorescent AO and increased green AO fluorescence indicate increases in lysosomal rupture in ESE-16-treated cells. * and * indicate a P-value <0.05 between ESE-16- and vehicle-treated cells.
Figure 6
Figure 6. Effects of ESE-16 on phosphatidylserine externalization and mitochondrial membrane depolarization in MCF-7, MDA-MB-231 and MCF-12A cells over time.
A) Measurement of phosphatidylserine externalization in MCF-7, MDA-MB-231 and MCF-12A cells. Apoptosis induction increases in a time-dependent manner in ESE-16-treated cells. The effect is more pronounced in MCF-7 and MDA-MB-231 cells. B) Comparison of differences in mitochondrial membrane depolarization in MCF-7, MDA-MB-231 and MCF-12A cells exposed to ESE-16 (200 nM) over time (6 h –48 h). Mitochondrial membrane depolarization increased in a time-dependent manner in ESE-17-treated cells. The effect is more pronounced in MCF-7 and MDA-MB-231 cells. C) The effects of JNK and p38 inhibitors on ESE-16-induced mitochondrial membrane depolarization. D) The effects of an antioxidant (NAC) and the iron chelators (DFO and 1,10-Phenanthroline) on ESE-16-induced mitochondrial membrane depolarization. * indicates a P-value <0.05 between vehicle-treated cells and ESE-16-treated (200 nM) cells. † indicates a P-value <0.05 between MCF-7 and MCF-12A cells exposed to ESE-16. ‡ indicates a P-value <0.05 between MDA-MB-231 and MCF-12A cells exposed to ESE-16. ¤ indicates a P-value <0.05 between ESE-16-treated cells and ESE-16-treated cells in combination with JNK inhibitor. ¤¤ indicates a P-value <0.05 between ESE-16-treated cells and ESE-16-treated cells in combination with p38 inhibitor. § indicates a P-value <0.05 between ESE-16-treated and other treated samples.
Figure 7
Figure 7. Effects of ESE-16 on caspase 3 and caspase 7 activity in MCF-7, MDA-MB-231 and MCF-12A cells after 24 h exposure.
Relative fluorescence intensity for Dylight™ 488-conjugated secondary antibody bound to active caspase 3 (A) (FL1 log) or active caspase 7 (B) primary antibodies (FL1 log) after 24 h exposure to ESE-16 (200 nM). * indicates a P-value <0.05 between vehicle-treated cells and ESE-16-treated cells.
Figure 8
Figure 8. Effects of ESE-16 on Bcl-2 phosphorylation and expression in MCF-7, MDA-MB-231 and MCF-12A cells after 24 h exposure.
A) Flow cytometry histograms of total Bcl-2 content (FL1 Log) and Bcl-2 phosphorylated at Ser70 (FL3 log) in MCF-7, MDA-MB-231 and MCF-12A cells after 24 h exposure to ESE-16 (200 nM). Fluorescence Intensity units = FI units. B) Bar-chart demonstrating the distribution of fluorescence intensity (FI) units of Bcl-2 (Ser 70) (FL3 Log) labeled MCF-7, MBA-MB-231 and MCF-12A cells after 24 h exposure to ESE-16 (200 nM). C) Comparison of differences in distribution of fluorescence intensity (FI) units of Bcl-2 (Ser 70) (FL3 Log) labeled MCF-7, MDA-MB-231 and MCF-12A cells after 24 h exposure to ESE-16 (200 nM). D) B) Total Bcl-2 expression after 24 h for MCF-7, MDA-MB-231 and MCF-12A cells after 24 h exposure to ESE-16 (200 nM).
Figure 9
Figure 9. Hypothesis for the mechanism of action of ESE-16 on MCF-7 cells.
ESE-16 increases labile iron due to lysosomal rupture and possibly interfering with tubulin/ferritin complexes in actively dividing cells. This in turn contributes towards ROS signaling and activates stress-activated kinases. ESE-16 exposure ultimately leads to the abrogation of Bcl-2 phosporylation and induces apoptosis via mitochondrial membrane depolarization.

References

    1. Bughani U, Li S, Joshi HC (2009) Recent patents reveal microtubules as persistent promising target for novel drug development for cancers. Recent Pat Antiinfect Drug Discov 4: 164–182. - PubMed
    1. Newman SP, Ireson CR, Tutill HJ, Day JM, Parsons MF, et al. (2006) The role of 17beta-hydroxysteroid dehydrogenases in modulating the activity of 2-methoxyestradiol in breast cancer cells. Cancer Res 66: 324–330. - PubMed
    1. Ireson CR, Chander SK, Purohit A, Perera S, Newman SP, et al. (2004) Pharmacokinetics and efficacy of 2-methoxyoestradiol and 2-methoxyoestradiol-bis-sulphamate in vivo in rodents. Br J Cancer 90: 932–937. - PMC - PubMed
    1. Supuran CT, Scozzafava A (2007) Carbonic anhydrases as targets for medicinal chemistry. Bioorganic & Medicinal Chemistry 15: 4336–4350. - PubMed
    1. Snoeks TJ, Mol IM, Que I, Kaijzel EL, Lowik CW (2011) 2-methoxyestradiol analogue ENMD-1198 reduces breast cancer-induced osteolysis and tumor burden both in vitro and in vivo. Molecular Cancer Therapeutics 10: 874–882. - PubMed

Publication types

MeSH terms