. 2013;8(1):e54084.
doi: 10.1371/journal.pone.0054084. Epub 2013 Jan 30.

40S ribosome biogenesis co-factors are essential for gametophyte and embryo development

Affiliations

40S ribosome biogenesis co-factors are essential for gametophyte and embryo development

Sandra Missbach et al. PLoS One. 2013.

Abstract

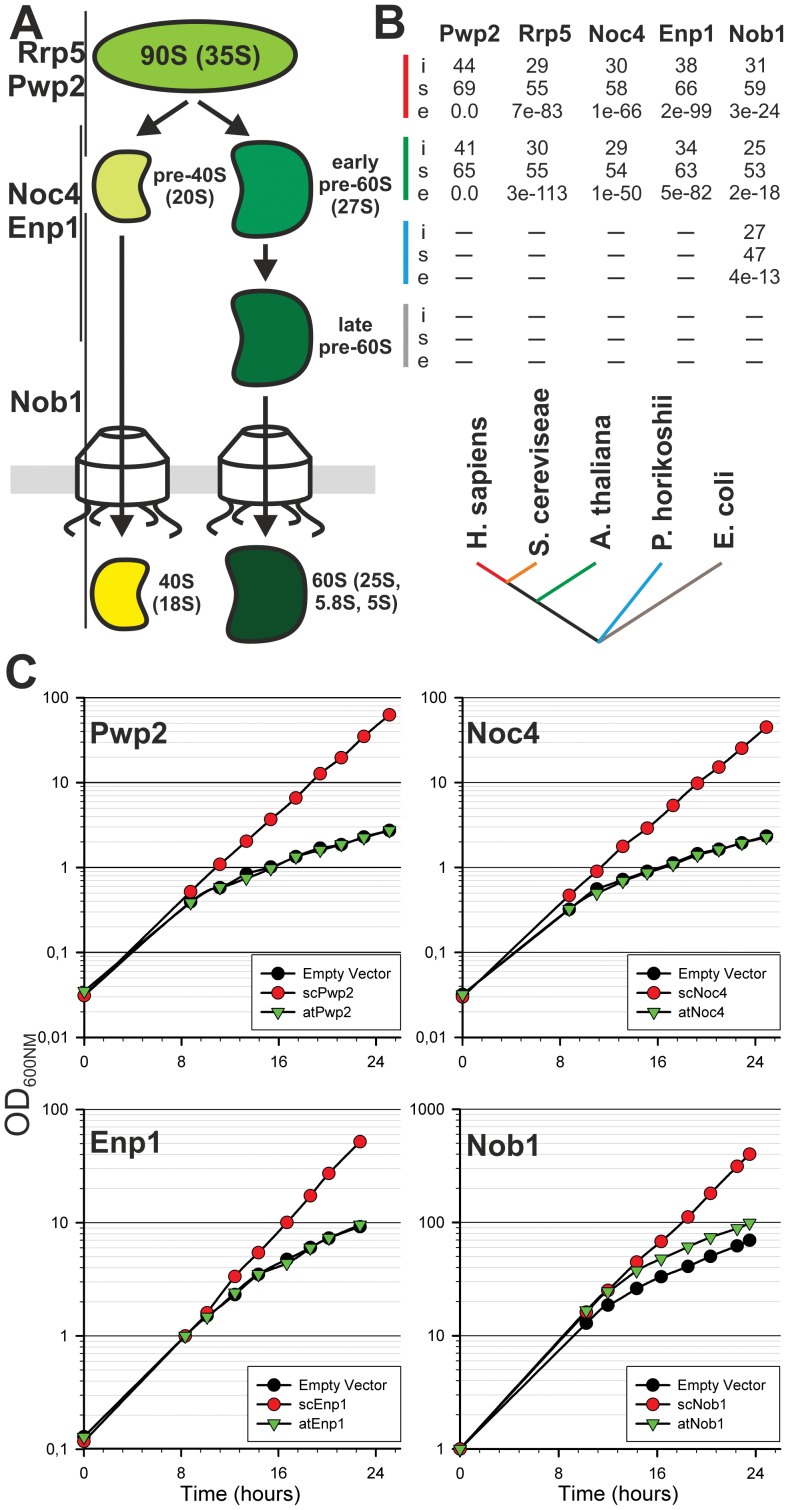
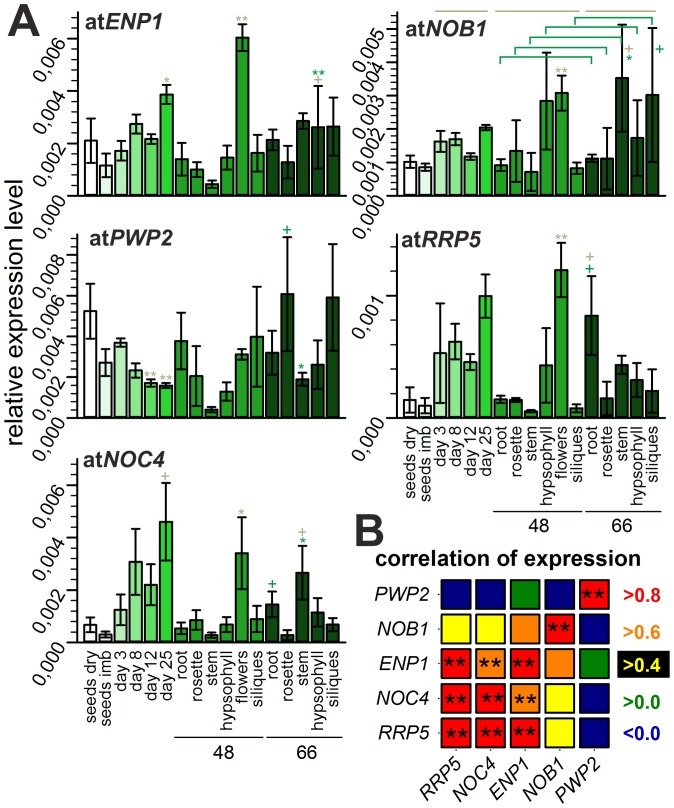
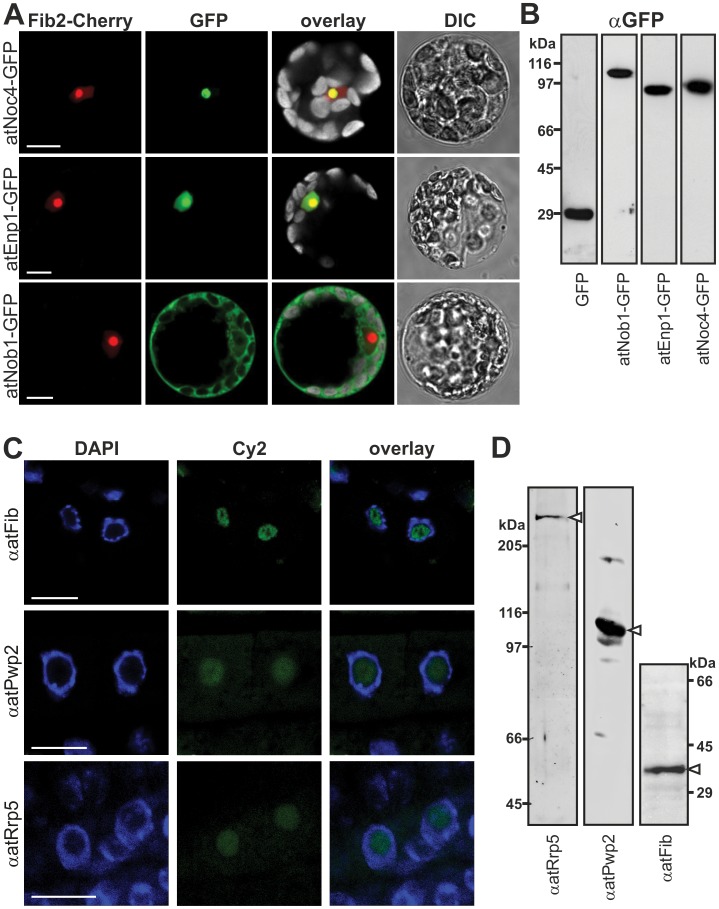
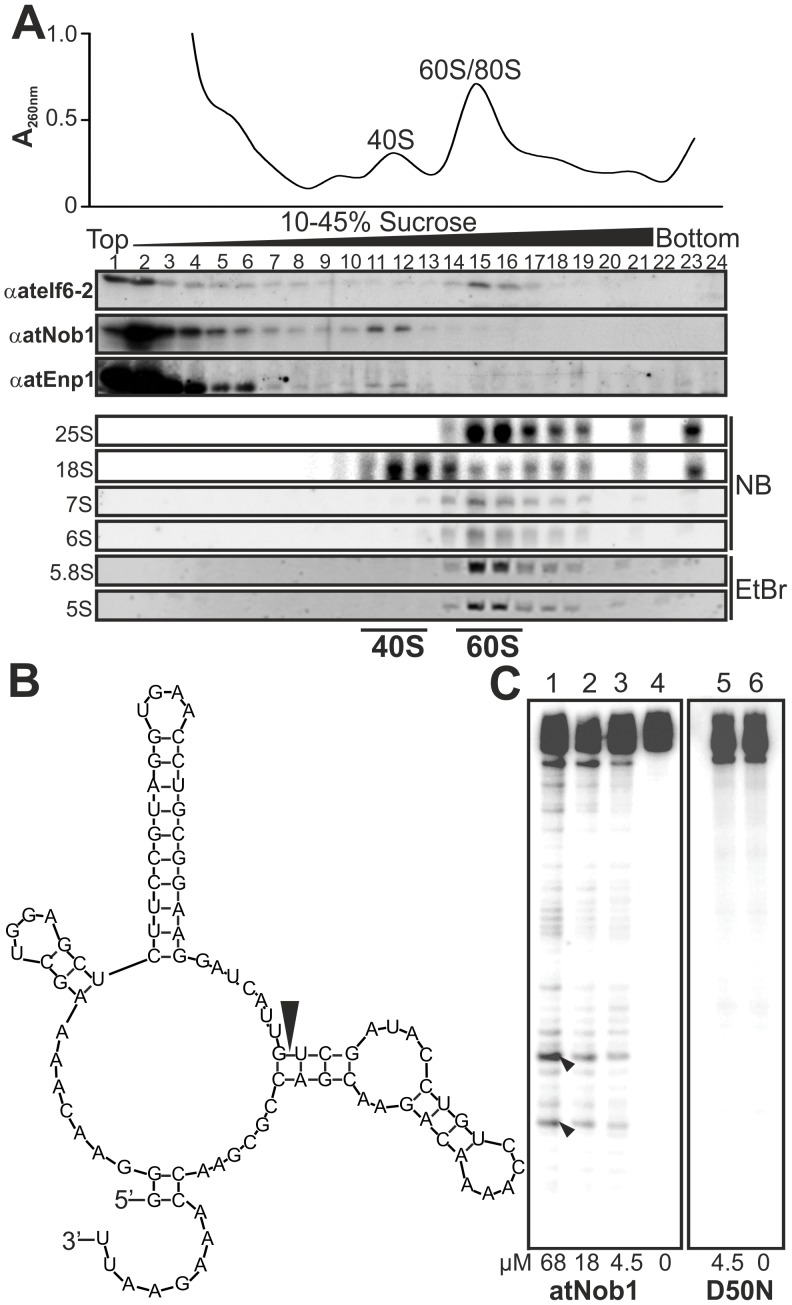
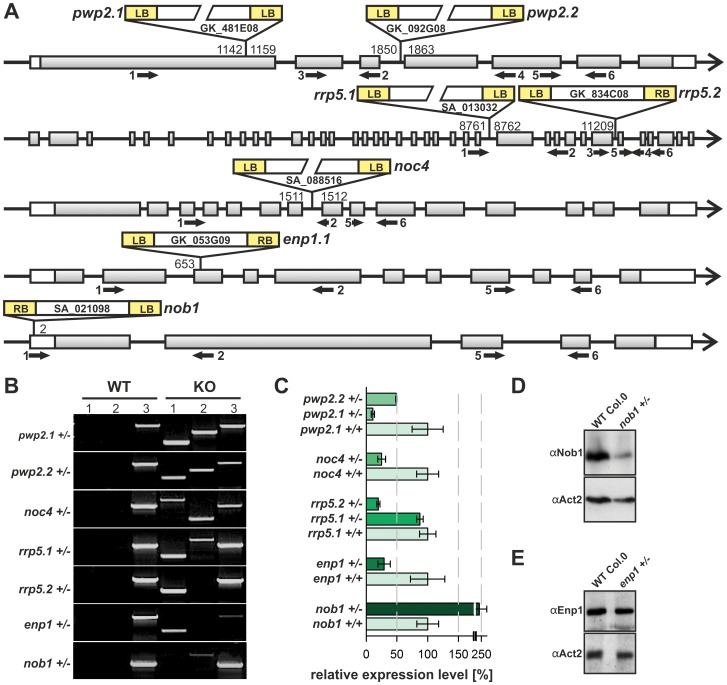
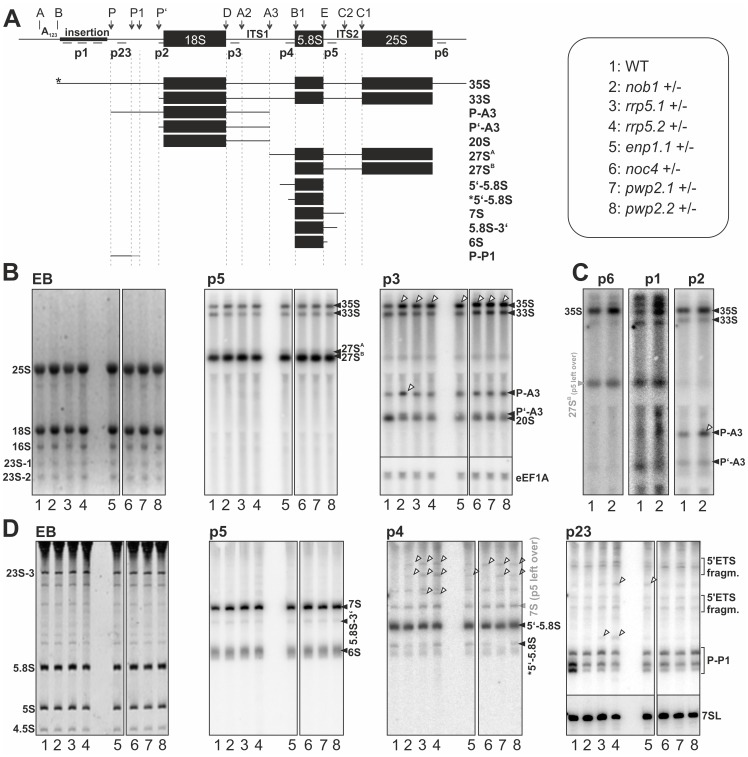
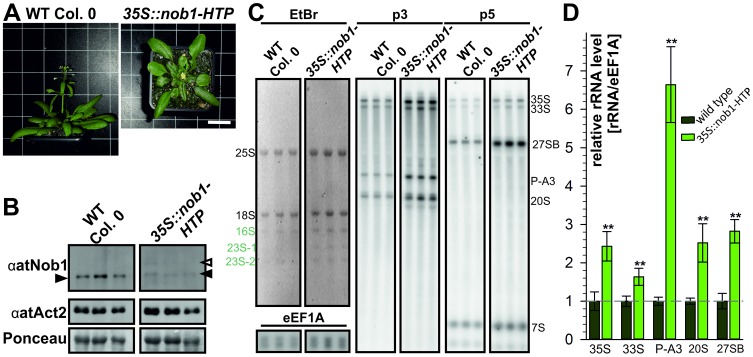
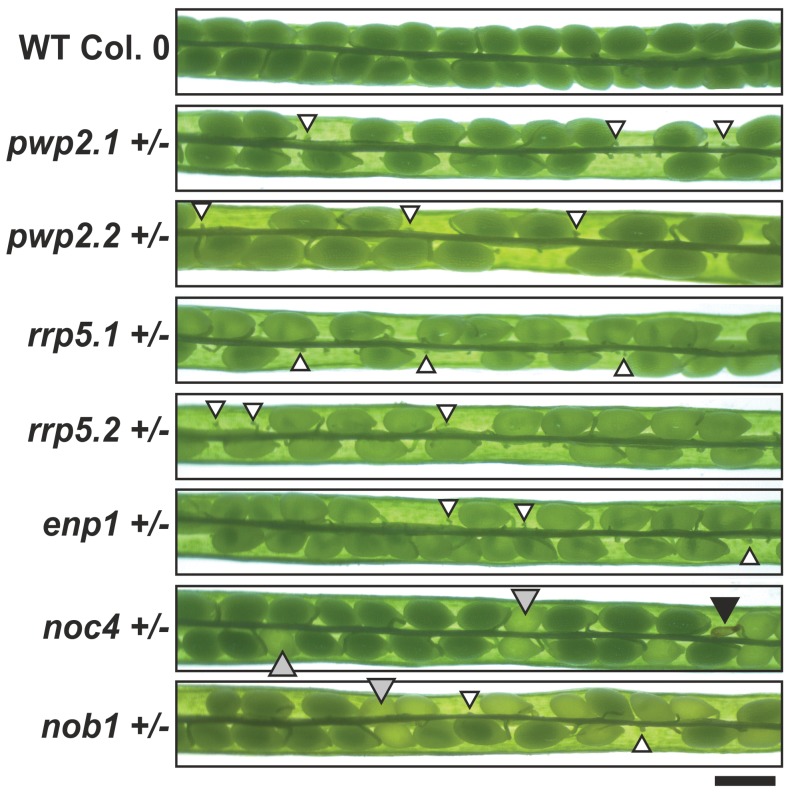
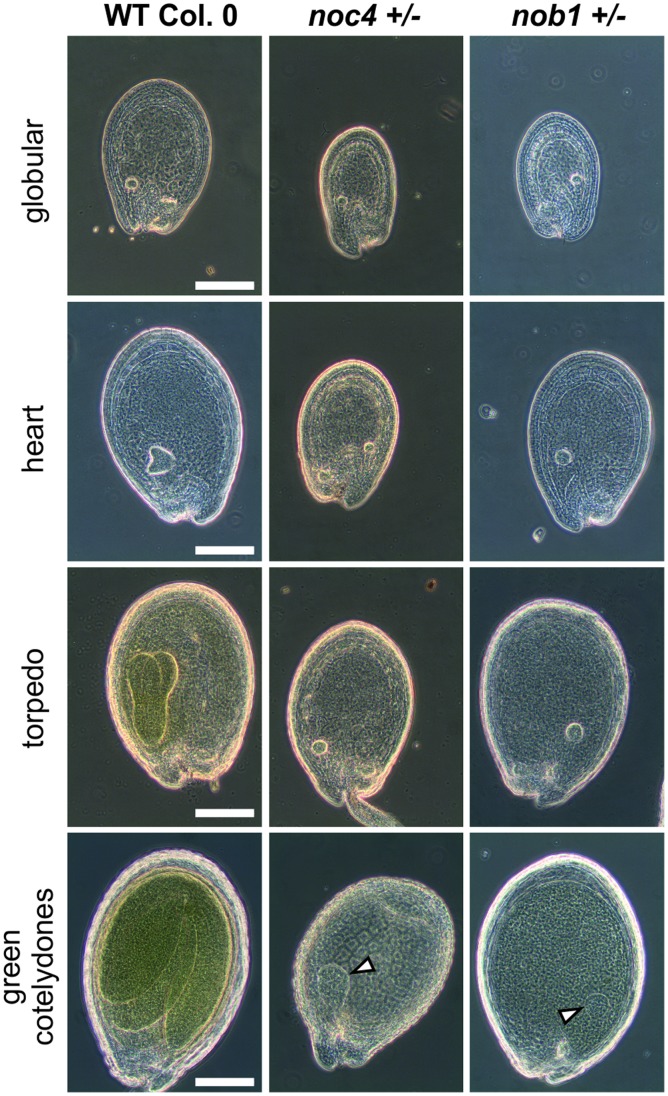
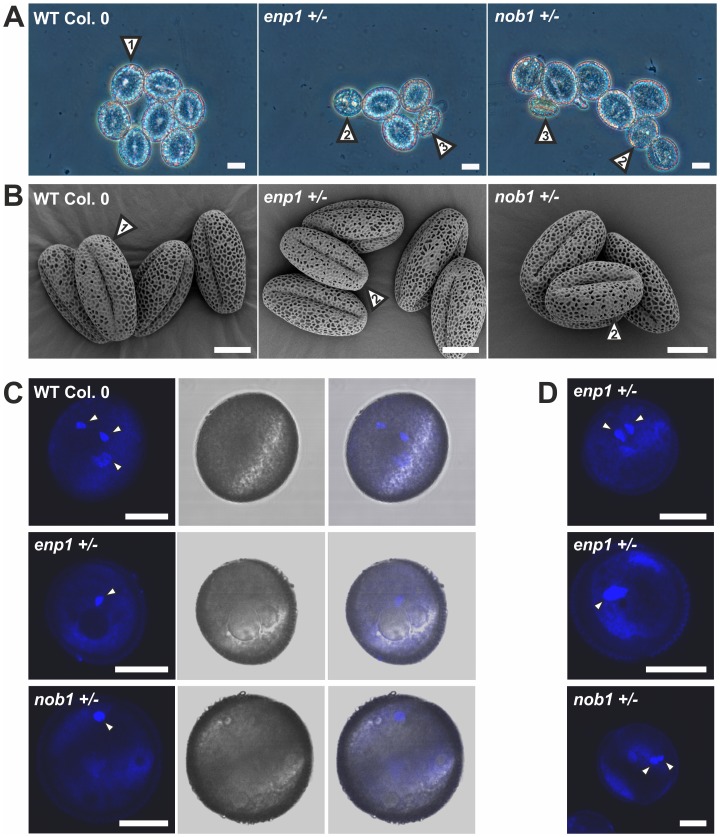
Ribosome biogenesis is well described in Saccharomyces cerevisiae. In contrast only very little information is available on this pathway in plants. This study presents the characterization of five putative protein co-factors of ribosome biogenesis in Arabidopsis thaliana, namely Rrp5, Pwp2, Nob1, Enp1 and Noc4. The characterization of the proteins in respect to localization, enzymatic activity and association with pre-ribosomal complexes is shown. Additionally, analyses of T-DNA insertion mutants aimed to reveal an involvement of the plant co-factors in ribosome biogenesis. The investigated proteins localize mainly to the nucleolus or the nucleus, and atEnp1 and atNob1 co-migrate with 40S pre-ribosomal complexes. The analysis of T-DNA insertion lines revealed that all proteins are essential in Arabidopsis thaliana and mutant plants show alterations of rRNA intermediate abundance already in the heterozygous state. The most significant alteration was observed in the NOB1 T-DNA insertion line where the P-A3 fragment, a 23S-like rRNA precursor, accumulated. The transmission of the T-DNA through the male and female gametophyte was strongly inhibited indicating a high importance of ribosome co-factor genes in the haploid stages of plant development. Additionally impaired embryogenesis was observed in some mutant plant lines. All results support an involvement of the analyzed proteins in ribosome biogenesis but differences in rRNA processing, gametophyte and embryo development suggested an alternative regulation in plants.


Conflict of interest statement

Competing Interests: The authors have declared that no competing interests exist.

Figures

Figure 1
Figure 1. Evolutionary distribution and functional conservation of selected factors.
A, Ribosome biogenesis starts with a 90S precursor which is processed to the 40S and 60S subunit. Association of the proteins during maturation of the 40S is indicated. B, The yeast factors were used as bait to perform a forward and reversed Blast search. The S. cerevisiae sequences were compared with the H. sapiens (red), A. thaliana (green), P. hirokoshii (blue) and E. coli (grey). Values for identity and similarity (in percentage; i and s, respectively) between bait and sequence identified in the corresponding species (indicated by color as in the phylogenetic scheme), and the e-value of the Blast search is given (e). A dash indicates that no sequence was identified fulfilling the criteria. C, Growth curve of Saccharomyces cerevisiae determined by the measurement of the optical density at 600nm is shown of one representative experiment (n>3).
Figure 2
Figure 2. Developmental stage and tissue dependent mRNA abundance.
A, Relative expression levels of the mRNAs are depicted in different shades of green. Error bars illustrate standard deviation of at least three independent results. The age of the investigated tissues is indicated with 48 and 66 (days) on the x-axis below the corresponding samples. The significance of changes was determined by a two-tailed paired Student’s t-test for developmental stages from day 8 to 25 in comparison to day 3 and for different tissues at day 48 or 66 normalized to values for rosette (indicated by grey lines and grey asterisks or plus). In addition, the change of expression in a specific tissue between day 48 and day 66 was analyzed (green brackets, green asterisk or plus). A plus indicates p-values below 0.005, one asterisk indicates p-values below α = 0.001 and two asterisk a p-value below α = 0.0001 B, The correlation of the expression profiles of the investigated factors. The color indicates the correlation factor and the two asterisks again a p-value below α = 0.0001. The p-values are related to the correlations and roughly indicates the probability of an uncorrelated system producing datasets that have a Pearson correlation at least as extreme as the one computed from these datasets.
Figure 3
Figure 3. Cellular localization of ribosome biogenesis co-factors.
A, Arabidopsis mesophyll protoplasts were co-transformed with C-terminal GFP fusion constructs indicated (left) and atFib2-mCherry (nucleolar marker). Cherry- (red), GFP- (green), chlorophyll auto-fluorescence (grey, in overlay) and DIC image is shown. Scale bar = 10 µm. B, Arabidopsis mesophyll protoplasts transformed with C-terminal GFP fusion constructs were lysed, subjected to SDS-PAGE and immunodecorated with GFP. C, Arabidopsis root tip cells were incubated with primary antibodies (left) and secondary antibody labeled with Cy2 fluorophore (green). Tissues were stained with DAPI (blue) to visualize the nucleus. Scale bar: 10 µm. D, Arabidopsis cell culture extract subjected to SDS-PAGE followed by Western Blot analysis using the indicated antibodies. White arrows point to expected migration of the protein.
Figure 4
Figure 4. AtNob1 and AtENP1 are components of the 40S pre-ribosome.
A, Arabidopsis cell culture lysate was applied to continuous sucrose gradient centrifugation. The absorption profile is shown on top. Fractions were collected and subjected to SDS-PAGE and Western blot analysis with indicated antibodies. RNA of the fractions was isolated and rRNA content was determined by northern blot analysis (NB) or EtBr staining. B, Secondary structure prediction of the RNA probe used for the cleavage assay is shown. The black arrow points to the predicted cleavage site D. C, Internally labeled in vitro transcribed RNA was incubated with recombinant atNob1 and the D50N mutant. Black arrows indicate the expected cleavage products.
Figure 5
Figure 5. Analysis of T-DNA insertion mutants.
A, Positions of the T-DNA within the genes are shown. Accession numbers of the plant lines and the name used here is given. The base position verified by T-DNA mapping (Table S1) is indicated on the left or right border of the insertion. Black arrows indicate primer binding sites used for the analysis (Table S2). B, Segregation state of insertion lines was verified with PCR. The T-DNA left border primer was combined either with the forward (lane 1) or reverse genomic primer (lane 2). For lane 3 the forward and reverse genomic primers were used. C, mRNA-levels in wild-type and mutants were analyzed by qRT-PCR. Values were normalized to ACT2 and the wild-type level was set to 100% for comparison to the expression level in mutants. Oligonucleotides are listed in Table S2. D, Protein levels of atNob1 in WT and nob1+/− were determined by immunodecoration of plant extract with αNOB1 or αACT2 antibodies (loading control). E, Protein levels of atEnp1 in WT and enp1+/− were determined by immunodecoration of plant extract with αEnp1 or αAct2 antibodies (loading control).
Figure 6
Figure 6. rRNA processing in wild-type and mutant plants.
A, The scheme of pre-rRNA processing indicating cleavage sites (top) and the expected intermediates is shown. Names of intermediates (right) and numbers used in B–D (left) are given. Priming sites for Northern probes are indicated. Stars indicate unknown processing positions. B, RNA from flowers indicated (bottom) was separated on agarose gel, stained with EtBr (left) for visualization of mature rRNAs or Northern blotted with probe p5 (middle) or p3 (left) to detect pre-rRNA. The eEF1A RNA was probed as control (see right). Migration of rRNA intermediates is indicated (right). C, RNA from wild-type and nob1+/− plants was probed with p6 (left), p1 (middle) or p2 (left). Migration of rRNA intermediates is indicated (right). D, RNA from plants indicated (bottom) was separated by acrylamide gel, stained with EtBr (left) for visualization of mature rRNAs or Northern blotted with probe p5, p4 or p23 to detect pre-rRNA. Migration of rRNA intermediates is indicated (right). The 7SL RNA was probed as control; shown on the right. For B–D: alterations between wild-type and mutant lines are indicated by tilted arrows. Please note, all probes were used on the same blot and images were processed simultaneously.
Figure 7
Figure 7. Analysis of co-suppression mutants of nob1.
A, To visualize the growth and flowering phenotype of wild type and nob1 co-suppression mutants two representative 30 day old plants are shown. Scale bar: 30 mm for both panels. B, For protein expression study of wild type and nob1 co-suppression mutants (upper panel) three independent wild type plants and three independent nob1 co-suppression mutants (independent transformation events) were used. As loading control αActin antibody (middle panel) and Ponceau staining (lower panel) are depicted. C, For northern blot analysis total RNA from leaves was loaded on a agarose gel. Three representative, independent plant lines are presented. EtBr staining of the gel is shown (left). As a loading control a probe against eEF1A was used. The migration of the pre-rRNAs is indicated on the right. D, The northern blot quantification of the major transcripts (35S, 33S, P-A3, 20S and 27SB) was normalized to the signal of eEF1A after background correction. For wild type three replicates were used. For the co-suppression mutants of nob1 six plant lines derived from four independent transformation events were used for quantification. To statistically analyze the changes of pre-rRNA values a Students’s t-test was performed. The two asterisk indicate a p-value below 0.005.
Figure 8
Figure 8. Embryo development of heterozygous mutants.
Wild-type and indicated mutants siliques were dissected to visualize the seeds. Black arrows indicate aborted seeds, white arrows undeveloped seeds and grey arrows pale seeds. Scale bar: 200 µm.
Figure 9
Figure 9. Embryos in pale seeds of noc4+/− and nob1+/− arrest in globular stage.
Seeds from wild-type and insertion lines were bleached for visualization with a phase contrast microscope. Scale bars: 100 µm.
Figure 10
Figure 10. Pollen of enp1+/− and nob1+/− are delayed in development.
A, Pollen of wild type, enp1+/− and nob1+/− was analyzed with a phase contrast microscope. Scale bars: 10 µM. B, Pollen of wild type and mutant plants were visualized by scanning electron microscopic pictures. Scale bar: 10 µM. C, The pollen was stained with DAPI to visualize the nuclei (left panel). The middle panel shows the DIC image of the pollen, the right panel the overlay of both. White arrows indicate the stained nuclei. Scale bar: 10 µM. D, Additional enp1+/− and nob1+/− pollen is presented to verify the arrest in pollen development. The pollen was stained with DAPI. White arrows indicate the stained nuclei. Scale bar: 10 µM.

References

    1. Venema J, Tollervey D (1999) Ribosome synthesis in Saccharomyces cerevisiae . Annu Rev Genet 33: 261–311. - PubMed
    1. Kressler D, Linder P, de La Cruz J (1999) Protein trans-acting factors involved in ribosome biogenesis in Saccharomyces cerevisiae . Mol Cell Biol 19: 7897–912. - PMC - PubMed
    1. Fromont-Racine M, Senger B, Saveanu C, Fasiolo F (2003) Ribosome assembly in eukaryotes. Gene 313: 17–42. - PubMed
    1. Henras AK, Soudet J, Gérus M, Lebaron S, Caizergues-Ferrer M, et al. (2008) The post-transcriptional steps of eukaryotic ribosome biogenesis. Cell Mol Life Sci 65: 2334–59. - PMC - PubMed
    1. Huang Y, Maraia RJ (2001) Comparison of the RNA polymerase III transcription machinery in Schizosaccharomyces pombe, Saccharomyces cerevisiae and human. Nucleic Acids Res 29: 2675–90. - PMC - PubMed

Publication types

MeSH terms