

Predicting cell types and genetic variations contributing to disease by combining GWAS and epigenetic data
- PMID: 23382893
- PMCID: PMC3559682
- DOI: 10.1371/journal.pone.0054359
Predicting cell types and genetic variations contributing to disease by combining GWAS and epigenetic data
Abstract
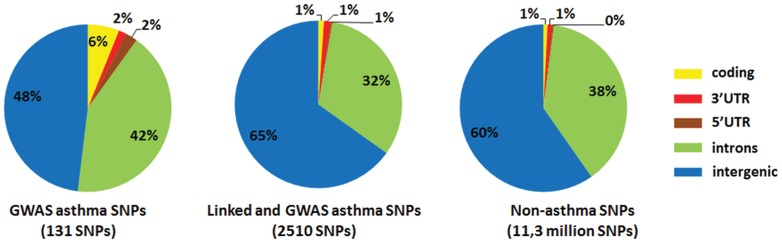
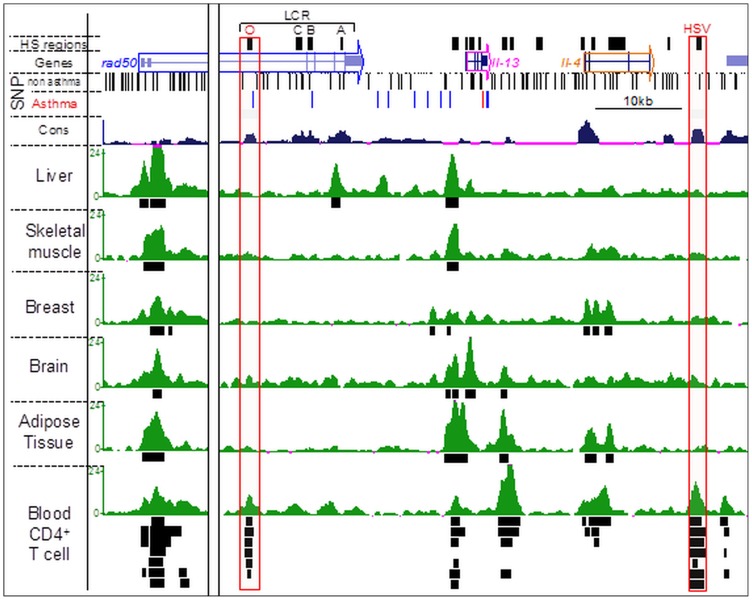
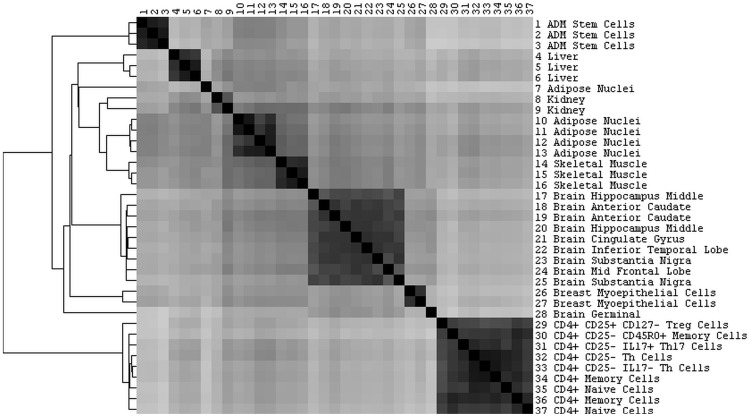
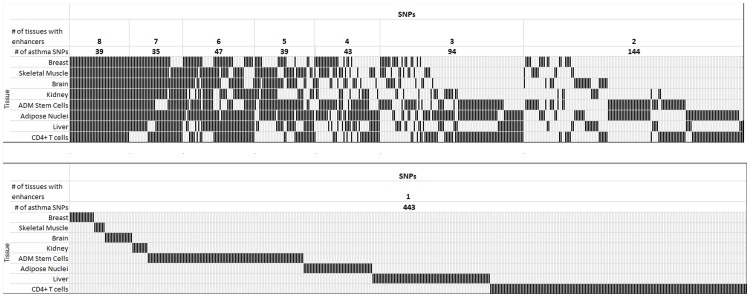
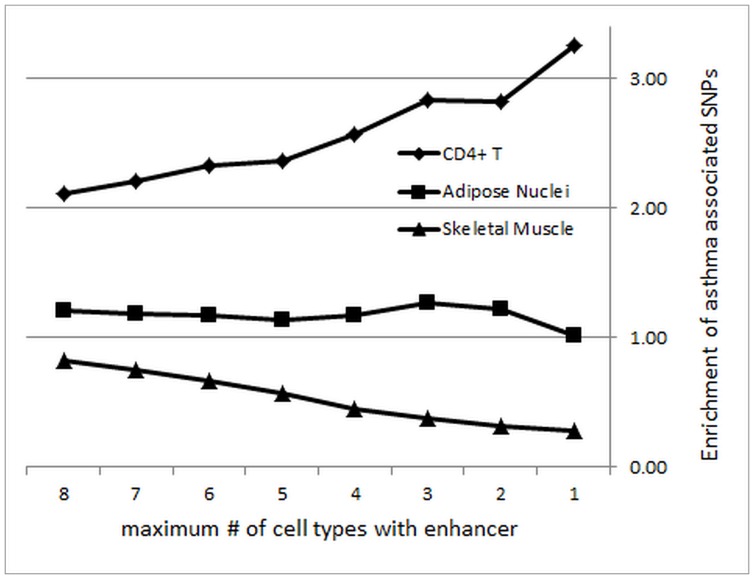
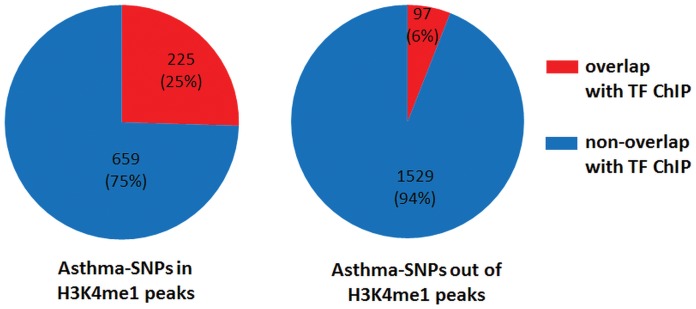
Genome-wide association studies (GWASs) identify single nucleotide polymorphisms (SNPs) that are enriched in individuals suffering from a given disease. Most disease-associated SNPs fall into non-coding regions, so that it is not straightforward to infer phenotype or function; moreover, many SNPs are in tight genetic linkage, so that a SNP identified as associated with a particular disease may not itself be causal, but rather signify the presence of a linked SNP that is functionally relevant to disease pathogenesis. Here, we present an analysis method that takes advantage of the recent rapid accumulation of epigenomics data to address these problems for some SNPs. Using asthma as a prototypic example; we show that non-coding disease-associated SNPs are enriched in genomic regions that function as regulators of transcription, such as enhancers and promoters. Identifying enhancers based on the presence of the histone modification marks such as H3K4me1 in different cell types, we show that the location of enhancers is highly cell-type specific. We use these findings to predict which SNPs are likely to be directly contributing to disease based on their presence in regulatory regions, and in which cell types their effect is expected to be detectable. Moreover, we can also predict which cell types contribute to a disease based on overlap of the disease-associated SNPs with the locations of enhancers present in a given cell type. Finally, we suggest that it will be possible to re-analyze GWAS studies with much higher power by limiting the SNPs considered to those in coding or regulatory regions of cell types relevant to a given disease.
Conflict of interest statement
Figures

Similar articles
-
On the identification of potential regulatory variants within genome wide association candidate SNP sets.BMC Med Genomics. 2014 Jun 11;7:34. doi: 10.1186/1755-8794-7-34. BMC Med Genomics. 2014. PMID: 24920305 Free PMC article.
-
Disease-Associated Single-Nucleotide Polymorphisms From Noncoding Regions in Juvenile Idiopathic Arthritis Are Located Within or Adjacent to Functional Genomic Elements of Human Neutrophils and CD4+ T Cells.Arthritis Rheumatol. 2015 Jul;67(7):1966-77. doi: 10.1002/art.39135. Arthritis Rheumatol. 2015. PMID: 25833190 Free PMC article.
-
Computational analysis of congenital heart disease associated SNPs: unveiling their impact on the gene regulatory system.BMC Genomics. 2025 Jan 21;26(1):55. doi: 10.1186/s12864-025-11232-6. BMC Genomics. 2025. PMID: 39838281 Free PMC article.
-
Making sense of GWAS: using epigenomics and genome engineering to understand the functional relevance of SNPs in non-coding regions of the human genome.Epigenetics Chromatin. 2015 Dec 30;8:57. doi: 10.1186/s13072-015-0050-4. eCollection 2015. Epigenetics Chromatin. 2015. PMID: 26719772 Free PMC article. Review.
-
Variation in the Untranslated Genome and Susceptibility to Infections.Front Immunol. 2018 Sep 7;9:2046. doi: 10.3389/fimmu.2018.02046. eCollection 2018. Front Immunol. 2018. PMID: 30245696 Free PMC article. Review.
Cited by
-
Multi-omics colocalization with genome-wide association studies reveals a context-specific genetic mechanism at a childhood onset asthma risk locus.Genome Med. 2021 Oct 10;13(1):157. doi: 10.1186/s13073-021-00967-y. Genome Med. 2021. PMID: 34629083 Free PMC article.
-
Comprehensive functional annotation of susceptibility variants associated with asthma.Hum Genet. 2020 Aug;139(8):1037-1053. doi: 10.1007/s00439-020-02151-5. Epub 2020 Apr 2. Hum Genet. 2020. PMID: 32240371 Free PMC article.
-
Histone modifications and their role in epigenetics of atopy and allergic diseases.Allergy Asthma Clin Immunol. 2018 May 23;14:39. doi: 10.1186/s13223-018-0259-4. eCollection 2018. Allergy Asthma Clin Immunol. 2018. PMID: 29796022 Free PMC article. Review.
-
Optimising the identification of causal variants across varying genetic architectures in crops.Plant Biotechnol J. 2019 May;17(5):893-905. doi: 10.1111/pbi.13023. Epub 2018 Nov 9. Plant Biotechnol J. 2019. PMID: 30320953 Free PMC article.
-
On the identification of potential regulatory variants within genome wide association candidate SNP sets.BMC Med Genomics. 2014 Jun 11;7:34. doi: 10.1186/1755-8794-7-34. BMC Med Genomics. 2014. PMID: 24920305 Free PMC article.
References
-
- Ege MJ, Strachan DP, Cookson WO, Moffatt MF, Gut I, et al... (2011) Gene-environment interaction for childhood asthma and exposure to farming in Central Europe. J Allergy Clin Immunol 127: 138–144, 144 e131–134. - PubMed
Publication types
MeSH terms
Grants and funding
LinkOut - more resources
Full Text Sources
Other Literature Sources
Medical
