. 2013;8(1):e54699.
doi: 10.1371/journal.pone.0054699. Epub 2013 Jan 31.

The 3D organization of the yeast genome correlates with co-expression and reflects functional relations between genes

Affiliations

The 3D organization of the yeast genome correlates with co-expression and reflects functional relations between genes

Dirar Homouz et al. PLoS One. 2013.

Abstract

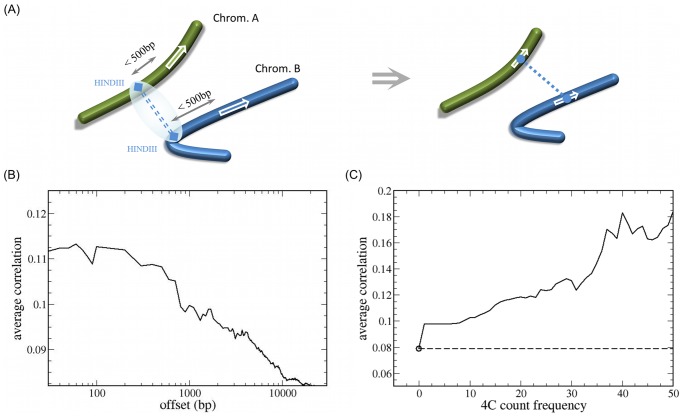
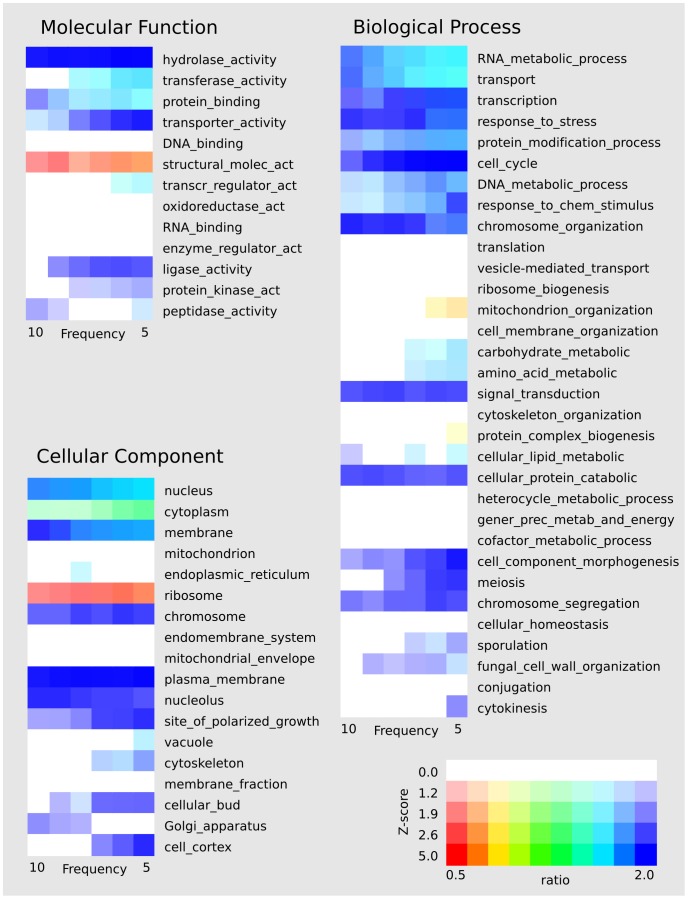
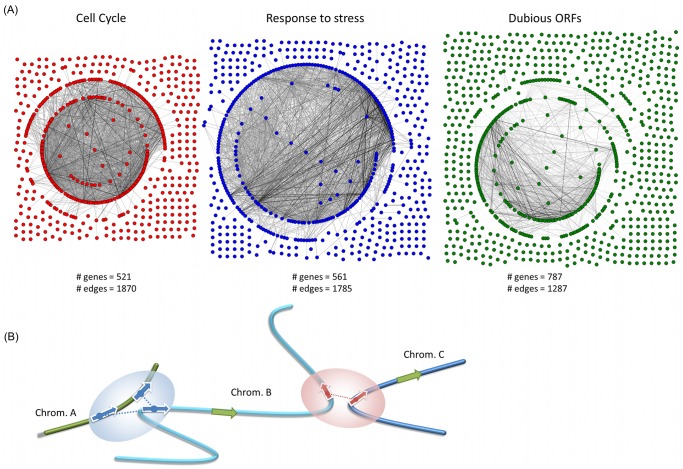
The spatial organization of eukaryotic genomes is thought to play an important role in regulating gene expression. The recent advances in experimental methods including chromatin capture techniques, as well as the large amounts of accumulated gene expression data allow studying the relationship between spatial organization of the genome and co-expression of protein-coding genes. To analyse this genome-wide relationship at a single gene resolution, we combined the interchromosomal DNA contacts in the yeast genome measured by Duan et al. with a comprehensive collection of 1,496 gene expression datasets. We find significant enhancement of co-expression among genes with contact links. The co-expression is most prominent when two gene loci fall within 1,000 base pairs from the observed contact. We also demonstrate an enrichment of inter-chromosomal links between functionally related genes, which suggests that the non random nature of the genome organization serves to facilitate coordinated transcription in groups of genes.


Conflict of interest statement

Competing Interests: The authors have declared that no competing interests exist.

Figures

Figure 1
Figure 1. Interactions between genomic loci and correlation of expression profiles.
(A) The interaction between gene loci is inferred from the existence of an experimental 4C link between two HINDIII sites on two different chromosomes within genomic separation of less than 500 base pairs from the genes. (B) The average correlation of genes as a function of the distance (offset) from an inter-chromosomal contact. The contacts are based on the HINDIII library of the experimental data. The correlations between the corresponding genes are calculated based on 1496 Affymetrix Yeast S98 microarray samples obtained from the GEO database. (C) The average correlation between linked genes depends on the experimental count frequency threshold (number of detected fragments) of the corresponding links. Frequency of zero corresponds to all possible pairs of genes (linked and unlinked) and the represents the genome wide average for all inter-chromosomal pairs of genes. The genome wide average is highlighted here by the circle and the horizontal dashed line for improving the visual comparison. The number of contacts is based on the HINDIII library.
Figure 2
Figure 2. The distribution of inter-chromosomal contacts within groups of genes by GO-slim terms.
The distribution is characterized by the ratio of the observed number of linked genes for each GO term to that of the number predicted from Monte Carlo simulation. The ratio is shown here by the hue of the color, where blue and purple correspond to high ratios (or enriched terms) and orange and red to low ratios (depleted terms). The significance of the ratio is represented here by the saturation of the colour as shown in the legend. The GO terms are divided into the three main domains and sorted according to their number of genes. The ratios are provided for all terms at different threshold count frequencies in the experimental link data with the two libraries combined.
Figure 3
Figure 3. The 4C contact networks in yeast.
A) The topology of 4C contact networks for three different groups of genes (“cell cycle” in red, “response to stress” in blue, and dubious ORFs in green). The contacts shown have a 4C frequency over than 5 and the shade of grey corresponds to the frequency of each contact. (B) A schematic diagram of the relation between inter-chromosomal contacts and regulation of genes from different functional groups. Genes with the same GO term (red or blue) tend to co-localize near the contacts while non-annotated and inactive genes (green) tend to avoid these links.

References

    1. Takizawa T, Gudla PR, Guo LY, Lockett S, Misteli T (2008) Allele-specific nuclear positioning of the monoallelically expressed astrocyte marker GFAP. Genes & Development 22: 489–498. - PMC - PubMed
    1. Fraser P, Bickmore W (2007) Nuclear organization of the genome and the potential for gene regulation. Nature 447: 413–417. - PubMed
    1. Lieberman-Aiden E, van Berkum NL, Williams L, Imakaev M, Ragoczy T, et al. (2009) Comprehensive Mapping of Long-Range Interactions Reveals Folding Principles of the Human Genome. Science 326: 289–293. - PMC - PubMed
    1. Babu MM, Janga SC, de Santiago I, Pombo A (2008) Eukaryotic gene regulation in three dimensions and its impact on genome evolution. Current Opinion in Genetics & Development 18: 571–582. - PubMed
    1. Misteli T (2004) Spatial positioning: A new dimension in genome function. Cell 119: 153–156. - PubMed

Publication types

LinkOut - more resources