. 2013;8(1):e54932.
doi: 10.1371/journal.pone.0054932. Epub 2013 Jan 28.

MicroRNA-195 inhibits the proliferation of human glioma cells by directly targeting cyclin D1 and cyclin E1

Affiliations

MicroRNA-195 inhibits the proliferation of human glioma cells by directly targeting cyclin D1 and cyclin E1

Wang Hui et al. PLoS One. 2013.

Abstract

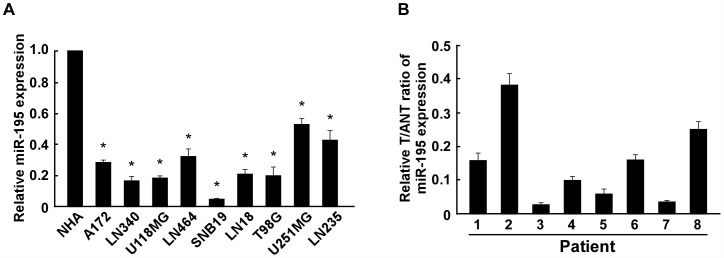
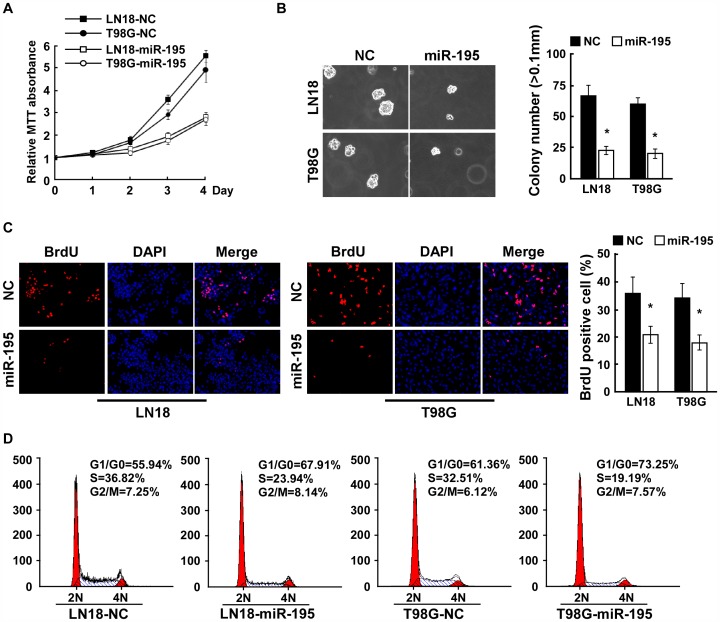
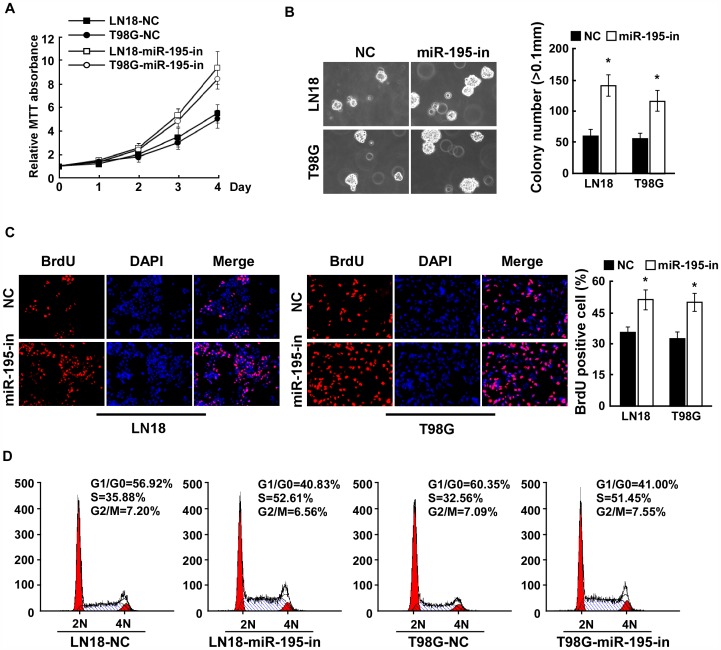
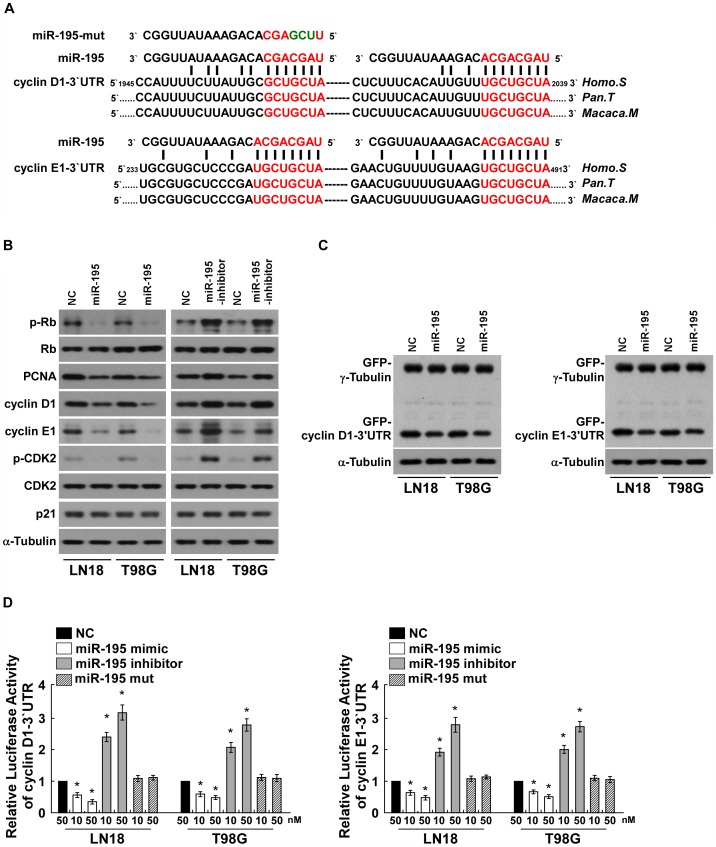
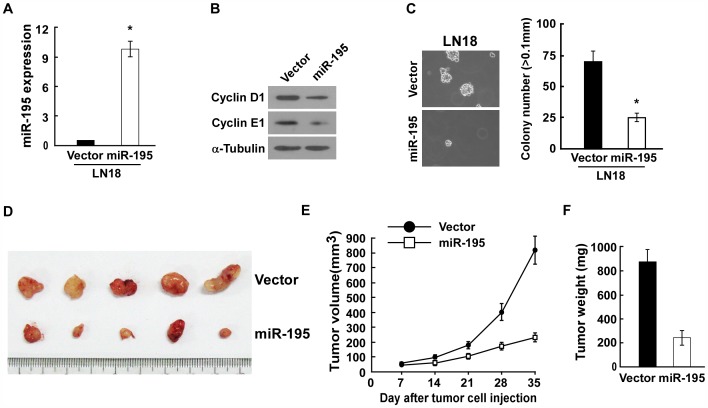
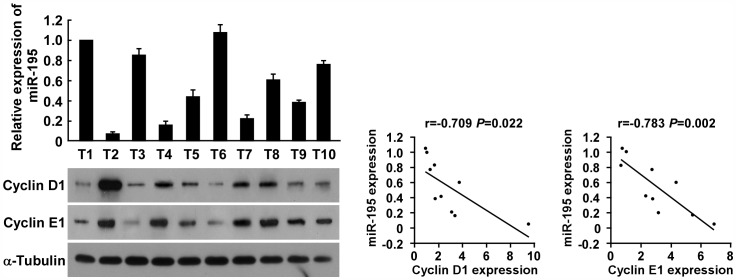
Glioma proliferation is a multistep process during which a sequence of genetic and epigenetic alterations randomly occur to affect the genes controlling cell proliferation, cell death and genetic stability. microRNAs are emerging as important epigenetic modulators of multiple target genes, leading to abnormal cellular signaling involving cellular proliferation in cancers.In the present study, we found that expression of miR-195 was markedly downregulated in glioma cell lines and human primary glioma tissues, compared to normal human astrocytes and matched non-tumor associated tissues. Upregulation of miR-195 dramatically reduced the proliferation of glioma cells. Flow cytometry analysis showed that ectopic expression of miR-195 significantly decreased the percentage of S phase cells and increased the percentage of G1/G0 phase cells. Overexpression of miR-195 dramatically reduced the anchorage-independent growth ability of glioma cells. Furthermore, overexpression of miR-195 downregulated the levels of phosphorylated retinoblastoma (pRb) and proliferating cell nuclear antigen (PCNA) in glioma cells. Conversely, inhibition of miR-195 promoted cell proliferation, increased the percentage of S phase cells, reduced the percentage of G1/G0 phase cells, enhanced anchorage-independent growth ability, upregulated the phosphorylation of pRb and PCNA in glioma cells. Moreover, we show that miR-195 inhibited glioma cell proliferation by downregulating expression of cyclin D1 and cyclin E1, via directly targeting the 3'-untranslated regions (3'-UTR) of cyclin D1 and cyclin E1 mRNA. Taken together, our results suggest that miR-195 plays an important role to inhibit the proliferation of glioma cells, and present a novel mechanism for direct miRNA-mediated suppression of cyclin D1 and cyclin E1 in glioma.


Conflict of interest statement

Competing Interests: The authors have declared that no competing interests exist.

Figures

Figure 1
Figure 1. Analysis of miR-195 expression in glioma cell lines and tissues. A
, Real-time PCR analysis of miR-195 expression in normal human astrocytes NHA and glioma cell lines, including A172, LN340, U118MG, LN464, SNB19, LN18, T98G, U251MG and LN235. The average miR-195 expression was normalized to U6 expression. B, The expression of miR-195 was examined in paired primary glioma tissues (T) and glioma adjacent nontumor tissues (ANT) from eight individual patients. The average miR-195 expression was normalized to U6 expression. Each bar represents the mean of three independent experiments. * P<0.05.
Figure 2
Figure 2. Upregulation of miR-195 suppresses the proliferation of glioma cells. A
, MTT assays revealed that upregulation of miR-195 reduced cell growth of LN18 and T98G glioma cell lines, compared to negative control (NC)-transfected cells. B, Upregulation of miR-195 reduced glioma cell tumorigenicity as determined by anchorage-independent growth assay. Representative micrographs (left) and quantification of colonies that were larger than 0.1 mm (right) were scored. C, Representative micrographs (left) and quantification of BrdU incorporating-cells after transfection with negative control (NC) or miR-195. D, Flow cytometric analysis of indicated glioma cells after transfection with Negative control (NC) or miR-195. Each bar represents the mean of three independent experiments. * P<0.05.
Figure 3
Figure 3. Inhibition of miR-195 promotes glioma cell proliferation. A
, MTT assays revealed that inhibition of miR-195 promoted cell growth of glioma cell lines of LN18 and T98G. B, Inhibition of miR-195 promoted the anchorage-independent growth of glioma cells. Representative micrographs (left) and quantification of colonies that were larger than 0.1 mm (right) were scored. C, Representative micrographs (left) and quantification of BrdU incorporating-cells after transfection with NC or miR-195 inhibitor. D, Flow cytometric analysis of indicated glioma cells after transfection with NC or miR-195 inhibitor. Each bar represents the mean of three independent experiments. * P<0.05.
Figure 4
Figure 4. miR-195 downregulates cyclin D1 and cyclin E1 by directly targeting their 3
-UTRs. A, Predicted miR-195 target sequence in the 3′-UTR of cyclin D1 and cyclin E1 (cyclin D1 3′-UTR and cyclin E1 3′-UTR) and illustration of the three altered nucleotides in miR-195-mut. B, Western blotting analysis of expression of phosphorylated Rb (p-Rb), total Rb, PCNA, cyclin D1, cyclin E1, CDK2 and p21 in indicated cells. α-Tubulin served as the loading control. C, Western blotting analysis of GFP expression in indicated cells. D, Luciferase assay of indicated cells transfected with the pGL3-cyclin D1-3′UTR reporter (left) or the pGL3-cyclin E1-3′UTR reporter (right) with increasing amounts (10, 50 nM) of miR-195 mimic, or miR-195 inhibitor, or miR-195 mutant. Each bar represents the mean ± SD of three independent experiments. * P<0.05.
Figure 5
Figure 5. miR-195 inhibits glioma proliferation in vivo. A.
Real-time PCR analysis of miR-195 expression in LN18-Vector and LN18-miR-195 stable cell lines. B. Western blotting analysis of Cyclin D1 and Cyclin E1 expression in vector- or miR-195-transduced cells. C. Representative micrographs (left panel) and quantification (right panel) of colonies determined by anchorage-independent growth assays. D–F. Xenograft model in nude mice. Indicated cells were injected into the dorsal flank of the mice. (D), Images of the tumors from all mice. (E), Tumor volumes were measured on the indicated days. (F), Mean tumor weights.
Figure 6
Figure 6. miR-195 expression inversely correlates with Cyclin D1 and Cyclin E1 expression in glioma tissues.
Analysis (left) and correlation (right) between miR-195 expression and Cyclin D1 and Cyclin E1 expression levels in 10 freshly collected human glioma samples. Each bar represents the mean ± SD of three independent experiments.

Similar articles

Cited by

References

    1. Oliver Gautschi, Daniel Ratschiller, Mathias Gugger (2007) Cyclin D1 in non-small cell lung cancer: A key driver of malignant transformation. Lung Cancer 55: 1–14. - PubMed
    1. D Resnitzky, M Gossen, H Bujard, S I Reed (1994) Acceleration of the G1/S phase transition by expression of cyclins D1 and E with an inducible system.Mol Cell Biol. 14: 1669–1679. - PMC - PubMed
    1. Lew DJ, Dulić V, Reed SI (1991) Isolation of three novel human cyclins by rescue of G1 cyclin (Cln) function in yeast. Cell 66: 1197–1206. - PubMed
    1. Matsushime H, Roussel MF, Ashmun RA, Sherr CJ (1991) Colony-stimulating factor 1 regulates novel cyclins during the G1 phase of the cell cycle. Cell 65: 701–713. - PubMed
    1. Motokura T, Bloom T, Kim HG, Jüppner H, Ruderman JV, et al. (1991) A novel cyclin encoded by a bcl1-linked candidate oncogene. Nature 350: 512–515. - PubMed

Publication types

MeSH terms