. 2013;8(1):e55497.
doi: 10.1371/journal.pone.0055497. Epub 2013 Jan 31.

Trypanosoma cruzi response to sterol biosynthesis inhibitors: morphophysiological alterations leading to cell death

Affiliations

Trypanosoma cruzi response to sterol biosynthesis inhibitors: morphophysiological alterations leading to cell death

Rafael Luis Kessler et al. PLoS One. 2013.

Abstract

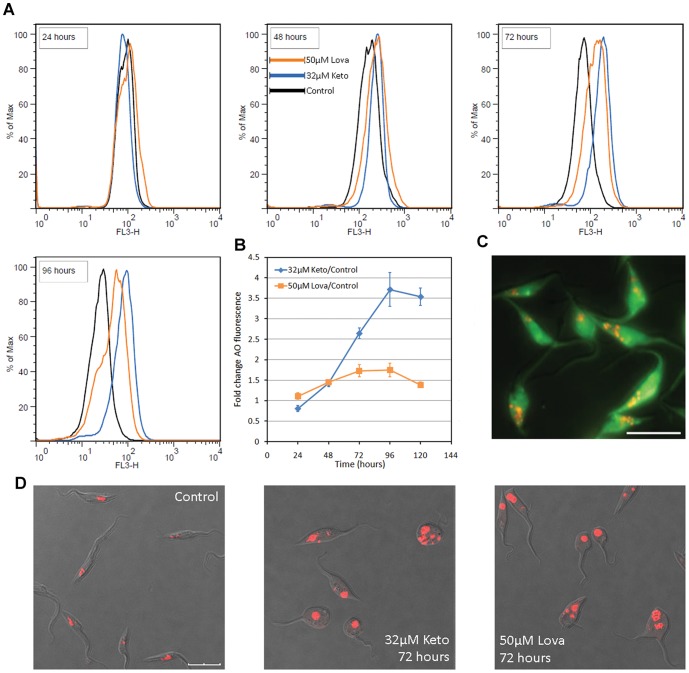
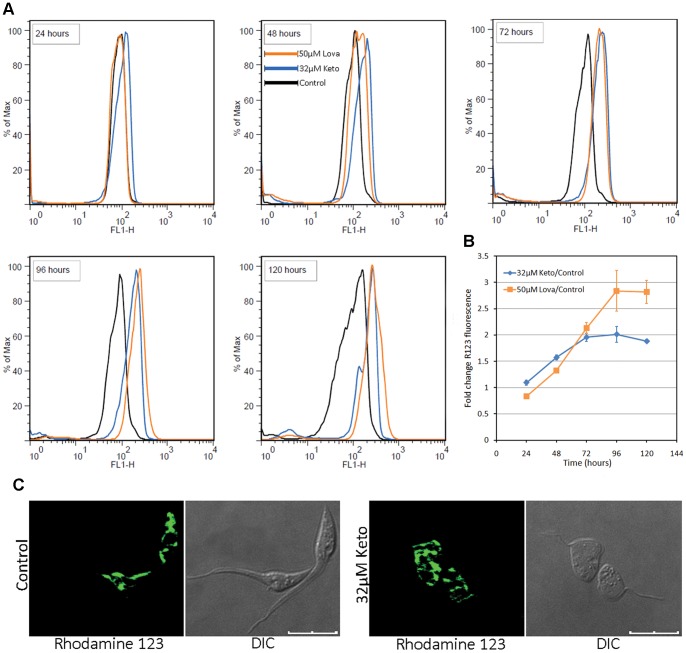
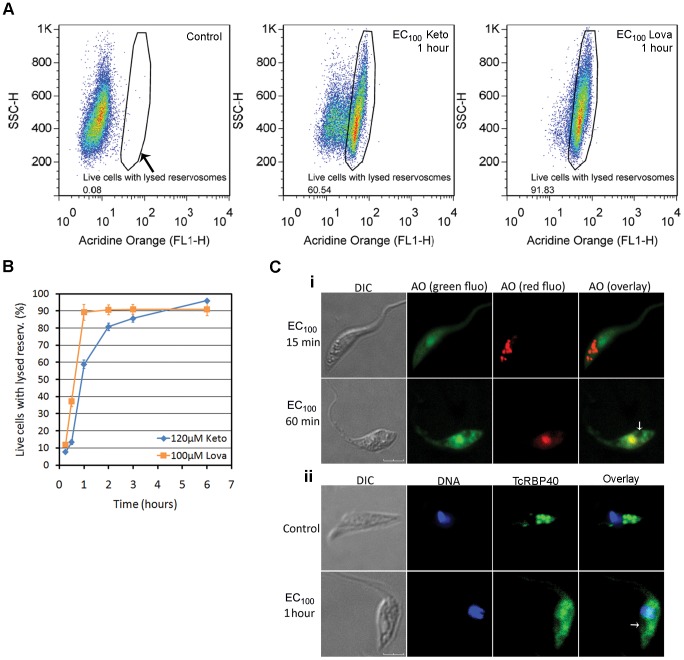
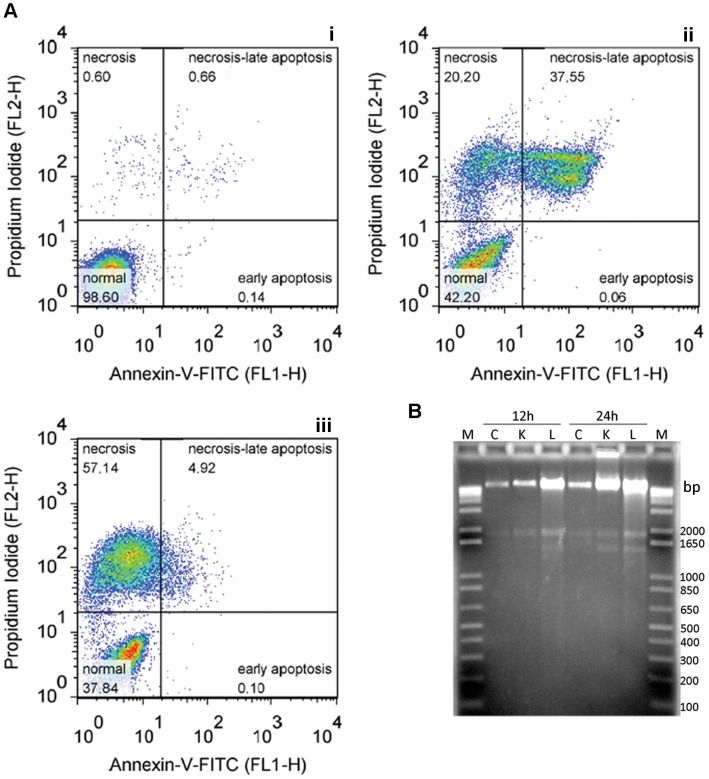
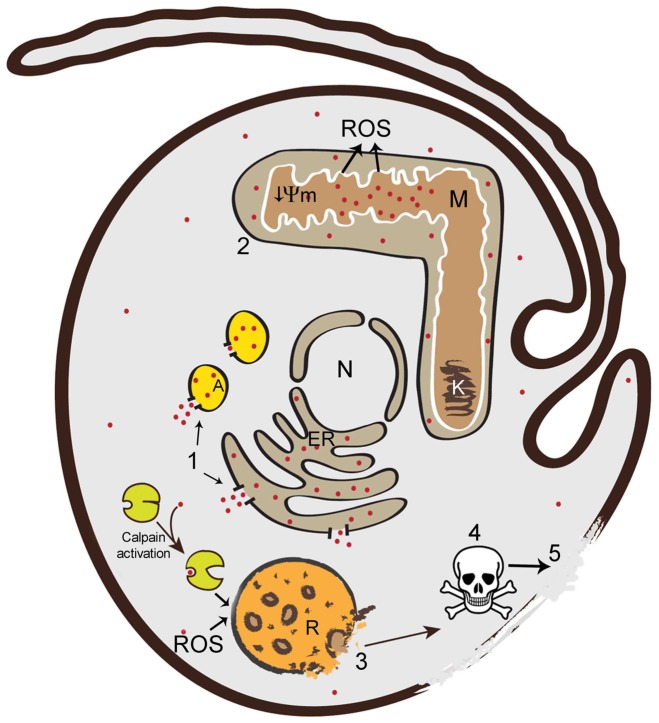
The protozoan parasite Trypanosoma cruzi displays similarities to fungi in terms of its sterol lipid biosynthesis, as ergosterol and other 24-alkylated sterols are its principal endogenous sterols. The sterol pathway is thus a potential drug target for the treatment of Chagas disease. We describe here a comparative study of the growth inhibition, ultrastructural and physiological changes leading to the death of T. cruzi cells following treatment with the sterol biosynthesis inhibitors (SBIs) ketoconazole and lovastatin. We first calculated the drug concentration inhibiting epimastigote growth by 50% (EC(50)/72 h) or killing all cells within 24 hours (EC(100)/24 h). Incubation with inhibitors at the EC(50)/72 h resulted in interesting morphological changes: intense proliferation of the inner mitochondrial membrane, which was corroborated by flow cytometry and confocal microscopy of the parasites stained with rhodamine 123, and strong swelling of the reservosomes, which was confirmed by acridine orange staining. These changes to the mitochondria and reservosomes may reflect the involvement of these organelles in ergosterol biosynthesis or the progressive autophagic process culminating in cell lysis after 6 to 7 days of treatment with SBIs at the EC(50)/72 h. By contrast, treatment with SBIs at the EC(100)/24 h resulted in rapid cell death with a necrotic phenotype: time-dependent cytosolic calcium overload, mitochondrial depolarization and reservosome membrane permeabilization (RMP), culminating in cell lysis after a few hours of drug exposure. We provide the first demonstration that RMP constitutes the "point of no return" in the cell death cascade, and propose a model for the necrotic cell death of T. cruzi. Thus, SBIs trigger cell death by different mechanisms, depending on the dose used, in T. cruzi. These findings shed new light on ergosterol biosynthesis and the mechanisms of programmed cell death in this ancient protozoan parasite.


Conflict of interest statement

Competing Interests: The authors have declared that no competing interests exist.

Figures

Figure 1
Figure 1. Antiproliferative and trypanocidal effects of SBIs in T. cruzi.
(A and B) Growth curves of cultured epimastigotes exposed to various concentrations of lovastatin (A) or ketoconazole (B). The dose-response curve and respective EC50/72 h values are shown in the box. (C and D) Recovery experiments: epimastigote cultures were exposed to 100 µM lovastatin (C) or 120 µM ketoconazole (D). The drug was then removed by successive washes, after short periods of time (specified in the graph). The subsequent growth of the parasites was followed for three days, by counting, in a Neubauer chamber. (E) Percentage of dead cells (spheroid) as a function of time exposed to 120 µM ketoconazole or 100 µM lovastatin. (F) Stained smears of parasites exposed to SBIs at the EC100/24 h for 12 hours, showing the spheroid shape of the cells; the scale bars indicate 10 µm. For all graphs, each experimental point corresponds to the mean and standard deviation for cell density obtained by direct counting in a Neubauer chamber.
Figure 2
Figure 2. TEM of T. cruzi epimastigotes treated with SBIs at the EC50/72 h.
(A) Control epimastigotes, providing a general view of parasite ultrastructure, indicating the nucleus (N), kinetoplast (K), mitochondria (M), flagellum (F) and reservosome (R). (B to E) Exposure to 50 µM lovastatin for 72 hours (B) or 120 hours (C to E). (F to H) Exposure to 32 µM ketoconazole for 72 hours (F) or 120 hours (G and H). For all images, the white asterisks (*) indicate the swollen reservosomes and the black arrows (→) indicate aberrant mitochondrial branching. The abnormal mitochondrial pattern is highlighted in (C) (in box). A myelin figure, typical of autophagic cells, is highlighted in (E). A: Autophagosome. Bars: (A), 2 µm; (B), (F), (G), 1 µm; (C), 0.5 µm; (D), (E), (H), 0.2 µm.
Figure 3
Figure 3. Swelling of the reservosomes in response to SBIs at the EC50/72 h, as shown by AO fluorescence.
(A) Overlay flow cytometry histograms of SBI-treated cultures, for exposure times of 24 to 96 hours (in box). A gradual increase in red wavelength fluorescence (FL3-H) is observed in treated parasites. Histograms representative of triplicate experiments are shown. (B) Fold-change of the geometric mean of AO fluorescence intensity with respect to control cells in triplicate flow cytometry experiments. (C) Fluorescence microscopy of a control culture, showing acidic vesicles (reservosomes) stained in red with AO; the scale bar indicates 10 µm. (D) Confocal microscopy of live parasites, showing the increase in size of the acidic vesicles in the posterior region of treated cells. Overlay images of DIC and red fluorescence channels are shown and the scale bars indicate 10 µm.
Figure 4
Figure 4. Mitochondrial branching in response to SBIs at the EC50/72 h, as detected by R123 fluorescence.
(A) Overlay histograms of flow cytometry experiments on SBI-treated cultures, for exposure times of 24 to 120 hours (in box). A gradual increase in green wavelength fluorescence (FL1-H) can be seed for the treated parasites. Histograms representative of triplicate experiments are shown. (B) Fold-change in the geometric mean of R123 fluorescence intensity (FL1-H) with respect to control cells in triplicate flow cytometry experiments. (C) Confocal microscopy of live parasites, showing the branching of the mitochondrial membranes in treated parasites (72 hours); the results for lovastatin were similar to those for ketoconazole and are therefore not shown here; the scale bars indicate 10 µm.
Figure 5
Figure 5. TEM and flow cytometry assays after treatment with SBIs at the EC100/24 h.
(A) TEM images after 18 hours of exposure to SBIs at the EC100/24 h, showing marked cell degradation, with kinetoplast disruption (* in (i)) and cell lysis (ii); the occurrence of reservosome lysis is highlighted in (iii) and (iv). These morphological patterns are similar to those observed during cell death by necrosis. TEM results were similar for the two SBIs and the drug name is not shown. Scale bars: (i) and (ii), 1 µm; (iii) and (iv), 0.5 µm. (B) Flow cytometry analysis of T. cruzi necrotic death in reponse to SBIs at the EC100/24 h. (i) Analysis of relative intracellular calcium concentrations by fluo-4-AM staining, after 0.5 to 12 hours. A rapid increase in fluo-4-AM fluorescence with respect to control cells can be seen after exposure to the two SBIs at the EC100/24 h. (ii) Assay of mitochondrial membrane depolarization by R123 staining; time-dependent mitochondrial depolarization can clearly be seen by comparison with control cells. (iii) Cell viability analysis based on propidium iodide staining; the percentage dead cells (PI-positive) is plotted as a function of drug exposure time. Note the differences in cell lysis kinetics for the two drugs: the experimental points were optimally adjusted by a sigmoidal curve for lovastatin and by a negative exponential curve for ketoconazole. The raw flow cytometry plots can be seen in Figure S4.
Figure 6
Figure 6. Reservosome membrane permeabilization (RMP) in response to treatment with SBIs at the EC100/24 h.
(A) Example of RMP analysis by flow cytometry with AO, showing that treated cells with lysed reservosomes have a high FL1-H signal intensity. The values inside the boxes indicate the percentage of cells with lysed reservosomes. (B) Kinetics of RMP obtained by flow cytometry; each experimental point indicates the mean and standard deviation of triplicate experiments. (C) Visualization of reservosome lysis by confocal microscopy; (i) Live cells stained with AO; green (“green fluo”) and red (“red fluo”) AO fluorescence was photographed in different frames. The normal pattern of reservosome staining persists after 15 minutes of drug exposure (upper row), but, within 1 hour, all the acidic vesicles disappear (bottom row). (ii) Immunofluorescence analysis with an antibody directed against a reservosomal protein (TcRBP40); in control cells, this protein is found mostly in the reservosomes (upper row). However, after 1 hour of drug treatment, a diffuse signal is observed throughout the parasite body (bottom row). In (i) and (ii), the white arrows indicate low-fluorescence regions possibly corresponding to sites previously occupied by intact reservosomes. For both confocal experiments, similar results were obtained for ketoconazole and lovastatin and the drug used is therefore not indicated. The scale bars indicate 4 µm (i) and 3 µm (ii).
Figure 7
Figure 7. Absence of apoptotic markers in the EC100/24 h response.
(A) Analysis of phosphatidylserine exposure by co-staining with Annexin-V-FITC and PI. As an example, we have plotted data for exposure for 12 hours to ketoconazole (ii) or lovastatin (iii), together with the control cell pattern (i). (B) DNA laddering assay; total DNA was isolated from control cultures (C) and from drug-treated cells (120 µM ketoconazole (K), 100 µM lovastatin (L)), after 12 or 24 hours of exposure (indicated at the top), as described in the methods section. We subjected 5 µg of the DNA to electrophoresis in a 1.5% agarose gel stained with ethidium bromide; M lanes contain the 1 kb Plus DNA ladder.
Figure 8
Figure 8. Model of T. cruzi necrotic cell death.
The cellular events during the necrotic death of epimastigotes were reconstructed from the results of this and published studies. The events occur in the following order: 1: cytoplasmic calcium overload from acidocalcisomes and/or the ER (red dots represent Ca2+); 2: accumulation of Ca2+ in the mitochondria, leading to inner membrane depolarization (↓Ψm) and ROS (reactive oxygen species) production; 3: RMP, due to the action of ROS and/or Ca2+- activated calpains, potentially corresponding to the point of no return in the necrotic pathway; 4: extensive cell degradation by proteases released from the reservosomes; 5: cell lysis. N: nucleus, ER: endoplasmic reticulum, M: mitochondria, K: kinetoplast, R: reservosome; A: acidocalcisome.

References

    1. Rassi A Jr, Rassi A, Marin-Neto JA (2010) Chagas disease. Lancet 375: 1388–1402. - PubMed
    1. Coura JR, Dias JC (2009) Epidemiology, control and surveillance of Chagas disease: 100 years after its discovery. Mem Inst Oswaldo Cruz 104 Suppl 1: 31–40. - PubMed
    1. Wilkinson SR, Kelly JM (2009) Trypanocidal drugs: mechanisms, resistance and new targets. Expert Rev Mol Med 11: e31. - PubMed
    1. Camargo EP (2009) Perspectives of vaccination in Chagas disease revisited. Mem Inst Oswaldo Cruz 104 Suppl 1: 275–280. - PubMed
    1. Dumonteil E (2009) Vaccine development against Trypanosoma cruzi and Leishmania species in the post-genomic era. Infect Genet Evol 9: 1075–1082. - PubMed

Publication types

MeSH terms

LinkOut - more resources