

Quantitative analysis of pancreatic polypeptide cell distribution in the human pancreas
- PMID: 23383206
- PMCID: PMC3561199
- DOI: 10.1371/journal.pone.0055501
Quantitative analysis of pancreatic polypeptide cell distribution in the human pancreas
Abstract
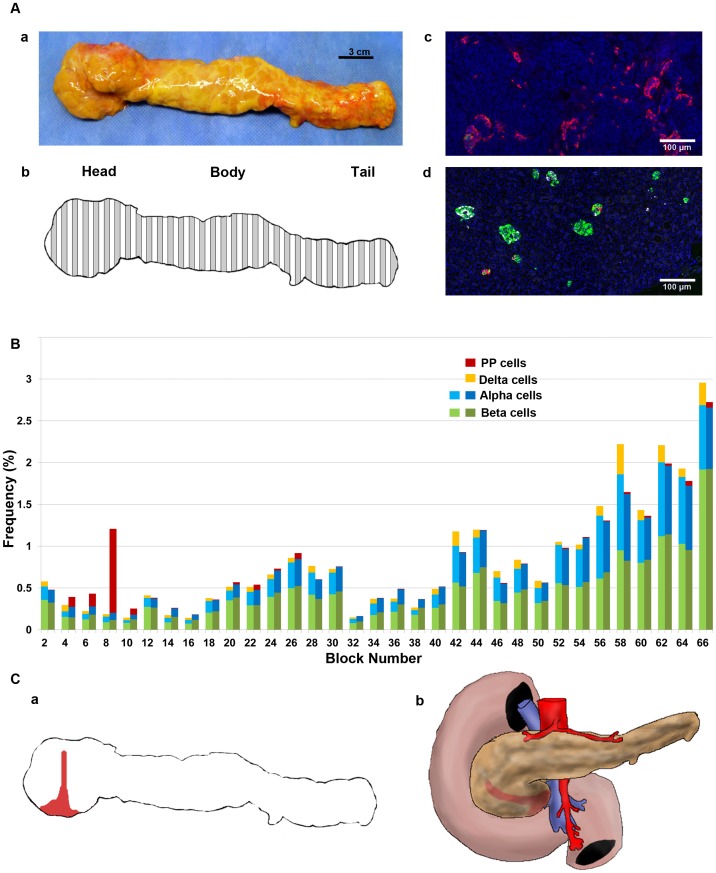
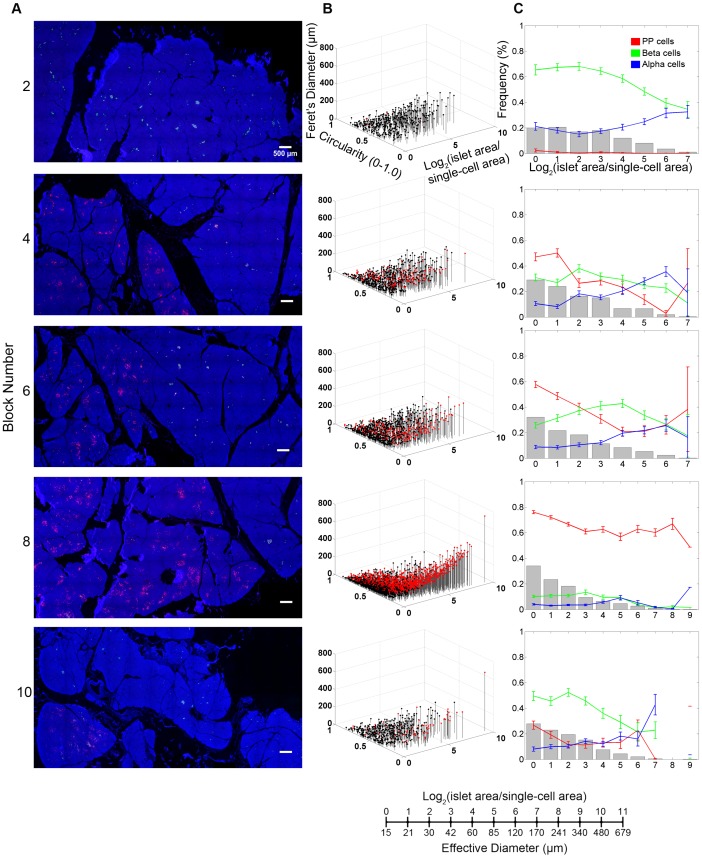
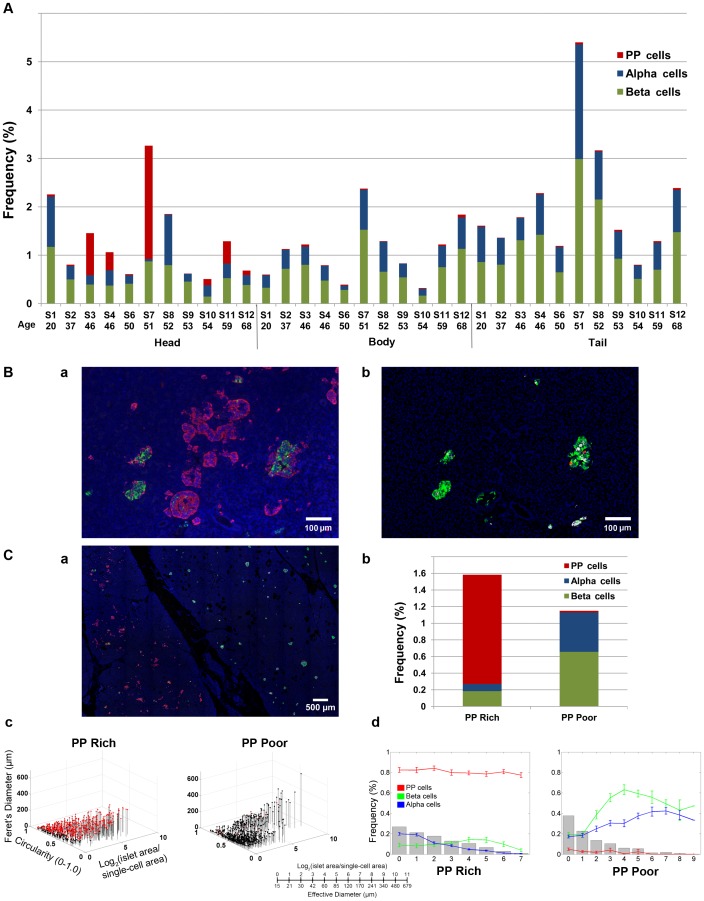
The pancreatic islet is mainly composed of beta-, alpha- and delta-cells with small numbers of pancreatic polypeptide (PP) and epsilon cells. It is known that there is a region in the head of the pancreas that is rich in PP-cells. In the present study, we examined the distribution of PP-cells, and assessed the influence of the PP-cell rich region to quantify the total islet mass. Pancreatic tissues were collected from donors with no history of diabetes or pancreatic diseases (n = 12). A stereological approach with a computer-assisted large-scale analysis of whole pancreatic sections was applied to quantify the entire distribution of endocrine cells within a given section. The initial whole pancreas analysis showed that a PP-cell rich region was largely restricted to the uncinate process with a clear boundary. The distinct distribution of PP-cells includes irregularly shaped clusters composed solely of PP-cells. Furthermore, in the PP-cell rich region, beta- and alpha-cell mass is significantly reduced compared to surrounding PP-cell poor regions. The results suggest that the analysis of the head region should distinguish the PP-cell rich region, which is best examined separately. This study presents an important implication for the regional selection and interpretation of the results.
Conflict of interest statement
Figures
Comment in
-
Distinct function of the head region of human pancreas in the pathogenesis of diabetes.Islets. 2013 Sep-Dec;5(5):226-8. doi: 10.4161/isl.26432. Epub 2013 Sep 17. Islets. 2013. PMID: 24045229 Free PMC article.
References
-
- Greenberg GR, McCloy RF, Adrian TE, Chadwick VS, Baron JH, et al. (1978) Inhibition of pancreas and gallbladder by pancreatic polypeptide. Lancet 2: 1280–1282. - PubMed
-
- Lin TM, Evans DC, Chance RE, Spray GF (1977) Bovine pancreatic peptide: action on gastric and pancreatic secretion in dogs. Am J Physiol 232: E311–E315. - PubMed
-
- Adrian TE, Mitchenere P, Sagor G, Bloom SR (1982) Effect of pancreatic polypeptide on gallbladder pressure and hepatic bile secretion. Am J Physiol 243: G204–G207. - PubMed
-
- Hazelwood RL (1993) The pancreatic polypeptide (PP-fold) family: gastrointestinal, vascular, and feeding behavioral implications. Proc Soc Exp Biol Med 202: 44–63. - PubMed
-
- Asakawa A, Inui A, Yuzuriha H, Ueno N, Katsuura G, et al. (2003) Characterization of the effects of pancreatic polypeptide in the regulation of energy balance. Gastroenterology 124: 1325–1336. - PubMed
Publication types
MeSH terms
Grants and funding
LinkOut - more resources
Full Text Sources
Other Literature Sources
Medical
Miscellaneous
