. 2013;8(1):e55788.
doi: 10.1371/journal.pone.0055788. Epub 2013 Jan 31.

Reduced interleukin-4 receptor α expression on CD8+ T cells correlates with higher quality anti-viral immunity

Affiliations

Reduced interleukin-4 receptor α expression on CD8+ T cells correlates with higher quality anti-viral immunity

Danushka K Wijesundara et al. PLoS One. 2013.

Abstract

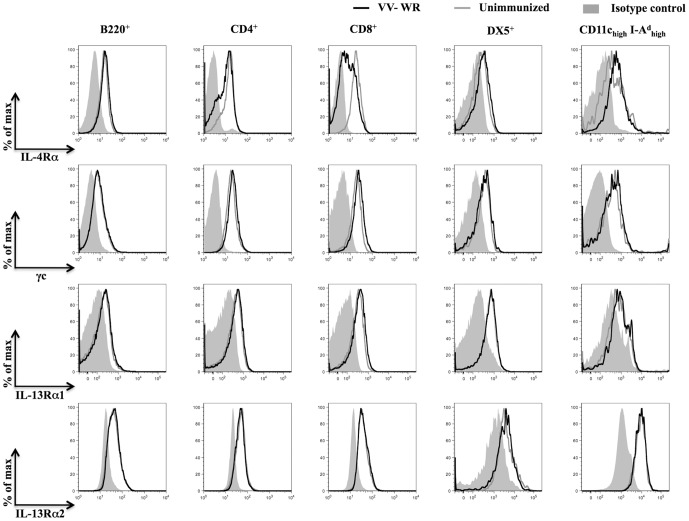
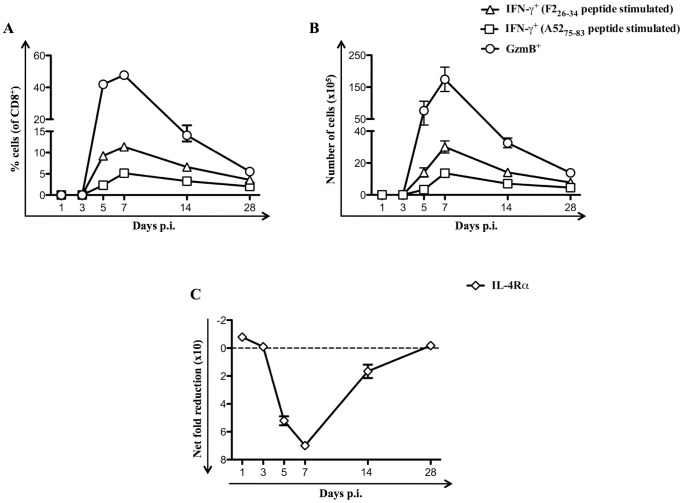
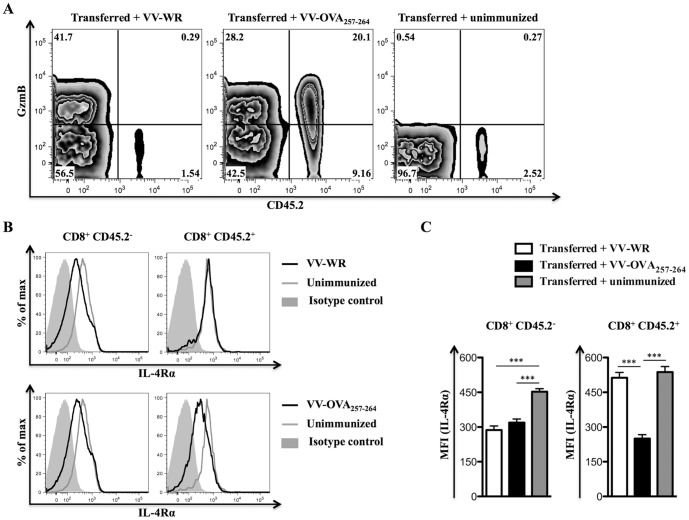
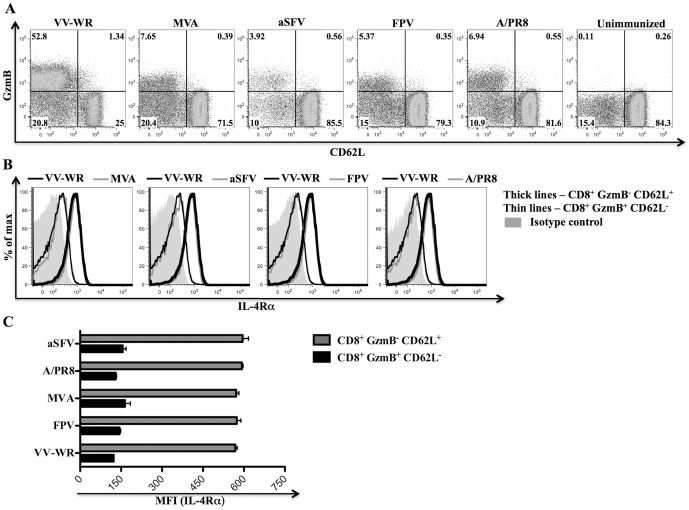
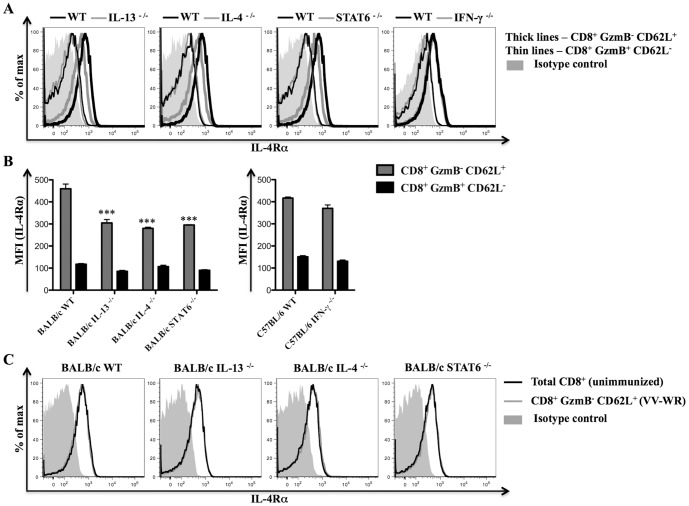
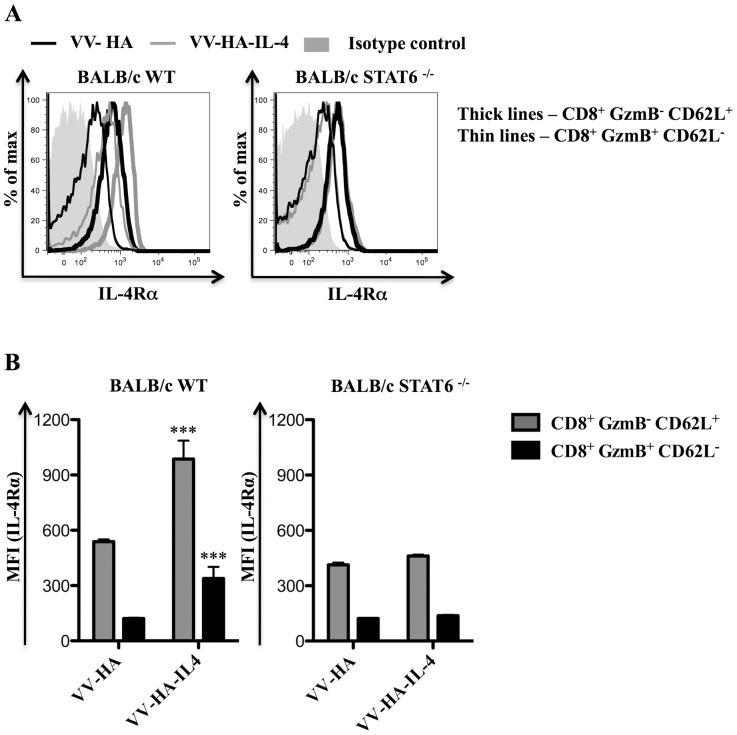
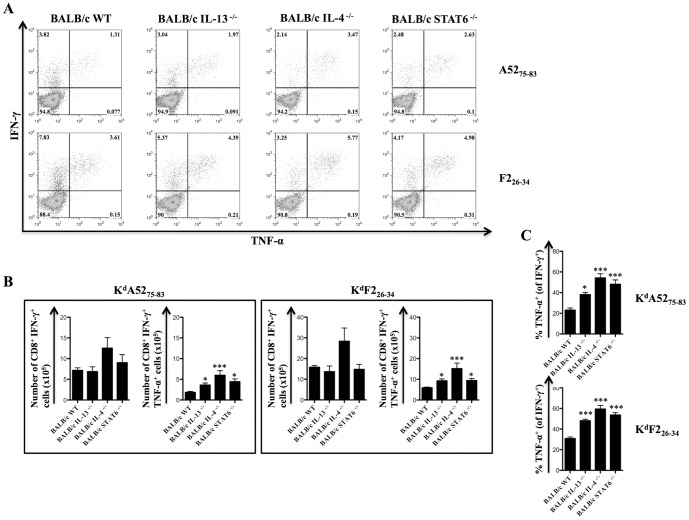
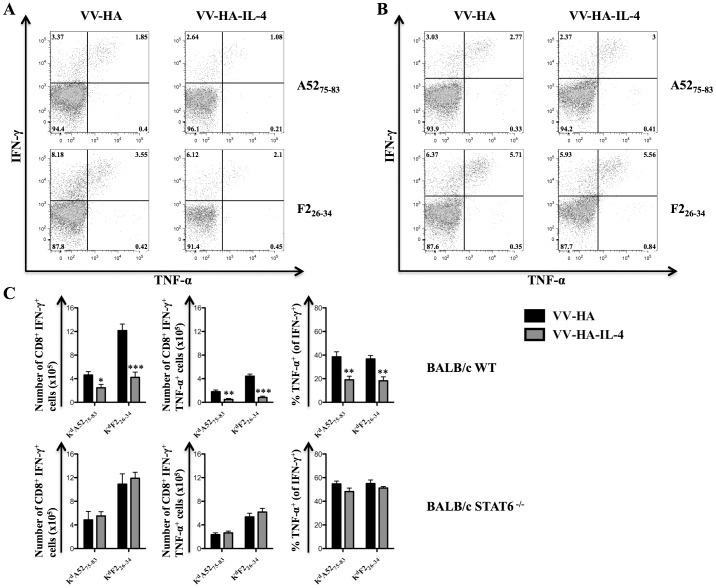
With the hope of understanding how interleukin (IL)-4 and IL-13 modulated quality of anti-viral CD8(+) T cells, we evaluated the expression of receptors for these cytokines following a range of viral infections (e.g. pox viruses and influenza virus). Results clearly indicated that unlike other IL-4/IL-13 receptor subunits, IL-4 receptor α (IL-4Rα) was significantly down-regulated on anti-viral CD8(+) T cells in a cognate antigen dependent manner. The infection of gene knockout mice and wild-type (WT) mice with vaccinia virus (VV) or VV expressing IL-4 confirmed that IL-4, IL-13 and signal transducer and activator of transcription 6 (STAT6) were required to increase IL-4Rα expression on CD8(+) T cells, but not interferon (IFN)-γ. STAT6 dependent elevation of IL-4Rα expression on CD8(+) T cells was a feature of poor quality anti-viral CD8(+) T cell immunity as measured by the production of IFN-γ and tumor necrosis factor α (TNF-α) in response to VV antigen stimulation in vitro. We propose that down-regulation of IL-4Rα, but not the other IL-4/IL-13 receptor subunits, is a mechanism by which CD8(+) T cells reduce responsiveness to IL-4 and IL-13. This can improve the quality of anti-viral CD8(+) T cell immunity. Our findings have important implications in understanding anti-viral CD8(+) T cell immunity and designing effective vaccines against chronic viral infections.


Conflict of interest statement

Competing Interests: The authors have declared that no competing interests exist.

Figures

Figure 1
Figure 1. Distribution of IL-4Rα, γc, IL-13Rα1 and IL-13Rα2 on immune cells following VV infection.
BALB/c WT mice (n = 12) infected for 7 days with VV-WR or unimmunized were sacrificed and splenocytes harvested for analysis using flow cytometry. The histogram plots show cell surface expression of IL-4Rα, γc, IL-13Rα1 and intracellular expression of IL-13Rα2 on gated B220+, CD4+, CD8+, DX5+, and CD11chigh I-Ad high splenocytes from a representative VV-WR infected mouse (black lines) and an unimmunized mouse (grey lines). The plots are representative of at least 12 mice tested in at least three independent experiments.
Figure 2
Figure 2. Reduction in IL-4Rα expression correlates with magnitude of anti-viral effector responses on CD8+ T cells.
Unimmunized or VV-WR infected BALB/c WT mice (n = 4 per group) were sacrificed at the indicated time points and splenocytes used for flow cytometry analysis or for ICS following A5275–83 or F226–34 in vitro peptide stimulation of splenocytes as described in the materials and methods. A and B, The mean (n = 4) percentage of CD8+ splenocytes (A) and the total number of CD8+ splenocytes (B) from VV-WR infected mice that expressed GzmB or IFN-γ following in vitro peptide stimulation. C, The kinetics of the mean (n = 4) net fold reduction in cell surface expression of IL-4Rα on gated CD8+ splenocytes from VV-WR infected mice relative to unimmunized mice. Net fold reduction was calculated using MFI values as described in the materials and methods. The data shown are representative of at least two independent experiments and the error bars depict the SEM.
Figure 3
Figure 3. Cell surface down-regulation of IL-4Rα specifically occurs on activated CD8+ T cells.
Naïve C57BL/6.SJL (CD45.1+; CD45.2) mice (n = 6 group) that received 10×106 C57BL/6 OT-I splenocytes (CD45.2+) i.v. were kept unimmunized or infected i.p. with 5×10⁶ PFU of VV-WR or VV-OVA257–264 for 7 days prior to sacrifice and flow cytometry analysis. A, Representative contour plots showing cell surface CD45.2 and intracellular GzmB expression on gated CD8+ splenocytes from a recipient mouse of the indicated group. B, Representative histogram plots showing cell surface IL-4Rα expression on gated CD8+ CD45.2 (left column of plots) or CD8+ CD45.2+ (right column of plots) splenocytes from a recipient mouse kept unimmunized, infected with VV-WR or VV-OVA257–264. C, Mean (n = 6) MFI representing cell surface IL-4Rα expression on gated CD8+ CD45.2 or CD8+ CD45.2+ splenocytes from recipient mice of the indicated group. One-way ANOVA (Tukey's Multiple Comparison) was used for testing significance of the data (*** - p<0.001). Similar results have been obtained in three independent experiments and the error bars depict the SEM.
Figure 4
Figure 4. Down-regulation of IL-4Rα is a general feature of activated CD8+ T cells following virus infection.
BALB/c WT mice (n = 5) were infected i.p. with 3×10⁶ PFU of the indicated viruses or kept unimmunized for 7 days prior to sacrifice and flow cytometry analysis. A, Dot plots showing cell surface CD62L expression and intracellular GzmB expression on gated CD8+ splenocytes from a representative mouse of the indicated group. B, Representative histogram plots showing cell surface IL-4Rα expression on the indicated CD8+ splenocyte subset from a representative mouse infected with the indicated virus. C, Mean (n = 5) MFI representing cell surface IL-4Rα expression on the indicated splenocyte subset from mice infected with the indicated viruses. Similar results have been obtained in three independent experiments and the error bars shown depict the SEM.
Figure 5
Figure 5. IL-4, IL-13 and STAT6 regulate IL-4Rα expression on CD8+ T cells following VV-WR infection.
Gene knockout mice (n = 5) and respective littermate WT control mice (n = 5) were infected with VV-WR for 7 days or kept unimmunized prior to sacrifice and analysis using flow cytometry. A, Representative histogram plots showing cell surface IL-4Rα expression on the indicated CD8+ splenocyte subset from a gene knockout mouse or a littermate WT control mouse. B, Mean (n = 5) MFI representing cell surface IL-4Rα expression on the indicated CD8+ splenocyte subset from mice of the indicated genetic background infected with VV-WR. C, Representative histogram plots showing cell surface IL-4Rα expression on the indicated CD8+ splenocyte subset from an unimmunized mouse or VV-WR infected mouse belonging to the indicated genetic background. All the results shown are representative of at least two independent experiments. Error bars when shown depict the SEM and one-way ANOVA (Tukey's Multiple Comparison) was used to determine the statistical significance of the data relative to WT control mice (*** - p<0.001).
Figure 6
Figure 6. IL-4Rα is up-regulated on CD8+ T cells in a STAT6 dependent manner following VV-HA-IL-4 infection.
BALB/c WT mice (n = 5) or BALB/c STAT6 −/− mice (n = 5) were infected with 5×10⁶ PFU of VV-HA control, VV-HA-IL-4 or kept unimmunized for 7 days prior to sacrifice and analysis using flow cytometry. A and B, Representative histogram plots showing cell surface IL-4Rα expression (A) and the mean (n = 5) MFI of cell surface IL-4Rα expression (B) on the indicated CD8+ splenocyte subset from infected mice of the indicated genetic background. The data shown is representative of two independent experiments and the error bars depict the SEM. One-way ANOVA (Tukey's Multiple Comparison) was used to determine the statistical significance of the data relative to respective cell subset from VV-HA infected mice (*** - p<0.001).
Figure 7
Figure 7. IL-4 and IL-13 dampen polyfunctional (IFN-γ+ TNF-α+) CD8+ T cell numbers following VV-WR infection.
BALB/c IL-13 −/−, BALB/c IL-4 −/−, BALB/c STAT6 −/− and BALB/c WT control mice (n = 6 per group) were infected with 3×10⁶ PFU of VV-WR or kept as unimmunized controls for 7 days prior to sacrifice and analysis using ICS after in vitro peptide stimulation. A, Representative dot plots showing IFN-γ and TNF-α expression on gated CD8+ splenocytes from VV-WR infected mice of the indicated genetic background following in vitro stimulation of splenocytes with the indicated peptides. B, Mean (n = 6) total number of KdA5275–83 or KdF226–34 specific CD8+ IFN-γ+ or CD8+ IFN-γ+ TNF-α+ splenocytes from the indicated mice infected with VV-WR. C, Mean (n = 6) proportion of KdA5275–83 or KdF226–34 specific CD8+ IFN-γ+ splenocytes that also produced TNF-α from the indicated mice infected with VV-WR. The data presented in all panels are representative of at least two independent. Error bars depict the SEM and statistical significance was determined using a one-way ANOVA (Tukey's Multiple Comparison) relative to WT control mice (* - p<0.05; *** - p<0.001).
Figure 8
Figure 8. STAT6 is required for IL-4 mediated attrition of VV-specific CD8+ T cell responses.
BALB/c STAT6 −/− (n = 4) and BALB/c WT control mice (n = 5) were infected with 5×10⁶ PFU of VV-HA, VV-HA-IL-4 or kept unimmunized for 7 days prior to sacrifice and analysis using ICS after in vitro peptide stimulation. A and B, Representative dot plots showing IFN-γ and TNF-α expression on gated CD8+ splenocytes from infected BALB/c WT (A) or BALB/c STAT6 −/− (B) mice following in vitro stimulation of splenocytes with the indicated peptides. C, The mean (n = 4–5) number of cytokine producing KdA5275–83 or KdF226–34 specific CD8+ splenocytes and the mean (n = 4–5) proportion of CD8+ splenocytes that produced TNF-α in addition to IFN-γ from BALB/c WT (top row of plots) or BALB/c STAT6 −/− (bottom row of plots) mice infected with the indicated virus. The data are representative of two independent experiments and the error bars depict the SEM. One-way ANOVA (Tukey's Multiple Comparison) was used to determine statistical significance of the data relative to VV-HA infected mice (* - p<0.05; ** - p<0.01; *** - p<0.001).

References

    1. Dudley ME, Wunderlich JR, Robbins PF, Yang JC, Hwu P, et al. (2002) Cancer regression and autoimmunity in patients after clonal repopulation with antitumor lymphocytes. Science 298: 850–854. - PMC - PubMed
    1. Harty JT, Tvinnereim AR, White DW (2000) CD8+ T cell effector mechanisms in resistance to infection. Annu Rev Immunol 18: 275–308. - PubMed
    1. Zinkernagel RM, Doherty PC (1974) Restriction of in vitro T cell-mediated cytotoxicity in lymphocytic choriomeningitis within a syngeneic or semiallogeneic system. Nature 248: 701–702. - PubMed
    1. Seder RA, Darrah PA, Roederer M (2008) T-cell quality in memory and protection: implications for vaccine design. Nat Rev Immunol 8: 247–258. - PubMed
    1. Derby M, Alexander-Miller M, Tse R, Berzofsky J (2001) High-avidity CTL exploit two complementary mechanisms to provide better protection against viral infection than low-avidity CTL. J Immunol 166: 1690–1697. - PubMed

Publication types

MeSH terms