. 2012 Dec 22;13(12):R124.
doi: 10.1186/gb-2012-13-12-r124.

DriverNet: uncovering the impact of somatic driver mutations on transcriptional networks in cancer

DriverNet: uncovering the impact of somatic driver mutations on transcriptional networks in cancer

Ali Bashashati et al. Genome Biol. .

Abstract

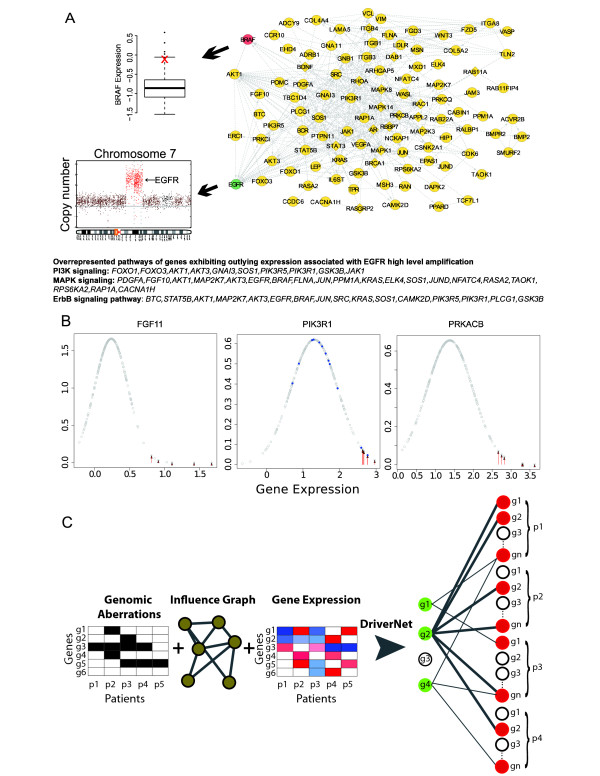
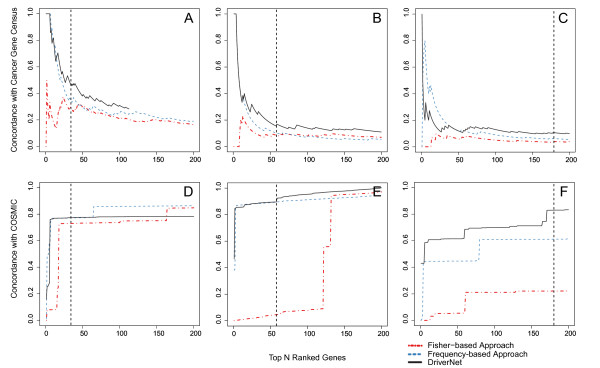
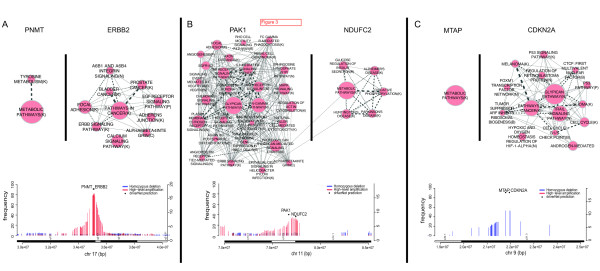
Simultaneous interrogation of tumor genomes and transcriptomes is underway in unprecedented global efforts. Yet, despite the essential need to separate driver mutations modulating gene expression networks from transcriptionally inert passenger mutations, robust computational methods to ascertain the impact of individual mutations on transcriptional networks are underdeveloped. We introduce a novel computational framework, DriverNet, to identify likely driver mutations by virtue of their effect on mRNA expression networks. Application to four cancer datasets reveals the prevalence of rare candidate driver mutations associated with disrupted transcriptional networks and a simultaneous modulation of oncogenic and metabolic networks, induced by copy number co-modification of adjacent oncogenic and metabolic drivers. DriverNet is available on Bioconductor or at http://compbio.bccrc.ca/software/drivernet/.


Figures

Figure 1
Figure 1
A schematic showing how DriverNet works. (a) An example of a Cytoscape visualization of a glioblastoma patient with a high-level amplification of epidermal growth factor receptor (EGFR) (shown in green) and coincident outlying expression of genes connected to EGFR in the Reactome influence graph (shown in yellow). Examples of the overrepresented pathways (by Reactome FI plug-in for Cytoscape, FDR < 0.001) from the list of genes showing outlying expression associated with the EGFR amplification are depicted at the bottom. The box plot shows the population-level expression distribution of BRAF, an interacting protein with EGFR, and where the specific case with EGFR amplification sits on that distribution (red 'x'). We note that in this case, BRAF itself is not mutated or amplified. (b) Fitted Gaussian expression distributions of three genes that interact with EGFR: FGF11, PIK3R1, and PRKACB, with each point indicating the probability density function for individual cases. For each gene, blue dots indicate cases with mutations in the gene itself and red arrows indicate cases with outlying expression with coincident EGFR amplifications. (c) Schematic representation of the DriverNet approach. Given the genomic aberration states for different patients and genes, gene expression data, and the influence graph, which captures biological pathway information, the bipartite graph shown on the right is constructed. Green nodes on the left partition of the bipartite graph correspond to aberrated genes and nodes on the right represent the outlying expression status for each patient where red indicates outlying patient-gene events from the gene expression matrix. The genes with the highest number of outlying expression events (for example, g2) are nominated as putative drivers.
Figure 2
Figure 2
DriverNet performance benchmarking with the GBM2, HGS2, and HGS2 datasets. (A-C) Concordance with Cancer Gene Census for DriverNet, Frequency-based, and Fisher-based approaches as a function of the top N ranked genes (out of 200) for the GBM2, TN2, and HGS2 datasets, respectively. (D-F) Concordance with the COSMIC database (cumulative distribution of mutation prevalence in the COSMIC database) for DriverNet, Frequency-based, and Fisher-based approaches as a function of the top N ranked genes (out of 200) for the GBM2, TN2, and HGS2 datasets, respectively. Note that for the GBM2 dataset, DriverNet nominates 113 genes as candidate drivers, therefore, the concordance of DriverNet genes with the Cancer Gene Census is plotted for the 113 candidates.
Figure 3
Figure 3
Simultaneous modulation of metabolic pathways in copy number alterations harboring known oncogenes. EnrichmentMap [32] diagrams depicting Reactome pathways enriched in the set of outliers associated with pairs of genes that are co-amplified or co-deleted. In each pair, one gene is a known tumor suppressor or oncogene while the other is a metabolism gene. Pathways are shown as connected nodes in a graph where the size of the node indicates the number of genes in the pathway. Edges between nodes indicate genes common to both pathways where the thickness of the edge represents the degree of overlap. In general, little overlap was observed between metabolic drivers and oncogenic/tumor-suppressor drivers. (A) PNMT and ERBB2 co-amplified genes at the chr17q12 locus in breast cancer. (B) PAK1 and NDUFC2 co-amplified genes at the 11q14 locus in breast cancer. (C) CDKN2A and MTAP co-deleted genes at chr9p21.3 in GBM.

References

    1. Cancer Genome Atlas Research Network. Comprehensive genomic characterization defines human glioblastoma genes and core pathways. Nature. 2008;13:1061–1068. doi: 10.1038/nature07385. - DOI - PMC - PubMed
    1. Prahallad A, Sun C, Huang S, Di Nicolantonio F, Salazar R, Zecchin D, Beijersbergen RL, Bardelli A, Bernards R. Unresponsiveness of colon cancer to BRAF(V600E) inhibition through feedback activation of EGFR. Nature. 2012;13:100–103. doi: 10.1038/nature10868. - DOI - PubMed
    1. Greenman C, Wooster R, Futreal PA, Stratton MR, Easton DF. Statistical analysis of pathogenicity of somatic mutations in cancer. Genetics. 2006;13:2187–2198. doi: 10.1534/genetics.105.044677. - DOI - PMC - PubMed
    1. Getz G, Hofling H, Mesirov JP, Golub TR, Meyerson M, Tibshirani R, Lander ES. Comment on: the consensus coding sequences of human breast and colorectal cancers. Science. 2007;13:1500–1500. http://www.hubmed.org/display.cgi?uids=17872428 - PubMed
    1. Youn A, Simon R. Identifying cancer driver genes in tumor genome sequencing studies. Bioinformatics. 2011;13:175–181. doi: 10.1093/bioinformatics/btq630. - DOI - PMC - PubMed

Publication types