

A simple high-throughput technology enables gain-of-function screening of human microRNAs
- PMID: 23384178
- PMCID: PMC3671589
- DOI: 10.2144/000113991
A simple high-throughput technology enables gain-of-function screening of human microRNAs
Abstract
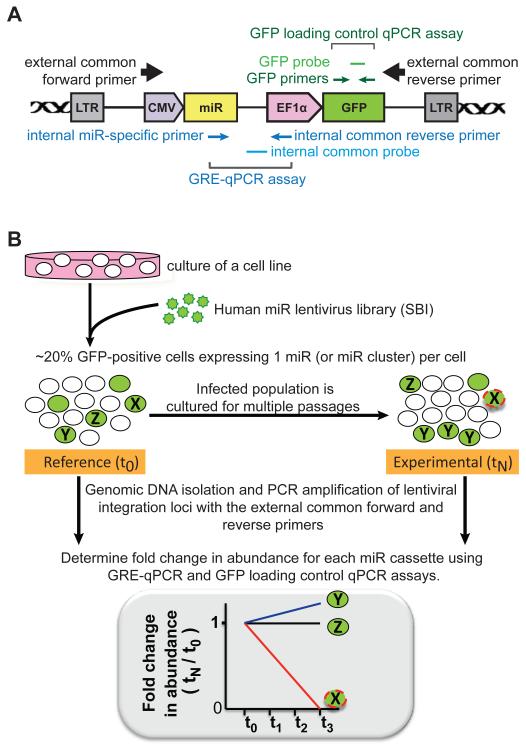
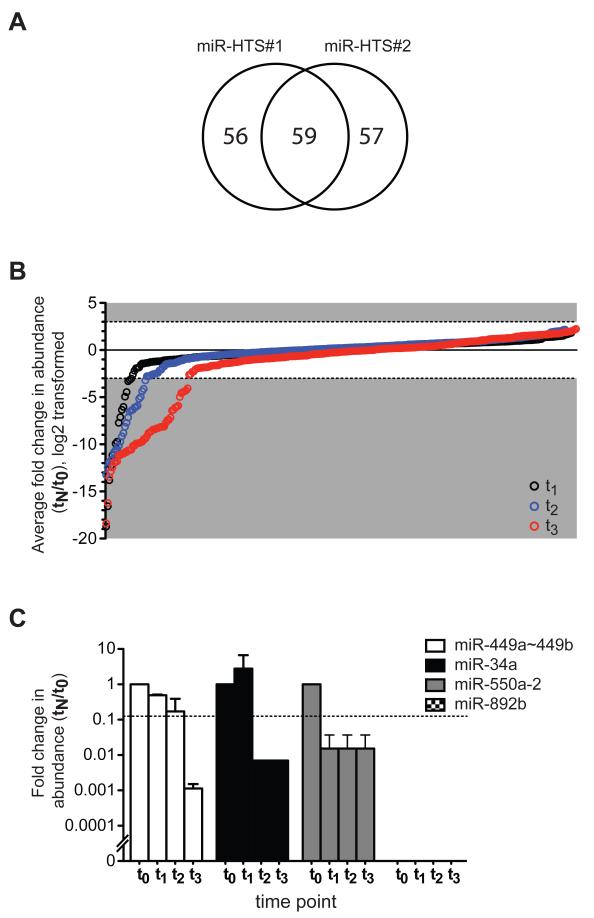
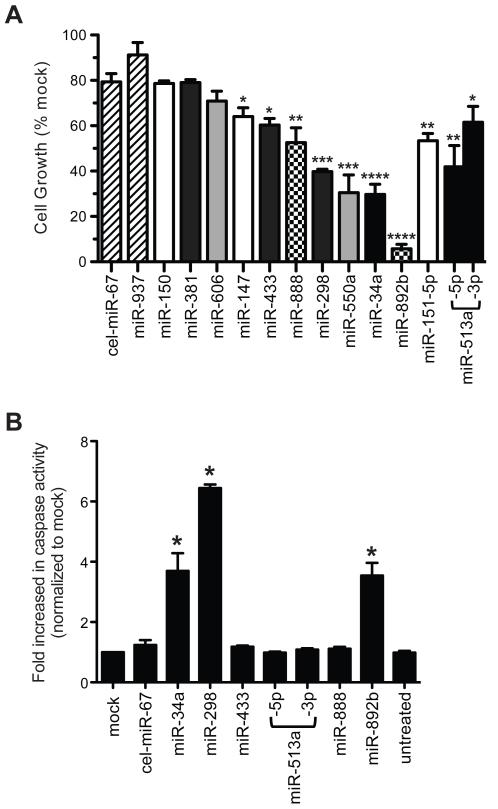
MicroRNAs (miRs) regulate cellular processes by modulating gene expression. Although transcriptomic studies have identified numerous miRs differentially expressed in diseased versus normal cells, expression analysis alone cannot distinguish miRs driving a disease phenotype from those merely associated with the disease. To address this limitation, we developed miR-HTS, a method for unbiased high-throughput screening of the miRNome to identify functionally relevant miRs. Herein, we applied miR-HTS to simultaneously analyze the effects of 578 lentivirally transduced human miRs or miR clusters on growth of the IMR90 human lung fibroblast cell line. Growth-regulatory miRs were identified by quantitating the representation (i.e., relative abundance) of cells overexpressing each miR over a one-month culture of IMR90, using a panel of custom-designed quantitative real-time PCR (qPCR) assays specific for each transduced miR expression cassette. The miR-HTS identified 4 miRs previously reported to inhibit the growth of human lung-derived cell lines and 55 novel growth-inhibitory miR candidates. Nine of 12 (75%) selected candidate miRs were validated and shown to inhibit IMR90 cell growth. Thus, this novel lentiviral library- and qPCR-based miR-HTS technology provides a sensitive platform for functional screening that is straightforward and relatively inexpensive.
Figures

Similar articles
-
Identification and characterization of microRNAs in vascular smooth muscle cells from patients with abdominal aortic aneurysms.J Vasc Surg. 2014 Jan;59(1):202-9. doi: 10.1016/j.jvs.2013.02.244. Epub 2013 Jun 5. J Vasc Surg. 2014. PMID: 23746831
-
MicroRNA signatures in tumor tissue related to angiogenesis in non-small cell lung cancer.PLoS One. 2012;7(1):e29671. doi: 10.1371/journal.pone.0029671. Epub 2012 Jan 25. PLoS One. 2012. PMID: 22295063 Free PMC article.
-
Transcriptome-wide based identification of miRs in congenital anomalies of the kidney and urinary tract (CAKUT) in children: the significant upregulation of tissue miR-144 expression.J Transl Med. 2016 Jun 30;14(1):193. doi: 10.1186/s12967-016-0955-0. J Transl Med. 2016. PMID: 27364533 Free PMC article.
-
Tissue micro-RNAs associated with colorectal cancer prognosis: a systematic review.Mol Biol Rep. 2021 Feb;48(2):1853-1867. doi: 10.1007/s11033-020-06075-1. Epub 2021 Feb 17. Mol Biol Rep. 2021. PMID: 33598796
-
MicroRNA and cancer--focus on apoptosis.J Cell Mol Med. 2009 Jan;13(1):12-23. doi: 10.1111/j.1582-4934.2008.00510.x. J Cell Mol Med. 2009. PMID: 19175697 Free PMC article. Review.
Cited by
-
MIR144 and MIR451 regulate human erythropoiesis via RAB14.Br J Haematol. 2015 Feb;168(4):583-97. doi: 10.1111/bjh.13164. Epub 2014 Oct 14. Br J Haematol. 2015. PMID: 25312678 Free PMC article.
-
Regulation of RAB5C is important for the growth inhibitory effects of MiR-509 in human precursor-B acute lymphoblastic leukemia.PLoS One. 2014 Nov 4;9(11):e111777. doi: 10.1371/journal.pone.0111777. eCollection 2014. PLoS One. 2014. PMID: 25368993 Free PMC article.
-
Uncovering low-dimensional, miR-based signatures of acute myeloid and lymphoblastic leukemias with a machine-learning-driven network approach.Converg Sci Phys Oncol. 2015 Dec;1(2):025002. doi: 10.1088/2057-1739/1/2/025002. Epub 2015 Dec 21. Converg Sci Phys Oncol. 2015. PMID: 27274862 Free PMC article.
-
Paired guide RNA CRISPR-Cas9 screening for protein-coding genes and lncRNAs involved in transdifferentiation of human B-cells to macrophages.BMC Genomics. 2022 May 26;23(1):402. doi: 10.1186/s12864-022-08612-7. BMC Genomics. 2022. PMID: 35619054 Free PMC article.
-
From big data to diagnosis and prognosis: gene expression signatures in liver hepatocellular carcinoma.PeerJ. 2017 Mar 14;5:e3089. doi: 10.7717/peerj.3089. eCollection 2017. PeerJ. 2017. PMID: 28316892 Free PMC article.
References
Publication types
MeSH terms
Substances
Grants and funding
LinkOut - more resources
Full Text Sources
Other Literature Sources
Molecular Biology Databases