

Flexible parametric modelling of cause-specific hazards to estimate cumulative incidence functions
- PMID: 23384310
- PMCID: PMC3614517
- DOI: 10.1186/1471-2288-13-13
Flexible parametric modelling of cause-specific hazards to estimate cumulative incidence functions
Abstract
Background: Competing risks are a common occurrence in survival analysis. They arise when a patient is at risk of more than one mutually exclusive event, such as death from different causes, and the occurrence of one of these may prevent any other event from ever happening.
Methods: There are two main approaches to modelling competing risks: the first is to model the cause-specific hazards and transform these to the cumulative incidence function; the second is to model directly on a transformation of the cumulative incidence function. We focus on the first approach in this paper. This paper advocates the use of the flexible parametric survival model in this competing risk framework.
Results: An illustrative example on the survival of breast cancer patients has shown that the flexible parametric proportional hazards model has almost perfect agreement with the Cox proportional hazards model. However, the large epidemiological data set used here shows clear evidence of non-proportional hazards. The flexible parametric model is able to adequately account for these through the incorporation of time-dependent effects.
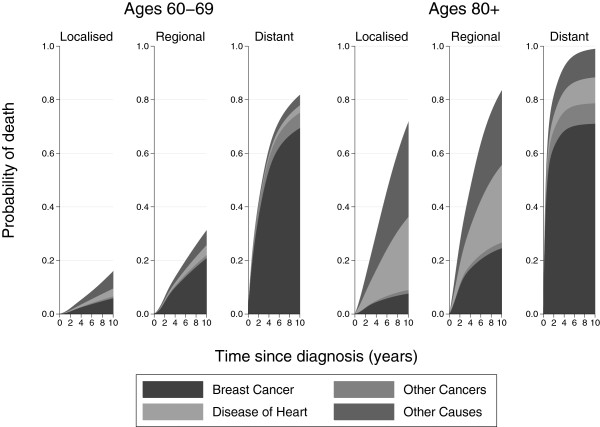
Conclusion: A key advantage of using this approach is that smooth estimates of both the cause-specific hazard rates and the cumulative incidence functions can be obtained. It is also relatively easy to incorporate time-dependent effects which are commonly seen in epidemiological studies.
Figures


Similar articles
-
Flexible parametric modelling of the cause-specific cumulative incidence function.Stat Med. 2017 Apr 30;36(9):1429-1446. doi: 10.1002/sim.7208. Epub 2016 Dec 22. Stat Med. 2017. PMID: 28008649
-
Estimating restricted mean survival time and expected life-years lost in the presence of competing risks within flexible parametric survival models.BMC Med Res Methodol. 2021 Mar 11;21(1):52. doi: 10.1186/s12874-021-01213-0. BMC Med Res Methodol. 2021. PMID: 33706711 Free PMC article.
-
Performing Survival Analyses in the Presence of Competing Risks: A Clinical Example in Older Breast Cancer Patients.J Natl Cancer Inst. 2015 Nov 26;108(5):djv366. doi: 10.1093/jnci/djv366. Print 2016 May. J Natl Cancer Inst. 2015. PMID: 26614095
-
A competing risks analysis should report results on all cause-specific hazards and cumulative incidence functions.J Clin Epidemiol. 2013 Jun;66(6):648-53. doi: 10.1016/j.jclinepi.2012.09.017. Epub 2013 Feb 14. J Clin Epidemiol. 2013. PMID: 23415868 Review.
-
Competing risks in epidemiology: possibilities and pitfalls.Int J Epidemiol. 2012 Jun;41(3):861-70. doi: 10.1093/ije/dyr213. Epub 2012 Jan 9. Int J Epidemiol. 2012. PMID: 22253319 Free PMC article. Review.
Cited by
-
Prognostic survival model for people diagnosed with invasive cutaneous melanoma.BMC Cancer. 2015 Jan 31;15:27. doi: 10.1186/s12885-015-1024-4. BMC Cancer. 2015. PMID: 25637143 Free PMC article.
-
Kidney Transplantation Outcomes across GN Subtypes in the United States.J Am Soc Nephrol. 2017 Feb;28(2):632-644. doi: 10.1681/ASN.2016020126. Epub 2016 Jul 18. J Am Soc Nephrol. 2017. PMID: 27432742 Free PMC article.
-
Premature mortality 16 years after emergency department presentation among homeless and at risk of homelessness adults: a retrospective longitudinal cohort study.Int J Epidemiol. 2023 Apr 19;52(2):501-511. doi: 10.1093/ije/dyad006. Int J Epidemiol. 2023. PMID: 36752734 Free PMC article.
-
Long-term risk of inflammatory bowel disease after endoscopic biopsy with normal mucosa: A population-based, sibling-controlled cohort study in Sweden.PLoS Med. 2023 Feb 23;20(2):e1004185. doi: 10.1371/journal.pmed.1004185. eCollection 2023 Feb. PLoS Med. 2023. PMID: 36821532 Free PMC article.
-
Comparison of the performances of survival analysis regression models for analysis of conception modes and risk of type-1 diabetes among 1985-2015 Swedish birth cohort.PLoS One. 2021 Jun 25;16(6):e0253389. doi: 10.1371/journal.pone.0253389. eCollection 2021. PLoS One. 2021. PMID: 34170924 Free PMC article. Clinical Trial.
References
-
- Fine JP, Gray RJ. A proportional hazards model for the subdistribution of a competing risk. J Am Stat Assoc. 1999;94:496–509. doi: 10.1080/01621459.1999.10474144. - DOI
MeSH terms
LinkOut - more resources
Full Text Sources
Other Literature Sources
Medical
