Review
. 2013 Jun;138(3):333-408.
doi: 10.1016/j.pharmthera.2013.01.016. Epub 2013 Feb 4.

Structure and dynamics of molecular networks: a novel paradigm of drug discovery: a comprehensive review

Affiliations
Review

Structure and dynamics of molecular networks: a novel paradigm of drug discovery: a comprehensive review

Peter Csermely et al. Pharmacol Ther. 2013 Jun.

Abstract

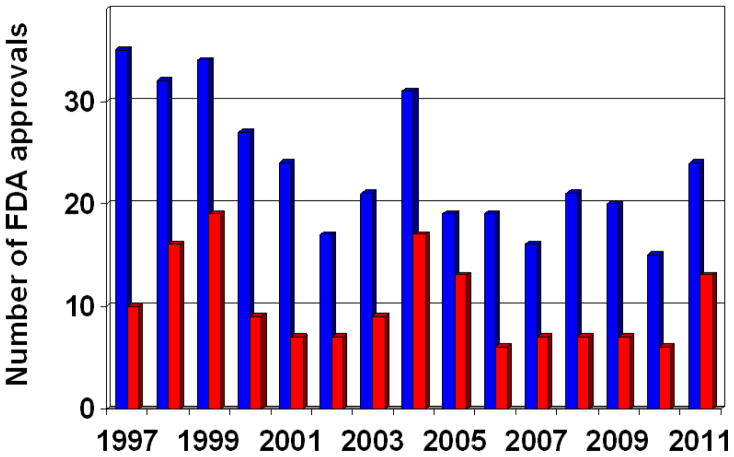
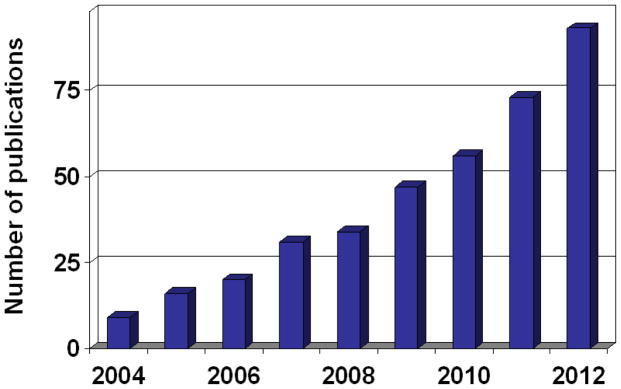
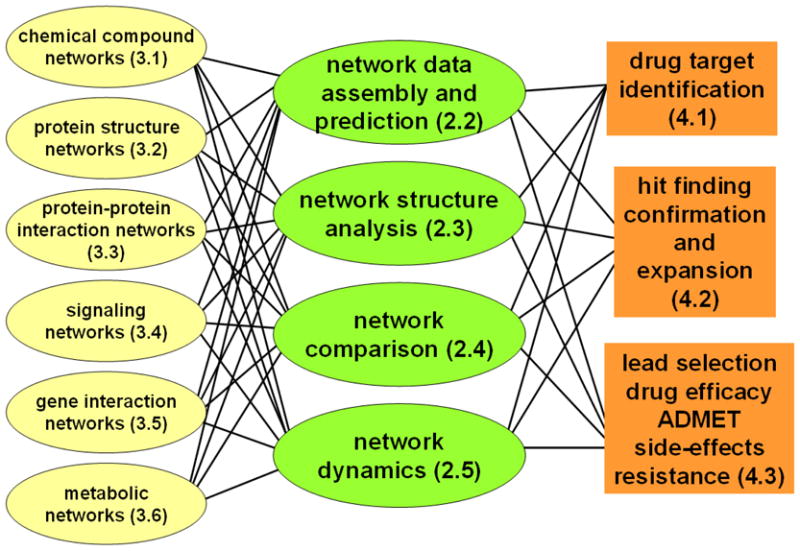
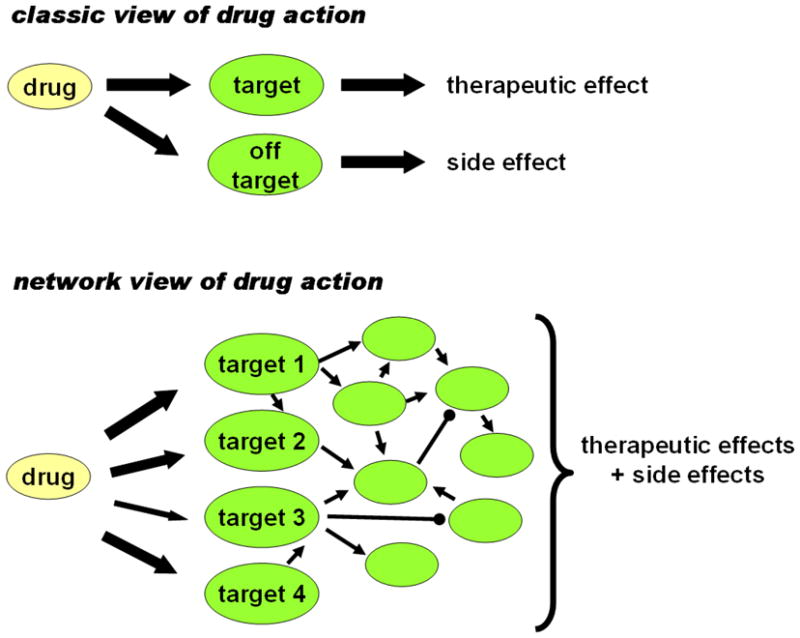
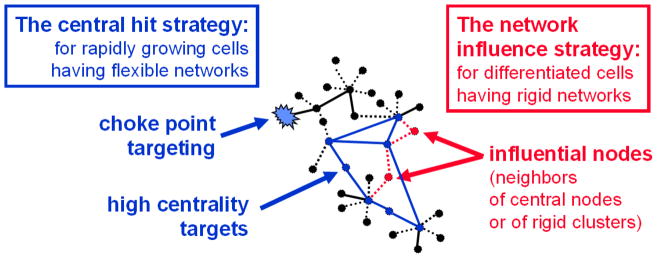
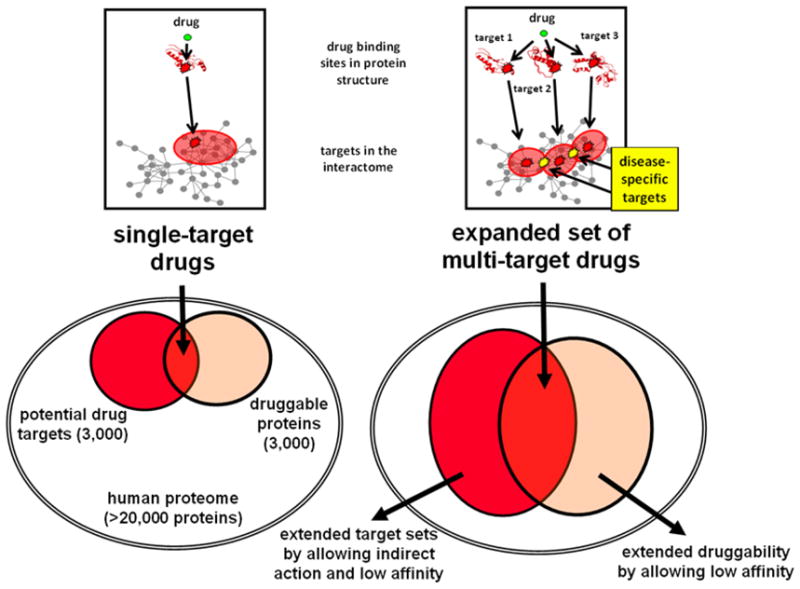
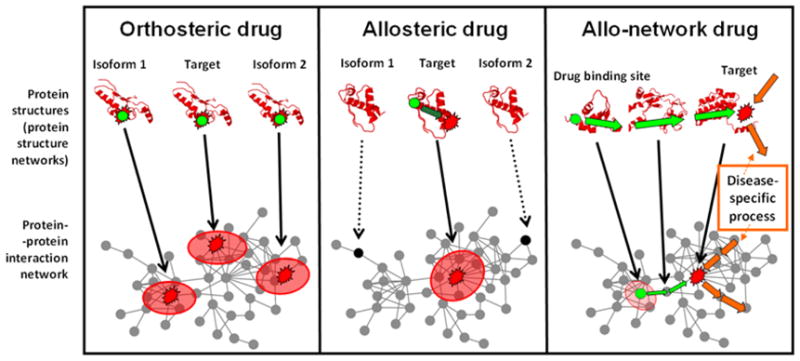
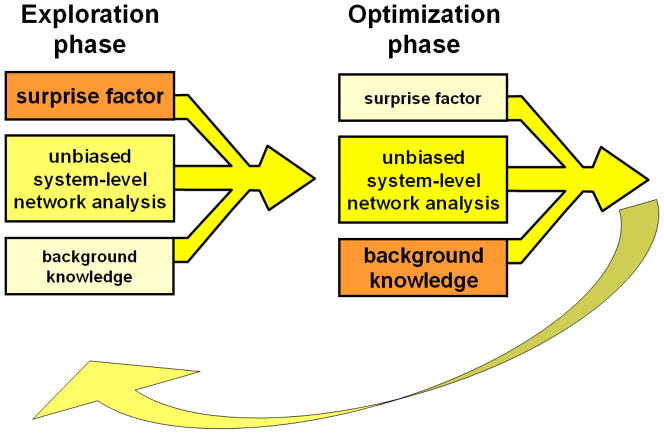
Despite considerable progress in genome- and proteome-based high-throughput screening methods and in rational drug design, the increase in approved drugs in the past decade did not match the increase of drug development costs. Network description and analysis not only give a systems-level understanding of drug action and disease complexity, but can also help to improve the efficiency of drug design. We give a comprehensive assessment of the analytical tools of network topology and dynamics. The state-of-the-art use of chemical similarity, protein structure, protein-protein interaction, signaling, genetic interaction and metabolic networks in the discovery of drug targets is summarized. We propose that network targeting follows two basic strategies. The "central hit strategy" selectively targets central nodes/edges of the flexible networks of infectious agents or cancer cells to kill them. The "network influence strategy" works against other diseases, where an efficient reconfiguration of rigid networks needs to be achieved by targeting the neighbors of central nodes/edges. It is shown how network techniques can help in the identification of single-target, edgetic, multi-target and allo-network drug target candidates. We review the recent boom in network methods helping hit identification, lead selection optimizing drug efficacy, as well as minimizing side-effects and drug toxicity. Successful network-based drug development strategies are shown through the examples of infections, cancer, metabolic diseases, neurodegenerative diseases and aging. Summarizing >1200 references we suggest an optimized protocol of network-aided drug development, and provide a list of systems-level hallmarks of drug quality. Finally, we highlight network-related drug development trends helping to achieve these hallmarks by a cohesive, global approach.


Conflict of interest statement

Conflict of interest statement

The authors declare that there are no conflicts of interest.

Figures

Fig. 1
Fig. 1
Number of new molecular entities (NME, a drug containing an active ingredient that has not been previously approved by the US FDA) approved by the US Food and Drug Administration (FDA). Blue bars represent the total number of NMEs, whereas red bars represent “priority” NMEs that potentially offer a substantial advance over conventional therapies. Source: http://www.fda.gov/Drugs/default.htm
Fig. 2
Fig. 2
Success rate of new molecular entities (NMEs) by R&D development phases. The figure shows the combined R&D survival by development phase for 14 large pharmaceutical companies. (Reprinted by permission from the Macmillan Publishers Ltd: Nature Chemical Biology, Bunnage, 2011, Copyright, 2011.) Note that attrition figures for early phases might be even higher, since an early problem might be first neglected making a failure only at a later phase (Brown & Superti-Furga, 2003).
Fig. 3
Fig. 3
Network-application in drug-design related publications. Data are from PubMed using the query of “network AND drug” for title and abstract words. The number of publications in 2012 is an extrapolation.
Fig. 4
Fig. 4
Uses of network description and analysis in drug design. Numbers in parentheses refer to section numbers of this review.
Fig. 5
Fig. 5
Classic and network views of drug action. Made after the basic idea of Berger and Iyengar (2009).
Fig. 6
Fig. 6
Options for network representations of disease-related data. The figure summarizes some of the options to assess disease-related data using network description and analysis. Each ellipse represents a type of data. Arrows stand for possible network representations. 1: Human disease networks discussed in this section and in Table 2. 2: Additional network-related data helping the identification of disease-related human genes (acting like possible drug targets) detailed in Table 3. 3: Drug target networks discussed in Section 4.1.3.
Fig. 7
Fig. 7
Two projections of the human disease network. On the middle of the figure a segment of the bipartite network of human diseases and related human genes is shown. On the projection on the left side two diseases are connected, if they have at least one common gene. On the projection on the right side two genes are connected, if they have at least one common disease (reproduced with permission from Goh et al., 2007; Copyright, 2007, National Academy of Sciences, U.S.A.).
Fig. 8
Fig. 8
Bridge, inter-modular hub and bottleneck. The network on the left side of the figure has two modules (modules A and B marked by the yellow dotted lines), which are connected by a bridge and by an inter-modular hub. By the removal of the red edge from the network on the left side, the former bridge obtains a unique and monopolistic role connecting modules A and B, and is therefore called as a bottleneck.
Fig. 9
Fig. 9
Rich club, nested network and onion network. The figure illustrates the differences between a network having a rich club (left side), having a highly nested structure (middle) and developing an onion-type topology (right side). Note that the connected hubs of the rich club became even more connected by adding the 3 red edges on the middle panel. Connection of the peripheral nodes by an additional 10 red edges on the right panel turns the nested network to an onion network having a core and an outer layer. Note that the rich club network already has a nested structure, and both the nested network and the onion network have a rich club. Larger onion networks have multiple peripheral layers.
Fig. 10
Fig. 10
Alluvial diagram illustrating the temporal changes of network communities. Each block represents a network module with a height corresponding to the module size. Modules are ordered by size (in case of a hierarchical structure within their super-modules). Darker colors indicate module cores. Modules having a non-significant difference are closer to each other. The height of the changing fields in the middle of the representation corresponds to the number of nodes participating in the change. To reduce the number of crossovers, changes are ordered by the order of connecting modules. To make the visualization more concise transients are passing through the midpoints of the entering and exiting modules and have a slim waist. Note the split of the blue module, and the merge of the orange and red modules. (Reproduced with permission from Rosvall & Bergstrom, 2010.)
Fig. 11
Fig. 11
Mechanisms of drug action changing cellular robustness. Panel A shows a 2-dimensional contour plot of the stability landscape of healthy and diseased phenotypes. Healthy states are represented by the central and the adjacent two minima marked with the large orange arrows, while all additional local minima are diseased states. Darker green colors refer to states with larger stability. Thin blue and red arrows mark shifts to healthy and diseased states, respectively. Dashed arrows refer to less probable changes. Panel B illustrates mechanisms of drug action on cellular robustness. The valleys and hills are a vertical representation of the stability-landscape shown on Panel A along the horizontal dashed black line. Blue symbols represent drug interactions with disease-prone or disease-affected cells, while red symbols refer to drug effects on cancer cells or parasites. (a) Counteracting regulatory feedback; (b) positive feedback pushing the diseased cell or parasite to another trajectory; (c) a transient decrease of a specific activation energy enabling a shift back to healthy state; (d) ‘error-catastrophe’: drug action diminishing many activation energies at the same time, causing cellular instability, which leads to cell death; (e) general increase in activation energies leading to the stabilization of healthy cells to prevent their shift to diseased phenotype.
Fig. 12
Fig. 12
Example of a chemical structure network. From the network point of view chemical structures are networks with differently labelled (colored) nodes representing different kinds of atoms and differently labelled (colored) edges related to different types of bonds. The chemical stucture network representation of aspirin is shown. Black circles, red triangles and blue rectangles represent carbon, oxygen and hydrogen atoms, respectively. Dotted black edges stand for single bonds, while red solid edges represent double bonds.
Fig. 13
Fig. 13
Directed and bipartite network representations of chemical reaction networks. On the middle panel the 4 reactions of the left side of the figure are represented as a directed network of participating compounds. On the bipartite network of the right panel green circles represent chemicals, while red rectangles stand for reactions. (Figures were adapted from Fialkowski et al., 2005 and from Grzybowski et al., 2009.)
Fig. 14
Fig. 14
Saltatoric signal transduction along a propagating rigidity-front: a possible mechanism of allosteric action in protein structures. Panel A shows two rigid modules of protein structure networks (corresponding to protein segments or domains). Such modules have little overlap, behave like billiard balls, and transmit signals ‘instantaneously’ (illustrated with the violet arrows). Panel B shows two flexible modules. These modules have a larger overlap, and transmit signals via a slower mechanism using multiple trajectories, which converge at key, bridging amino acids situated in modular boundaries. Panel C combines rigid and flexible modules in a hypothetical model of rigidity front propagation of the allosteric conformational change. In the 3 snapshots of this illustration of protein dynamics (organized from left to right) the 3 protein segments become rigid from top to bottom. Consecutive ‘rigidization’ of protein segments both induces similar changes in the neighboring segment, and accelerates the propagation of the allosteric change within the rigid segment. Rigidity front propagation may use sequential energy transfers (illustrated by the violet arrows), and may increase the speed of the allosteric change approaching that of an instantaneous process (Piazza & Sanejouand, 2009; Csermely et al., 2010; Csermely et al., 2012).
Fig. 15
Fig. 15
The effect of more detailed representation of protein-protein interaction networks in representation of drug mechanism action. The left side of the figure shows a hypothetical protein-protein interaction network (yellow nodes). The middle panels show two representations of the very same network as a domain-domain interaction network (green nodes). Note that on the middle top panel the edge marked with red connects domains A1 and B2 while on the middle bottom panel the same edge connects domains A2 and B2. Note that these two representations can not be discriminated at the protein-protein interaction level (shown on the left side marked with green nodes). If domain A2 (highlighted with red) is inhibited by a drug (and there is limited domain-domain interaction in protein A), this single edge-change leaves the sub-interactome in the right top panel intact. On the contrary, in the right bottom panel, the inhibition of domain A2 leads to the dissociation of the subnetwork. The figure is re-drawn from Figure 2 of Santonico et al. (2005) with permission. An atomic level resolution of the interactome can discriminate even more subtle changes as we will discuss in Section 4.1.6. on allo-network drugs (Nussinov et al., 2011).
Fig. 16
Fig. 16
The dumpling soup representation of growth factor initiated signaling. (Reproduced with permission from Lewitzky et al., 2012.)
Fig. 17
Fig. 17
Structure of the signaling network. The figure illustrates the major components of the signaling network including the upstream part of the signaling pathways and their cross-talks and the downstream part of gene regulation network. The gene regulation network contains the subnetworks of transcription factors, their DNA-binding sites and regulating microRNAs. Directed protein-protein interactions may encode enzyme reactions, such as phosphorylation events, while undirected protein-protein interactions participate (among others) in formation of scaffold and adaptor complexes.
Fig. 18
Fig. 18
The drug development process. Green boxes illustrate the major stages of the drug development process starting with target identification, followed by hit finding, hit confirmation and hit expansion leading to lead selection/optimization and concluded by clinical trials. Lead search and lead optimization are helped by various methods of chemoinformatics (left side), drug efficiency optimization, ADMET (drug absorption, distribution, metabolism, excretion and toxicity) studies, as well as optimization of drug-drug interactions, side-effects and resistance (right side). Yellow ellipses summarize a few major optimization criteria, while orange ellipses refer to the subsections of Section 4 discussing the given drug development stage.
Fig. 19
Fig. 19
Illustrative figure on the two major strategies to find network nodes as drug targets. The central hit strategy (represented by dark blue symbols) is useful to find drug targets against infectious agents or in anti-cancer therapies. These cells are presumed to have flexible networks. The central hit strategy targets central nodes (often forming a core of the network) or ‘choke points’, which are peripheral nodes uniquely producing or consuming a cellular metabolite. The network influence strategy (represented by red symbols) is needed to use the systems-level knowledge to find the targets in therapies of polygenic, complex diseases. The differentiated cells of these diseases are presumed to have rigid networks. Targeting central nodes here may cause an ‘over-excitement’ of the system leading to side-effects and toxicity. Thus the network influence strategy targets nodes, which are neither hubs nor otherwise central nodes themselves, but occupying strategically important disease-specific network positions able to influence central nodes. (In a typical case the network influence strategy targets are neighbors of central nodes exerting an indirect influence on the central nodes often representing the ‘real targets’.) Solid lines represent network edges with high weight, while dashed lines represent network edges with low weight.
Fig. 20
Fig. 20
A refined representation of a drug target network includes protein conformations. In current drug target network representations drug targets (gray circles) are interpreted as single entities connected through drugs (black circles). In these representations protein conformations preferred or dispreferred by a certain drug are ignored. For a more complete understanding of the interactions of drugs to their targets a target should be represented by its different functionally relevant conformations (differently colored shapes within grey line enclosed areas). Drug targets that are represented by single structures are connected to drugs by blue dashed lines. The target conformations that preferentially bind a drug are connected by red dashed lines. (Reproduced by permission from Isin et al., 2012.)
Fig. 21
Fig. 21
Multi-target drugs are target multipliers. The top left panel and the red circle of the bottom left part of the figure shows the targets of single-target drugs situated in pharmacologically interesting pathways and the hits of chemical proteomics, which represent those proteins, which can interact with druggable molecules. (The numbers are only approximate, and in case of the human proteome contain only the non-redundant proteins.) The overlap between the two sets constitutes the ‘sweet spot’ of drug discovery (Brown & Superti-Furga, 2003). On the right side of the figure the expansion of the ‘sweet spot’ is shown by multi-target drugs. The top left part illustrates the action of multi-target drugs. Yellow asterisks highlight the indirect targets, where the changes initiated by the multiple primary targets are superposed. It is a significant advantage, if these targets are disease-specific. On the bottom left part the indirect targets of multi-target action and the allowed low affinity binding of multi-target drugs both expand the number of pharmacologically relevant targets, while low-affinity binding enlarges the number of druggable proteins. The overlap of the two groups (the ‘sweet spot’) displays a dramatic increase.
Fig. 22
Fig. 22
Comparison of orthosteric, allosteric and allo-network drugs. Top parts of the three panels illustrate the protein structures of the primary drug targets showing the drug binding site as a green circle. Bottom parts of the panels illustrate the position of the primary targets in the human interactome. Red ellipses illustrate the ‘action radius’, i.e. the network perturbation induced by the primary targets. In the top part of the middle panel the allosteric drug binds to an allosteric site and affects the pharmacologically active site of the target protein (marked by a red asterisk) via the intra-protein allosteric signal propagation shown by the dark green arrow. In the top part of the right panel the signal propagation (illustrated by the light green arrows) extends beyond the original drug binding protein, and via specific interactions affects two neighboring proteins in the interactome. The pharmacologically active site is also marked by a red asterisk here. Orange arrows illustrate an intracellular pathway of propagating conformational changes, which is disease-specific in case of successful allo-network drugs. Allo-network drugs allow indirect and specific targeting of key proteins by a primary attack on a ‘silent’ protein, which is not involved in major cellular pathways. Targeting ‘silent’, ‘by-stander’ proteins, which specifically influence pharmacological targets, not only expands the current list of drug targets, but also causes much less side-effects and toxicity. Adapted with permission from Nussinov et al. (2011).
Fig. 23
Fig. 23
Optimized protocol of network-aided drug development. The figure illustrates the two major phases of discovery having three segments marked as boxes on the left side of the triple arrows. The “surprise factor” box denotes originality (as the highest level of human creativity), a strong drive to discover the unexpected, including playfulness and ambiguity tolerance. The “unbiased systems-level network analysis” box marks the network methods described in this review. The “background knowledge” box includes all our contextual, background knowledge on diseases, drugs and their actions, as well as the validation procedures guiding our judgment on the quality of the drug discovery process. In the exploration phase the surprise factor is dominant. At this phase background knowledge may be temporarily suppressed. On the contrary, at the optimization phase we need to suppress the surprise factor, and rank our previous options by the rigorous application of our background knowledge. The arrow at the bottom of the figure marks the heretofore not rigorously applied method that the sequence of exploration and optimization phases may be applied repeatedly, which gives a much more precise ‘zoom-in’ to the optimal (drug) target than a single round of exploration/optimization.

References

    1. Abdi A, Tahoori MB, Emamian ES. Fault diagnosis engineering of digital circuits can identify vulnerable molecules in complex cellular pathways. Science Signaling. 2008;1:ra10. - PubMed
    1. Acharyya S, Oskarsson T, Vanharanta S, Malladi S, Kim J, Morris PG, Manova-Todorova K, Leversha M, Hogg N, Seshan VE, Norton L, Brogi E, Massagué J. A CXCL1 paracrine network links cancer chemoresistance and metastasis. Cell. 2012;150:165–178. - PMC - PubMed
    1. Adamcsek B, Palla G, Farkas IJ, Derenyi I, Vicsek T. CFinder: locating cliques and overlapping modules in biological networks. Bioinformatics. 2006;22:1021–1023. - PubMed
    1. Adams JC, Keiser MJ, Basuino L, Chambers HF, Lee DS, Wiest OG, Babbitt PC. A mapping of drug space from the viewpoint of small molecule metabolism. PLoS Comput Biol. 2009;5:e1000474. - PMC - PubMed
    1. Adar E. GUESS: A language and interface for graph exploration. In: Grinter R, Rodden T, Aoki P, Cutrell E, Jeffries R, Olson G, editors. CHI ‘06 Proceedings of the SIGCHI conference on human factors in computing systems. New York: Association for Computing Machinery; 2006. pp. 791–800.

Publication types