. 2013 May;33(5):716-23.
doi: 10.1038/jcbfm.2013.7. Epub 2013 Feb 6.

Multimodal examination of structural and functional remapping in the mouse photothrombotic stroke model

Affiliations

Multimodal examination of structural and functional remapping in the mouse photothrombotic stroke model

Andrew N Clarkson et al. J Cereb Blood Flow Metab. 2013 May.

Erratum in

  • Corrigendum.
    [No authors listed] [No authors listed] J Cereb Blood Flow Metab. 2017 Oct;37(10):3457. doi: 10.1177/0271678X17726949. Epub 2017 Aug 8. J Cereb Blood Flow Metab. 2017. PMID: 28786737 Free PMC article. No abstract available.

Abstract

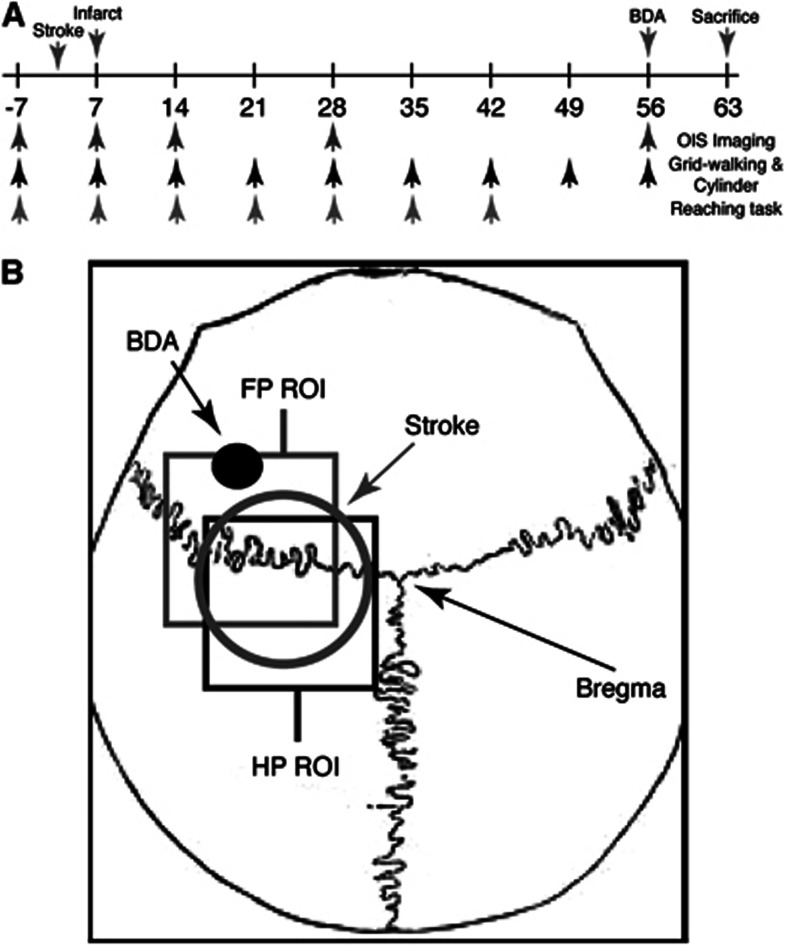
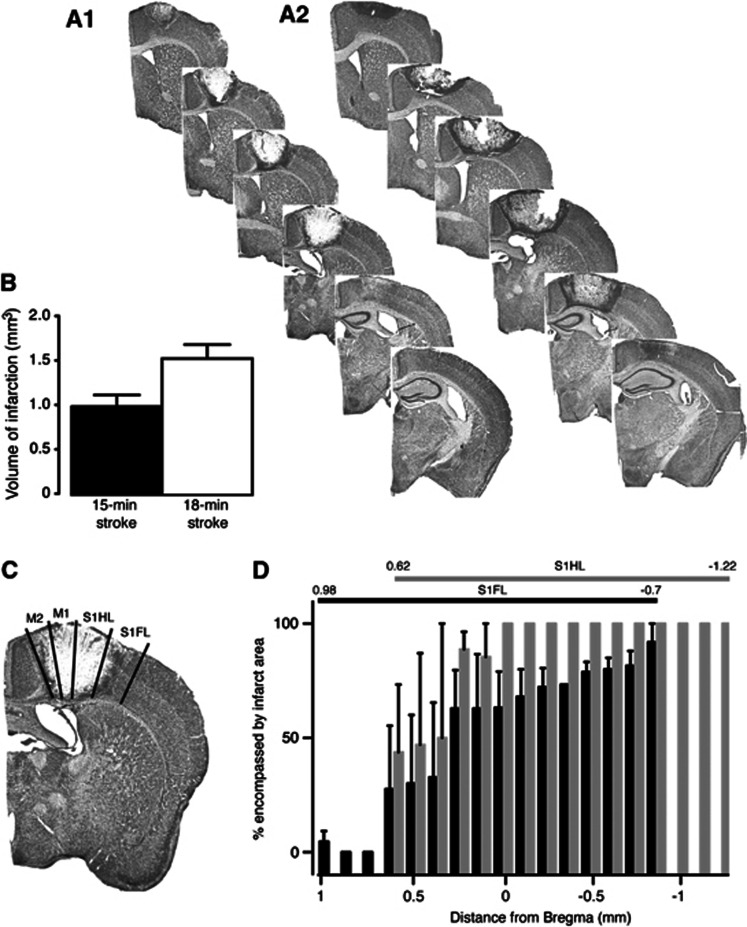
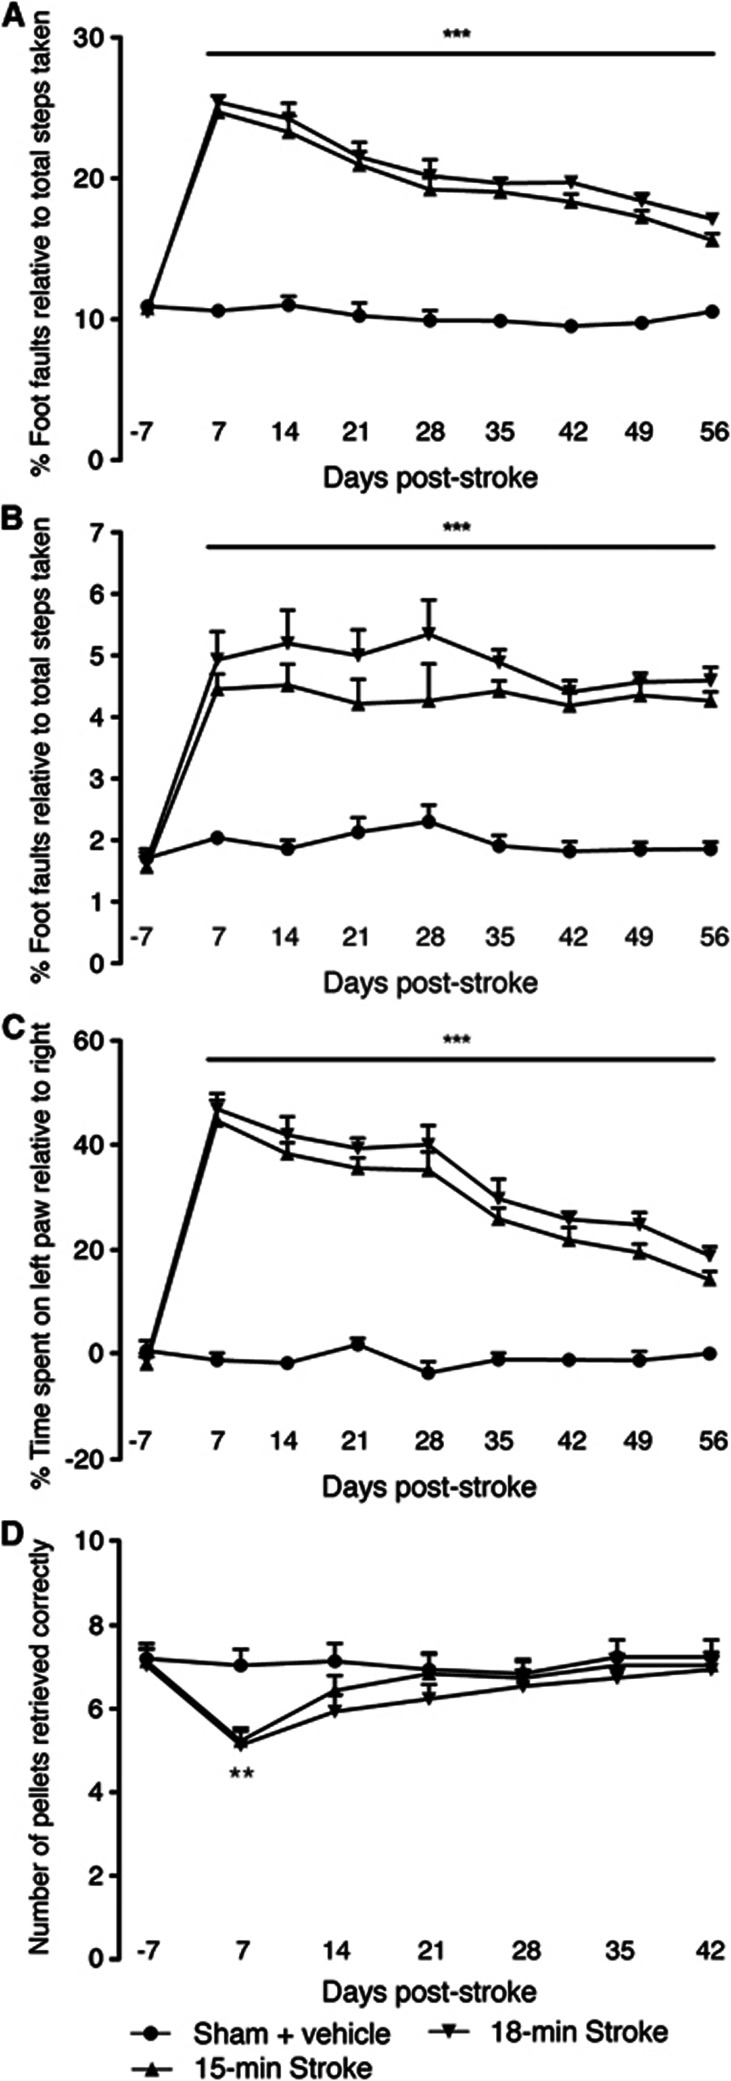
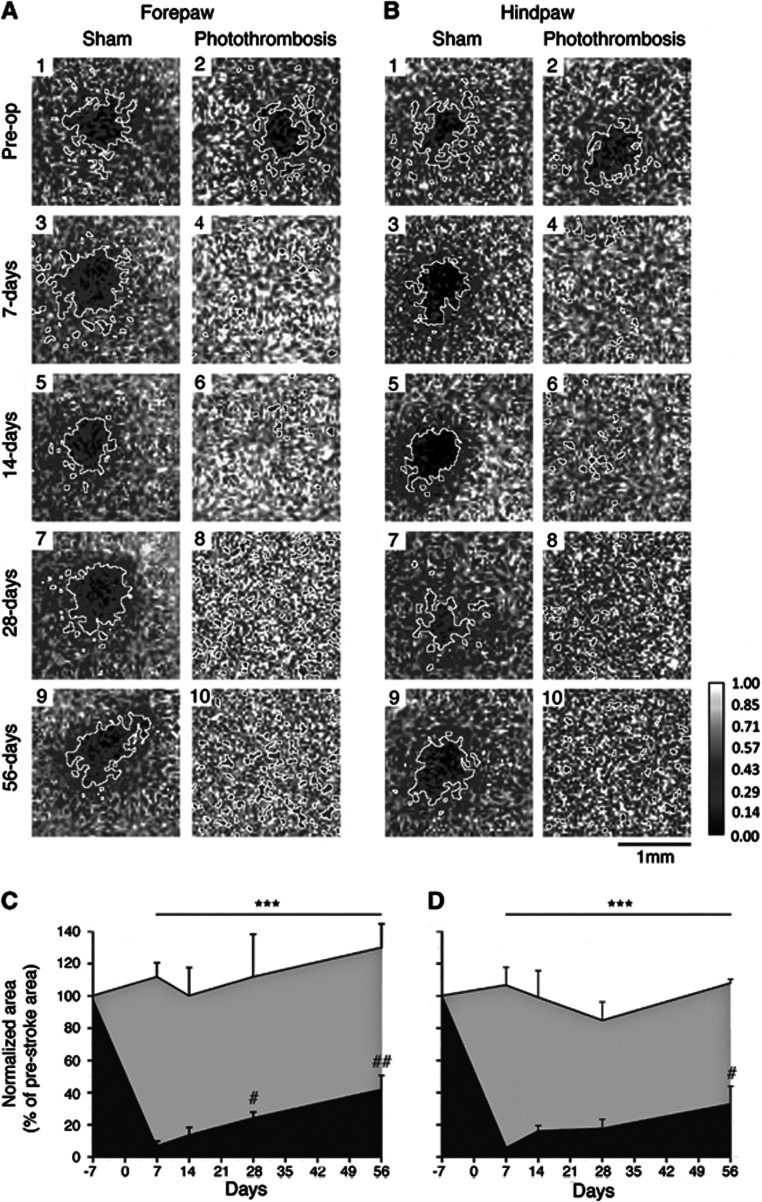
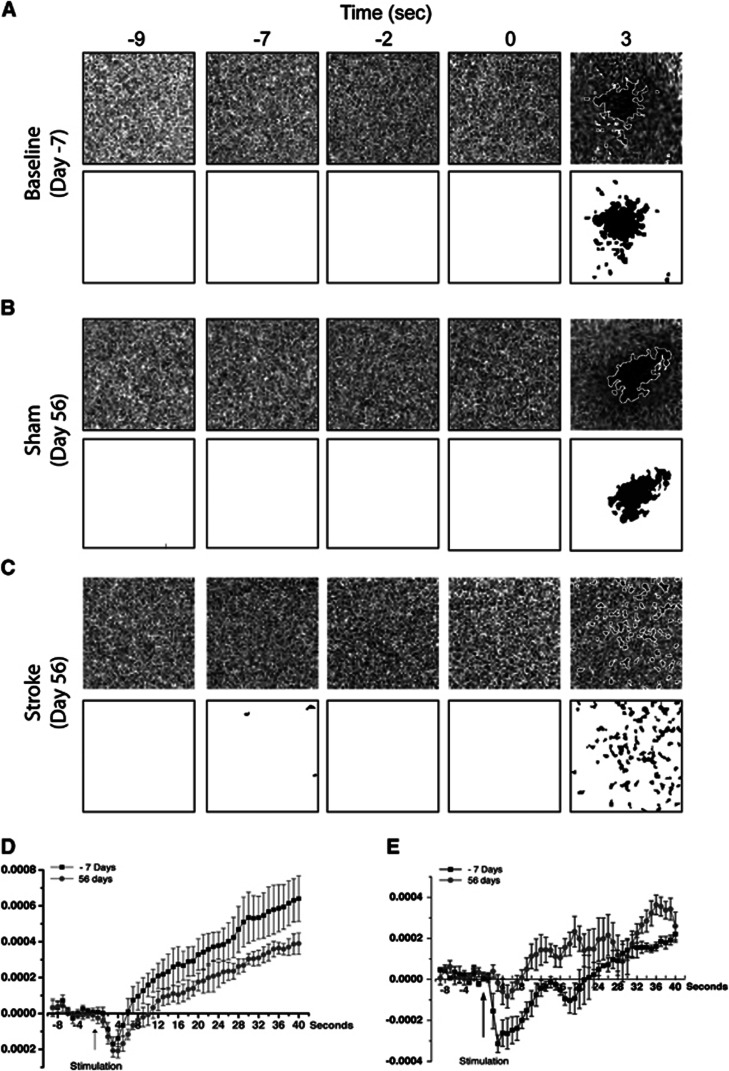
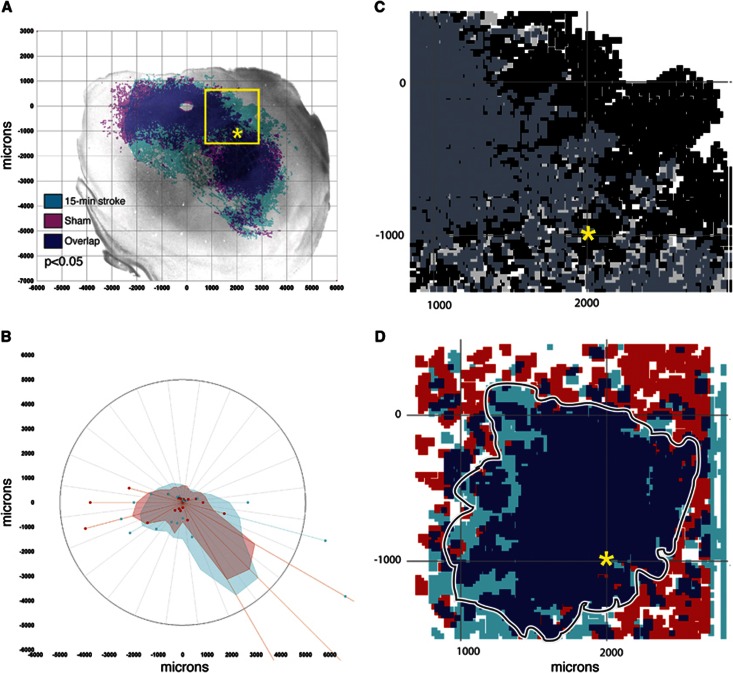
Recent studies show a limited capacity for neural repair after stroke, which includes remapping of sensorimotor functions and sprouting of new connections. However, physiologic and connectional plasticity of sensory maps during long-term functional recovery in the mouse have not been determined. Using a photothrombotic stroke model, we targeted the motor cortex, which we show results in lasting behavioral deficits on the grid-walking and in the cylinder tasks out to 8 weeks after stroke. Mice recovered performance in a skilled reaching task, showing no deficit from week 2 after stroke. Long-term optical intrinsic signal imaging revealed functional reorganization of sensory cortical maps for both forelimb and hindlimb, with more diffuse sensory physiologic maps. There was a small but significant increase in motor neuron projections within the areas of functional cortical reorganization as assessed using the neuroanatomic tracer biotinylated dextran amine. These findings show that the sensorimotor cortex undergoes remapping of cortical functions and axonal sprouting within the same regions during recovery after stroke. This suggests a linked structural and physiologic plasticity underlying recovery. Combined long-term structural and functional mapping after stroke in the mouse is practical and provides a rich data set for mechanistic analysis of stroke recovery.


Figures

Figure 1
Figure 1
Schematic of experimental procedures. Schematic showing the timeline of experimental procedures (A). Schematic image showing location of stroke (circle), biotinylated dextran amine (BDA) injection (black dot), and regions where forepaw (FP) and hindpaw (HP) optical intrinsic signaling (OIS) images were taken, relative to bregma (B). ROI, region of interest.
Figure 2
Figure 2
Histologic assessments after stroke. Representative cresyl violet-stained sections from 15- (A1) and 18-minute (A2) motor cortex-stroked animals. Lesion size quantification is shown in (B). Representative image showing primary and sensory forelimb and hindlimb areas affected by the stroke is shown in (C). The percent of sensory forelimb (black bars) and hindlimb (gray bars) affected by the stroke is shown in (D). An n=4 per group.
Figure 3
Figure 3
Behavioral recovery after photothrombosis stroke. Behavior was assessed on grid-walking (A and B), cylinder/forelimb asymmetry (C), and on the reaching (D) tasks. Analysis of forelimb (A) and hindlimb (B) foot faults revealed a significant increase in the number of foot faults compared with baseline and time-matched sham controls. Assessment of forelimb asymmetry using the cylinder task (C) showed that the mice had a greater tendency to spend more time on their left forepaw after stroke. The ability of mice to successfully reach for pellets (D) was only impaired for 1 week after stroke compared with sham-operated mice. **P<0.01, ***P<0.001 compared with sham-treated controls. An n=10 per group.
Figure 4
Figure 4
Repeat optical intrinsic signaling (OIS) imaging in sham and stroke animals. Ratiometric images reveal the area of activation (enclosed by a white border) after stimulation of either right forepaw (FP) (A) or hindpaw (HP) (B). In panels A and B odd numbers are from control animals, whereas even numbers are from stroke animals: 1 and 2, prestroke; 3 and 5, 7 days after; 5 and 6, 14 days after; 7 and 8, 28 days after; and 9 and 10, 56 days afterstroke. Panels c and d show the normalized area of activation (% prestroke area) for FP and HP, respectively. Repeat imaging of the same animals over time shows a partial regain of the total area of activation for both FP and less so for HP that takes weeks to evolve. Sham animals are represented by the gray shading, whereas stroke animals are represented by the black shading. ***P<0.001 compared with both sham-operated controls and prestroke measures; #P<0.05, ##P<0.01 compared with 7 days after stroke. An n=5 per group.
Figure 5
Figure 5
Activation kinetics for optical intrinsic signaling (OIS) imaging. (A–C) Representative images from an animal measured at baseline 7 days before surgery (Day −7, A), and from a sham and a stroke animal 56 days after surgery (Day 56, B and C, respectively). In the top panel are ΔR/R images, and below are the same images that have been filtered and thesholded. (D) An average plot of the pixel values of the ΔR/R images from the same experiments from five sham animals. (E) An average plot of the pixel values of the ΔR/R images from the same experiments from five stroked animals. The traces in both panels D and E are from baseline measurements taken 7 days before surgery (Day −7) and from 56 days after surgery (Day 56). These data show that, even though diffuse, OIS maps after stroke show significant changes in sensory-evoked hemodynamic activity.
Figure 6
Figure 6
Pattern of cortical connections in sham and stroke animals. The pattern of biotinylated dextran amine (BDA)-labeled projections (A, B) was assessed 8 weeks after stroke in sham and stroke mice. A significant increase in sprouting is observed after stroke compared with sham-operated controls (P<0.05, n=4 to 5 per group). In polar plots of these connections, shaded polygons (B) represent the 70th percentile of the distances of labeled projections from the injection site in each segment of the graph; weighted polar vectors (B) represent the normalized distribution of the quantity of axonal connections in a given segment of the graph for stroke (light blue), or sham (red). Sensory-evoked optical intrinsic signaling (OIS) maps for forepaw (D) have been registered to sprouting/neuroanatomic maps (C) from data collected 8 weeks after stroke. Panel C shows axonal sprouting data (black=stroke; light gray=sham; dark gray=overlap), in the equivalent coordinates as the OIS data in panel D (red=stroke; light blue=sham; dark blue=overlap). Registered OIS maps for forepaw (FP) reveal that recovery is occurring in a region where sprouting is also occurring, highlighting a region that is most likely linked to functional/behavioral recovery. The box in panel A is the region of interest shown in panels C and D, with the asterisk in panels A, C, and D representing a point of commonality.

References

    1. Calautti C, Baron JC. Functional neuroimaging studies of motor recovery after stroke in adults: a review. Stroke. 2003;34:1553–1566. - PubMed
    1. Dobkin BH. Training and exercise to drive poststroke recovery. Nat Clin Pract Neurol. 2008;4:76–85. - PMC - PubMed
    1. Cramer SC. Repairing the human brain after stroke: I. Mechanisms of spontaneous recovery. Ann Neurol. 2008;63:272–287. - PubMed
    1. Dancause N, Barbay S, Frost SB, Plautz EJ, Chen D, Zoubina EV, et al. Extensive cortical rewiring after brain injury. J Neurosci. 2005;25:10167–10179. - PMC - PubMed
    1. Brown CE, Aminoltejari K, Erb H, Winship IR, Murphy TH. In vivo voltage-sensitive dye imaging in adult mice reveals that somatosensory maps lost to stroke are replaced over weeks by new structural and functional circuits with prolonged modes of activation within both the peri-infarct zone and distant sites. J Neurosci. 2009;29:1719–1734. - PMC - PubMed

Publication types

LinkOut - more resources