Comparative Study
. 2013 Feb;69(Pt 2):284-97.
doi: 10.1107/S0907444912046008. Epub 2013 Jan 19.

Localization and orientation of heavy-atom cluster compounds in protein crystals using molecular replacement

Affiliations
Comparative Study

Localization and orientation of heavy-atom cluster compounds in protein crystals using molecular replacement

Sven O Dahms et al. Acta Crystallogr D Biol Crystallogr. 2013 Feb.

Abstract

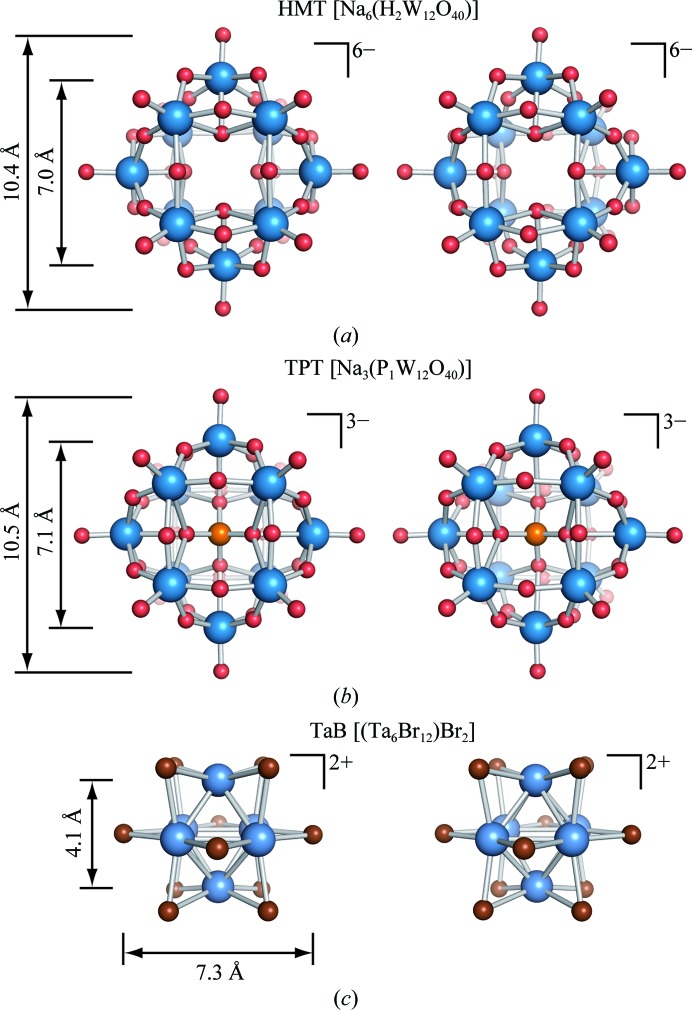
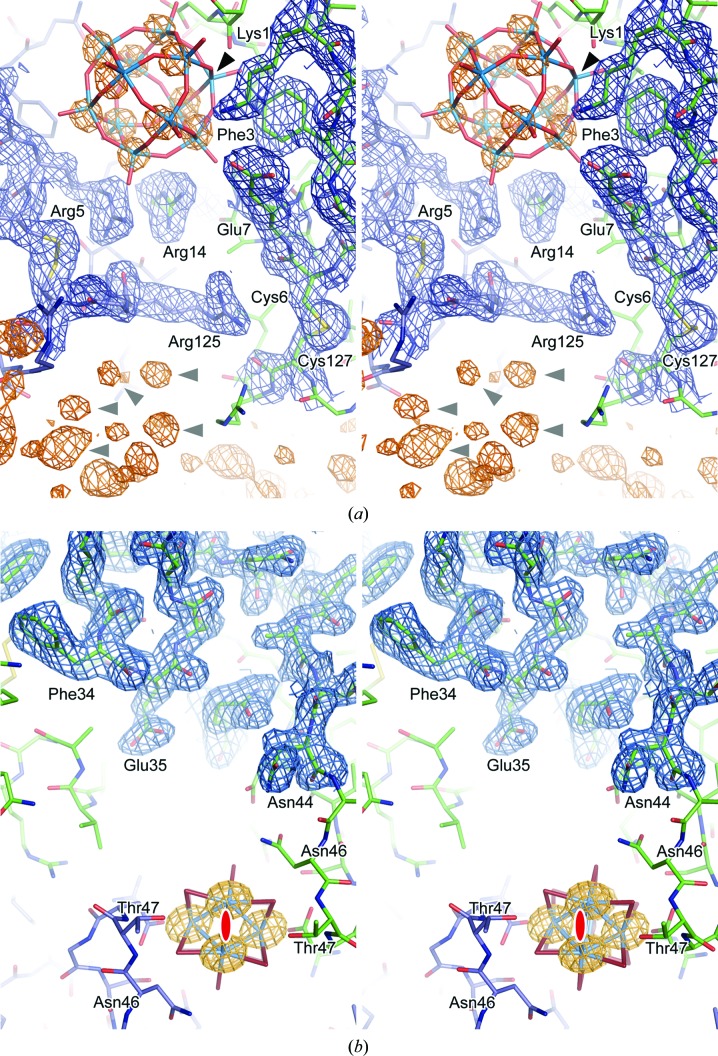
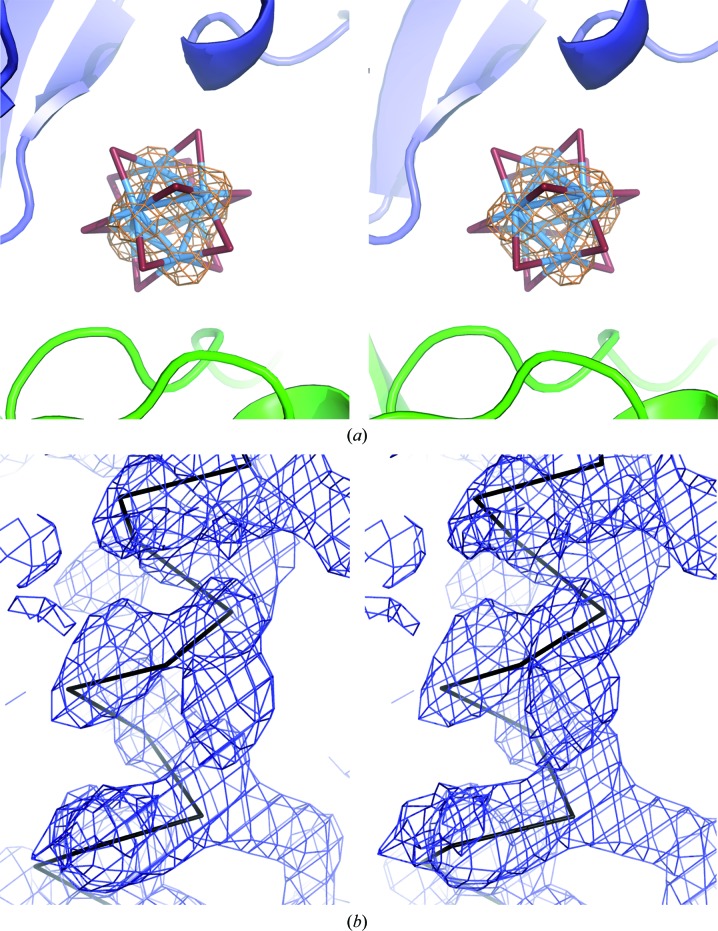
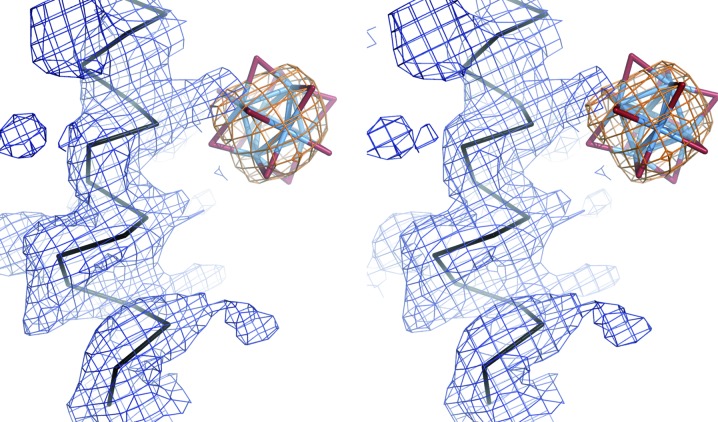
Heavy-atom clusters (HA clusters) containing a large number of specifically arranged electron-dense scatterers are especially useful for experimental phase determination of large complex structures, weakly diffracting crystals or structures with large unit cells. Often, the determination of the exact orientation of the HA cluster and hence of the individual heavy-atom positions proves to be the critical step in successful phasing and subsequent structure solution. Here, it is demonstrated that molecular replacement (MR) with either anomalous or isomorphous differences is a useful strategy for the correct placement of HA cluster compounds. The polyoxometallate cluster hexasodium α-metatungstate (HMT) was applied in phasing the structure of death receptor 6. Even though the HA cluster is bound in alternate partially occupied orientations and is located at a special position, its correct localization and orientation could be determined at resolutions as low as 4.9 Å. The broad applicability of this approach was demonstrated for five different derivative crystals that included the compounds tantalum tetradecabromide and trisodium phosphotungstate in addition to HMT. The correct placement of the HA cluster depends on the length of the intramolecular vectors chosen for MR, such that both a larger cluster size and the optimal choice of the wavelength used for anomalous data collection strongly affect the outcome.

Keywords: death receptor 6; experimental phasing; heavy-metal cluster; hexasodium α-metatungstate; molecular replacement.


Figures

Figure 1
Figure 1
Structural comparison of the HA cluster compounds used in this study. The HA clusters are shown as stereo ball-and-stick representations. (a) Hexasodium α-metatungstate (HMT). (b) Trisodium phosphotungstate (TPT). In these tungstate clusters, large blue spheres represent tungsten, medium-sized orange spheres represent phosphorus and small red spheres represent oxygen. (c) Hexatantalum tetradecabromide (TaB): large blue spheres represent tantalum, medium-sized brown spheres represent bromine.
Figure 2
Figure 2
Comparison of the phase quality obtained for the HMT-derivative DR6 crystals. The cosine of the phase error between the experimental protein phases and the final model phases is shown as function of the resolution (see §2 for details). Filled triangles represent phases calculated by spherical averaging in SHARP (SPHCLUSTER option), whereas open symbols represent phases calculated from the individual tungsten positions of the MR searches calculated at 2.9 Å resolution (squares) and 4.4 Å resolution (circles). The resolution limits refer to the data used for the heavy-atom cluster orientation by MR; the final phases were always calculated up to the resolution maximum of the data sets (Table 1 ▶). Phases calculated from the respective heavy-atom models are connected by solid lines; phases after density modification are connected by broken lines. (a) Comparison of phases determined in a three-wavelength MAD experiment. (b) Comparison of phases determined by a SIRAS experiment.
Figure 3
Figure 3
Comparison of experimental electron-density maps calculated for HMT-derivative DR6 crystals. The electron-density maps (contoured at 1σ) were calculated from experimental phases (MAD experiment at 2.9 Å resolution or SIRAS experiment at 3.3 Å resolution) after solvent flattening and are shown in comparison with the 2F oF c difference Fourier map calculated from the final protein model (stick representation). The experimental phases were either derived from the individual tungsten positions of the MR solution at 2.9 Å resolution (MAD) or at 3.4 Å resolution (SIRAS) or by spherical averaging in SHARP (SPHCLUSTER option) at 2.9 Å resolution (MAD) or at 3.4 Å resolution (SIRAS). The map correlation coefficient (CC) is given in comparison to the respective 2F oF c map for each experimental electron-density map.
Figure 4
Figure 4
HMT is bound at a special position in multiple occupied states in DR6 derivative crystals. (a, b) Stereo representations of the anomalous difference Fourier map (calculated with phases from the final DR6 model and anomalous differences from the W peak data set; contoured at 5σ) together with a ball-and-stick representation of the HMT cluster (large spheres represent the W atoms). The two symmetry-related HA cluster molecules are shown in dark grey and light grey. (a) A view along the crystallographic twofold symmetry axis (marked in red) and (b) a view perpendicular to it. (c) Two symmetry-related DR6 molecules are shown as a surface representation (coloured according to their calculated electrostatic potential) together with the bound HMT cluster molecules (yellow). Light and dark colours distinguish between the symmetry-related DR6 protomers. The location of the twofold symmetry axis is indicated in red.
Figure 5
Figure 5
Derivative crystals of hexagonal HEWL with TPT and TaB. A stereo representation of a section of the solvent-flattened experimental electron-density map is shown calculated from SAD phases (blue mesh, contoured at 1σ) together with the anomalous difference Fourier map of tungsten and tantalum (orange mesh contoured at 5σ) for (a) HEWL–TPT (1.9 Å resolution) and (b) HEWL–TaB (1.9 Å resolution), respectively. HEWL is shown in stick representation; blue and purple C atoms mark two symmetry-related molecules. (a) TPT oriented by MR is shown in stick representation with light blue W and red O atoms. Owing to degradation, only 11 W atoms reside within the heavy-atom cluster, whereas additional peaks were found in the anomalous Fourier map. Black and grey arrowheads mark the positions of the missing and additional W atoms, respectively. (b) The TaB cluster at binding site 1 was found by MR at 1.8 Å resolution and is shown in stick representation. The twofold crystallographic symmetry axis is marked in red.
Figure 6
Figure 6
TaB-derivative crystals of StyA1. Stereo representations of (a) the anomalous difference Fourier map of tantalum (orange mesh, contoured at 5σ; 2.4 Å resolution) at the TaB cluster binding site 1 (in stick representation) together with two adjacent protein molecules in ribbon representation and (b) the experimental electron-density map after solvent flattening and twofold NCS averaging calculated from SAD phases (blue mesh, contoured at 1σ; 2.4 Å resolution) together with the Cα trace of the final model in black are shown.
Figure 7
Figure 7
TaB-derivative crystals of MUAE. A stereo representation of a section of the experimental electron-density map is shown after phase extension to 2.8 Å resolution, solvent flattening and threefold NCS averaging calculated from SAD phases (blue mesh, contoured at 1σ) together with the anomalous difference Fourier map of tungsten (orange mesh, contoured at 5σ). The Cα trace of the final model (PDB entry 1z7l) is shown as ribbon representation (black). The TaB cluster at binding site 1 was found by MR at 3.3 Å resolution and is shown in stick representation.

References

    1. Abrahams, J. P. & Leslie, A. G. W. (1996). Acta Cryst. D52, 30–42. - PubMed
    1. Adams, P. D., Afonine, P. V., Grosse-Kunstleve, R. W., Read, R. J., Richardson, J. S., Richardson, D. C. & Terwilliger, T. C. (2009). Curr. Opin. Struct. Biol. 19, 566–572. - PMC - PubMed
    1. Allen, F. H. (2002). Acta Cryst. B58, 380–388. - PubMed
    1. Anderson, D. H., Weiss, M. S. & Eisenberg, D. (1996). Acta Cryst. D52, 469–480. - PubMed
    1. Ban, N., Nissen, P., Hansen, J., Capel, M., Moore, P. B. & Steitz, T. A. (1999). Nature (London), 400, 841–847. - PubMed

Publication types