. 2013:9:643.
doi: 10.1038/msb.2012.76.

Evolutionary potential, cross-stress behavior and the genetic basis of acquired stress resistance in Escherichia coli

Affiliations

Evolutionary potential, cross-stress behavior and the genetic basis of acquired stress resistance in Escherichia coli

Martin Dragosits et al. Mol Syst Biol. 2013.

Abstract

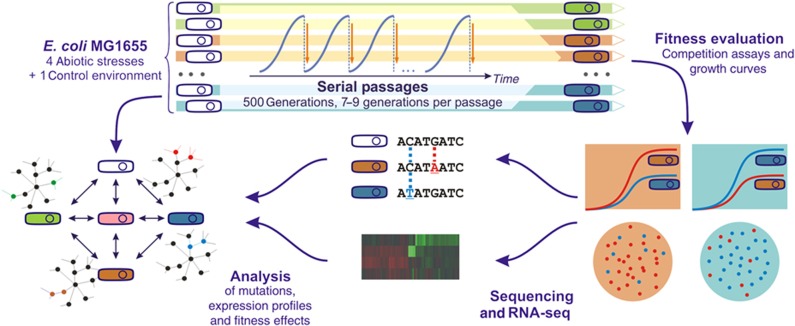
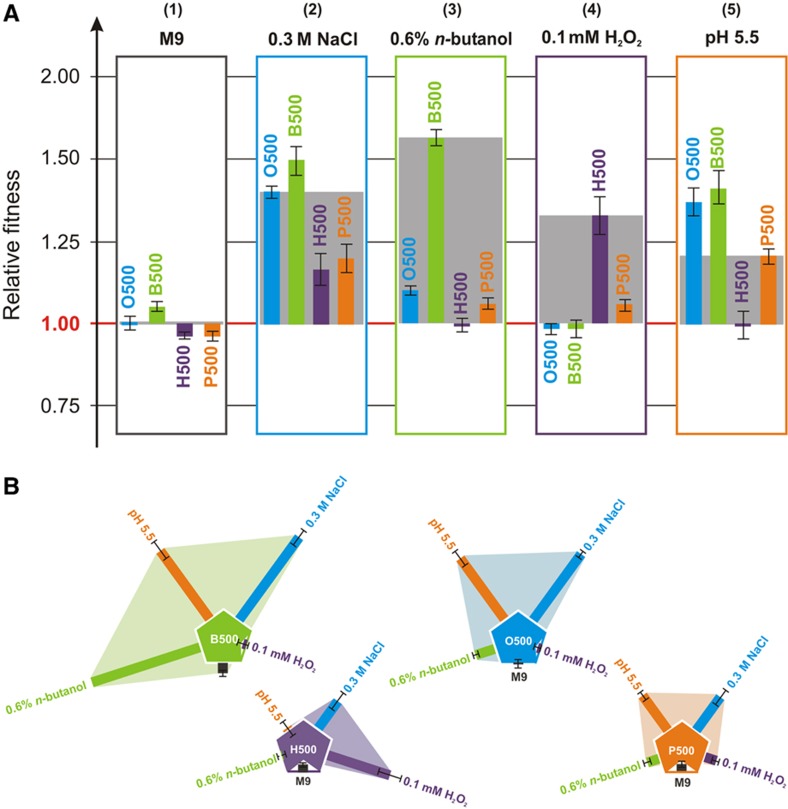
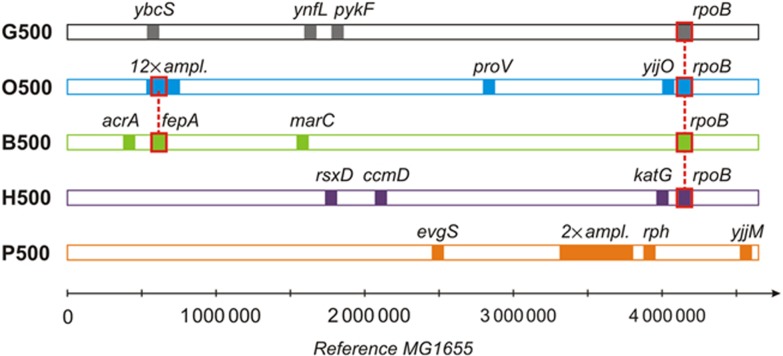
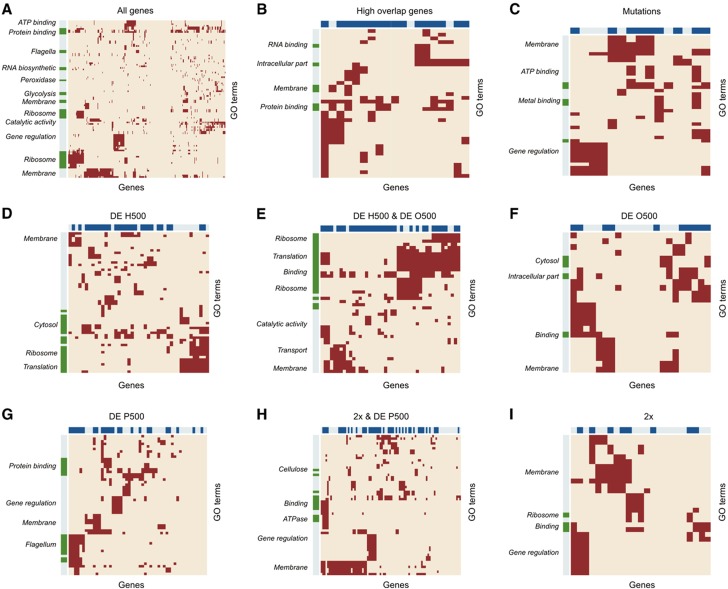
Bacterial populations have a remarkable capacity to cope with extreme environmental fluctuations in their natural environments. In certain cases, adaptation to one stressful environment provides a fitness advantage when cells are exposed to a second stressor, a phenomenon that has been coined as cross-stress protection. A tantalizing question in bacterial physiology is how the cross-stress behavior emerges during evolutionary adaptation and what the genetic basis of acquired stress resistance is. To address these questions, we evolved Escherichia coli cells over 500 generations in five environments that include four abiotic stressors. Through growth profiling and competition assays, we identified several cases of positive and negative cross-stress behavior that span all strain-stress combinations. Resequencing the genomes of the evolved strains resulted in the identification of several mutations and gene amplifications, whose fitness effect was further assessed by mutation reversal and competition assays. Transcriptional profiling of all strains under a specific stress, NaCl-induced osmotic stress, and integration with resequencing data further elucidated the regulatory responses and genes that are involved in this phenomenon. Our results suggest that cross-stress dependencies are ubiquitous, highly interconnected, and can emerge within short timeframes. The high adaptive potential that we observed argues that bacterial populations occupy a genotypic space that enables a high phenotypic plasticity during adaptation in fluctuating environments.


Conflict of interest statement

The authors declare no conflict of interest.

Figures

Figure 1
Figure 1
Overview of the experimental setting. E. coli MG1655 cell lines were evolved for 500 generations in five environments with minimal M9 salt media and glucose as the sole carbon source. These environments included four abiotic stresses (acidic, osmotic, oxidative, and n-butanol stress) and a control medium-only environment. The relative fitness of all evolved strains was measured under all stresses by competition assays and growth curves. Selected clones from adapted populations were sequenced and transcriptional profiles were obtained by RNA-Seq. Individual mutations from the resequenced clones where associated to phenotypic fitness by mutation reversals and competition assays. Identified mutations, expression data and relative fitness of the evolved strains under various stressors were analyzed in a system-level approach.
Figure 2
Figure 2
Relative fitness of the evolved populations under all environmental conditions. The relative fitness of populations evolved in all five environments was assessed through competition assays. Fitness refers to Darwinian fitness as measured through competition assays relative to the medium-only adapted population (G500). (A) Environment-based representation: (1) In the absence of other stressors, all populations showed small differences in fitness; (2) all populations where significantly more protected in osmotic stress in comparison to the G500 population; (3–4) while the B500 and O500 populations have high fitness under n-butanol stress, they showed a small evolutionary trade-off under oxidative stress; (5) Interestingly, O500 and B500 populations outcompeted P500 under acidic stress. Shaded gray areas depict the fitness difference between the strain evolved in the respective environment relative to the G500 population. (B) Population-based representation of the relative fitness data shown in (A). Shaded areas depict the degree of cross-stress protection in each respective environment. Error bars show standard error of the mean for eight independent competitions; counts for each competition were averaged over two plates in each experiment. Competition assays were obtained over 48 h of growth with one transfer (1:500 dilution) at 24 h. Supplementary Table S-V summarizes the competition assay results. Source data for this figure is available on the online supplementary information page.
Figure 3
Figure 3
Mutation map of fixed genetic changes in the evolved strains. The map of mutations identified in E. coli strains evolved for 500 generations. Coordinates are relative to the reference MG1655 genome. The seven identified mutations in the ancestral genome are not shown here (Supplementary Table S-IX).
Figure 4
Figure 4
Differentially expressed genes across all strains under osmotic stress. (A) Genes differentially expressed in the evolved strains relative to the G500 strains tested by RNA-Seq under osmotic stress conditions. Venn diagrams (upper left) depict genes differentially expressed in one of four stress-evolved strains: B500, H500, O500, and P500 relative to the G500 strain. Region highlighted with red contains 10 genes, which are simultaneously DE in at least three strains. Expression profiles are shown (middle) for a subset of genes differentially expressed in at least one of the stress-evolved strains. Venn diagrams depict the overlap between genes differentially expressed in H500 and O500 strains (upper right) and the overlap between differentially expressed and 2 × amplified genes in the P500 strain (lower right). (B) Summary of the expression levels (relative to G500) of the top DE genes and any corresponding mutations. Values represent log-fold change; genes with a DE P-value <0.05 appear in color (green/red denoting up/downregulation, respectively). Full list of DE genes with P-values is provided in Supplementary Table S-XI. Source data for this figure is available on the online supplementary information page.
Figure 5
Figure 5
Functional analysis of differentially expressed genes. (A) All genes that are differentially expressed relative to G500, amplified genes, and genes with mutations in at least one of the strains; (B) genes which are differentially expressed in at least two strains simultaneously; (C) genes with mutations; (D) genes differentially expressed only in the H500 strain; (E) genes differentially expressed in the H500 and O500 strains simultaneously; (F) genes differentially expressed only in the O500 strain; (G) not amplified genes, which are differentially expressed in the P500 strain; (H) amplified genes in P500, which are differentially expressed and (I) genes amplified in the P500 strain, but not differentially expressed. Dark red points indicate the correlation between genes and GO terms in each group. Dark green labels on the vertical sidebars show significantly overrepresented GO terms in each group, and dark blue labels on the horizontal sidebars show genes that are in the currently known gene regulatory network of E. coli (Keseler et al, 2011).
Figure 6
Figure 6
Relative fitness of B500-evolved clones relative to the reference G500 population (top) and fitness of B500 repair mutants relative to the original B500-evolved clone (bottom) under all environmental conditions. Relative fitness of strains was assessed through competition assays in all five environments (see Materials and methods). Fitness refers to Darwinian fitness (Supplementary Text) as measured through competition. Competition of E. coli MG1655 strain with added chloramphenicol resistance gene relative to E. coli MG1655 (chloramphenicol sensitive) was added as a control (gray bar). Bars represent averages of two independent competitions (shown with dots); counts for each competition were averaged over three plates in each experiment. Competition assays were obtained over 48 h of growth with one transfer (1:50 dilution) at 24 h Supplementary Table S-XII summarizes the competition assay results. Source data for this figure is available on the online supplementary information page.

Similar articles

Cited by

References

    1. Ahuja U, Thony-Meyer L (2005) CcmD is involved in complex formation between CcmC and the heme chaperone CcmE during cytochrome c maturation. J Biol Chem 280: 236–243 - PubMed
    1. Alcántara-Díaz D, Breña-Valle M, Serment-Guerrero J (2004) Divergent adaptation of Escherichia coli to cyclic ultraviolet light exposures. Mutagenesis 19: 349–354 - PubMed
    1. Andrews SC, Robinson AK, Rodriguez-Quinones F (2003) Bacterial iron homeostasis. FEMS Microbiol Rev 27: 215–237 - PubMed
    1. Araya CL, Payen C, Dunham MJ, Fields S (2010) Whole-genome sequencing of a laboratory-evolved yeast strain. BMC Genomics 11: 88. - PMC - PubMed
    1. Atsumi S, Hanai T, Liao JC (2008) Non-fermentative pathways for synthesis of branched-chain higher alcohols as biofuels. Nature 451: 86–89 - PubMed

Publication types