Comparative Study
. 2013:9:644.
doi: 10.1038/msb.2012.69.

Properties of cell death models calibrated and compared using Bayesian approaches

Affiliations
Comparative Study

Properties of cell death models calibrated and compared using Bayesian approaches

Hoda Eydgahi et al. Mol Syst Biol. 2013.

Abstract

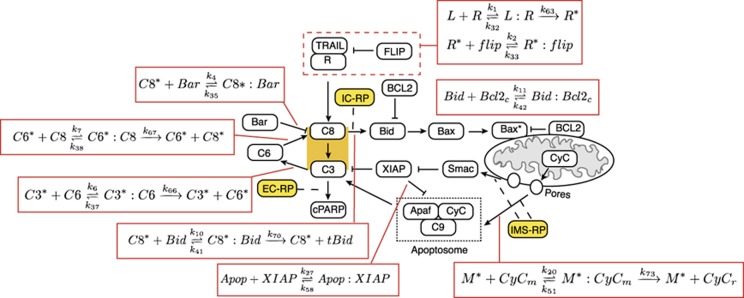
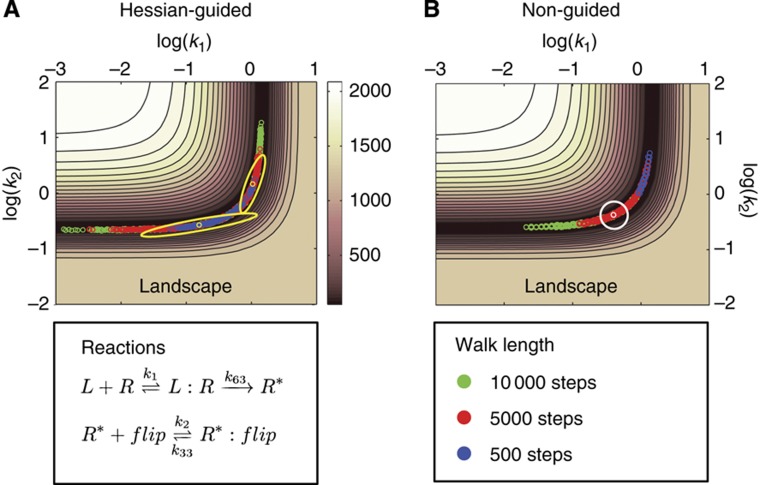
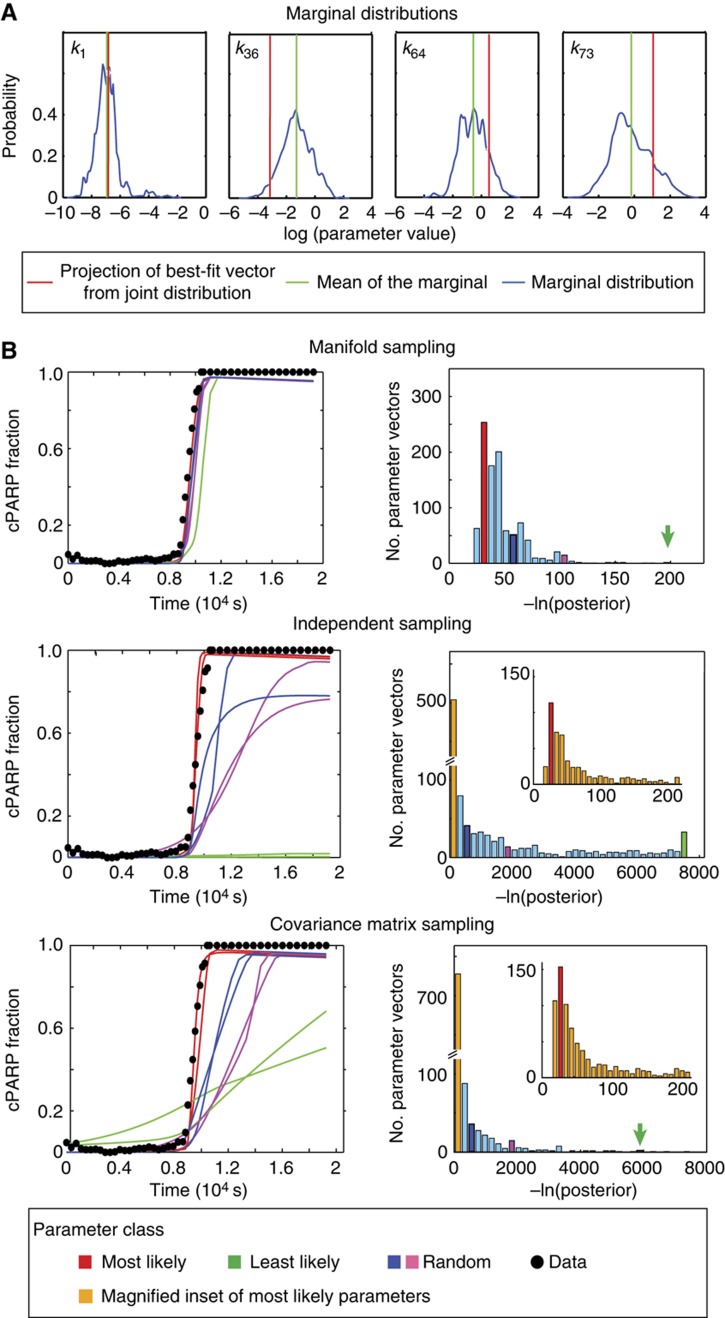
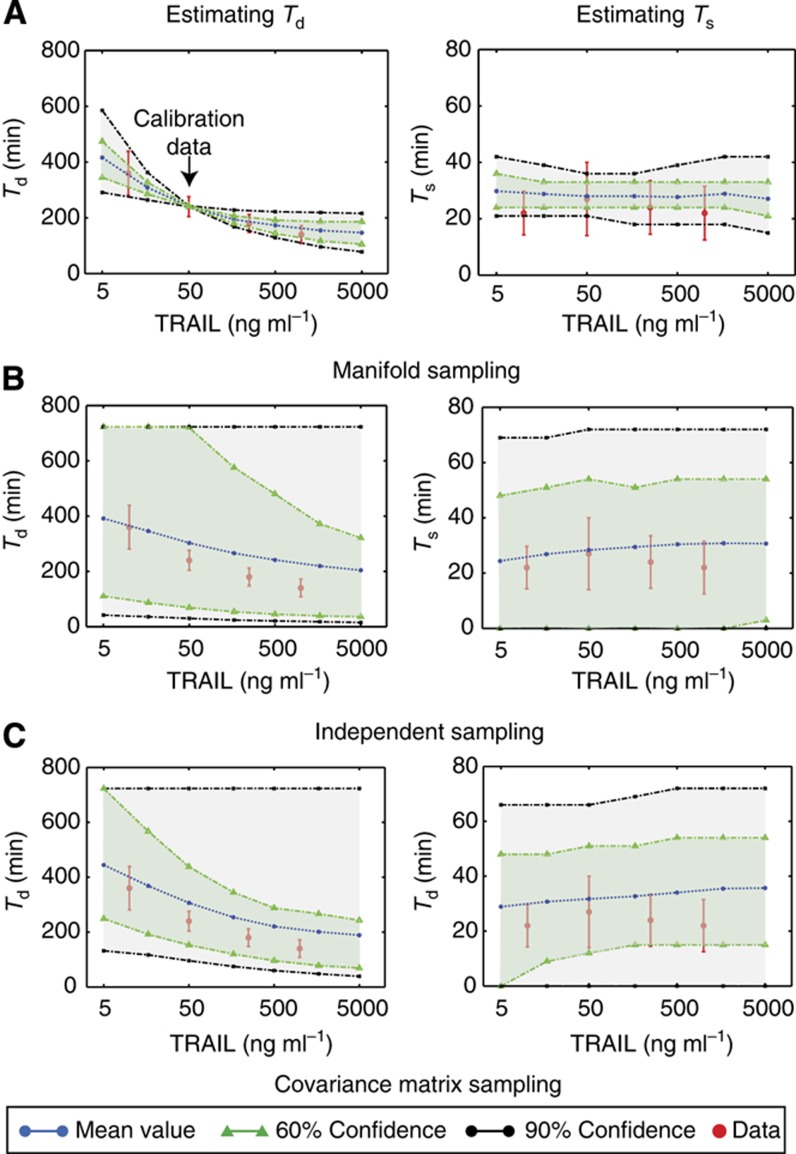
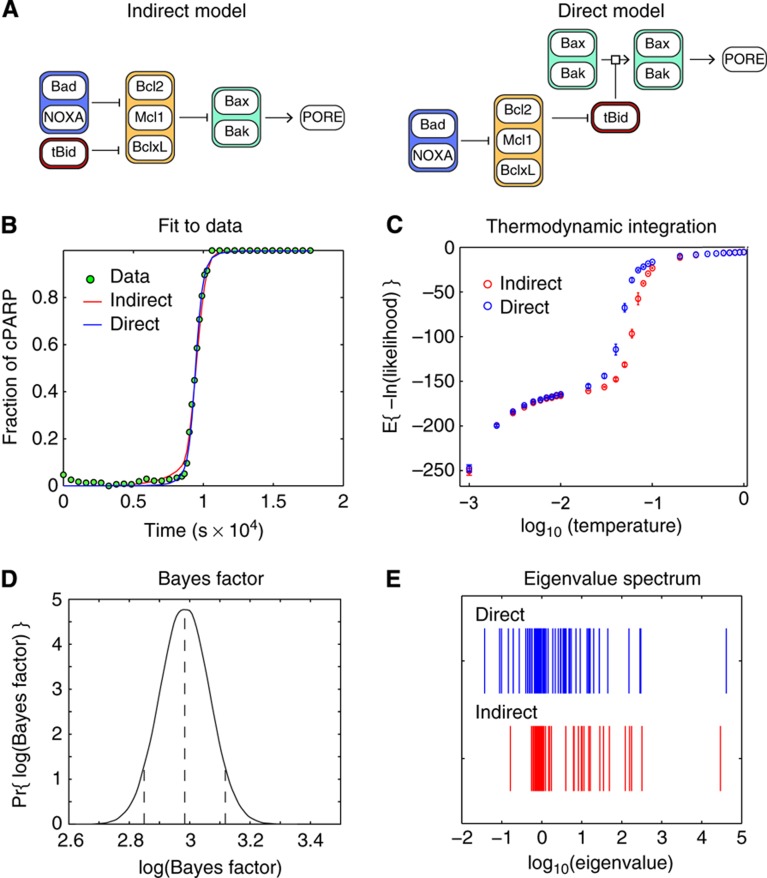
Using models to simulate and analyze biological networks requires principled approaches to parameter estimation and model discrimination. We use Bayesian and Monte Carlo methods to recover the full probability distributions of free parameters (initial protein concentrations and rate constants) for mass-action models of receptor-mediated cell death. The width of the individual parameter distributions is largely determined by non-identifiability but covariation among parameters, even those that are poorly determined, encodes essential information. Knowledge of joint parameter distributions makes it possible to compute the uncertainty of model-based predictions whereas ignoring it (e.g., by treating parameters as a simple list of values and variances) yields nonsensical predictions. Computing the Bayes factor from joint distributions yields the odds ratio (∼20-fold) for competing 'direct' and 'indirect' apoptosis models having different numbers of parameters. Our results illustrate how Bayesian approaches to model calibration and discrimination combined with single-cell data represent a generally useful and rigorous approach to discriminate between competing hypotheses in the face of parametric and topological uncertainty.


Conflict of interest statement

The authors declare that they have no conflict of interest.

Figures

Figure 1
Figure 1
Schematic representation of the extrinsic apoptosis model EARM1.3. Binding of death ligand TRAIL, formation of death-inducing signaling complex (DISC), cleavage of caspases-3, -6 and -8 (C3, C6 and C8), formation of mitochondrial pores, assembly of the apoptosome and cPARP cleavage are shown. Activating interactions such as caspase cleavage and induction of conformational changes are shown as sharp-tipped arrows; inhibitory interactions by competitive binding of proteins such as FLIP, BCL2 and XIAP are shown as flat-tipped arrows. The three fluorescent reporters IC-RP, EC-RP and IMS-RP used in experiment are denoted as yellow lozenges. Specific sets of reactions are called out in red boxes and are keyed to features discussed in subsequent figures.
Figure 2
Figure 2
Two-dimensional slices of the parameter landscape computed by numerically evaluating the ln(posterior) over a dense set of grid points on a two-dimensional space. Superimposed in green, red and blue are MCMC walks with varying step numbers and with (left) or without Hessian-guidance (right). (A) With Hessian guidance, the longer chains of 5000 and 10 000 steps (red and green, respectively) converged by the Gelman–Rubin criterion. (B) Without Hessian guidance, none of the three chains converged. The other 76 parameter values were kept constant for this analysis.
Figure 3
Figure 3
Parameter covariation is an important type of information recovered by model calibration. (A) A parameter vector drawn from the peak of the joint posterior distribution (corresponding to a best-fit parameter vector) does not always have components whose values correspond to the peaks of the corresponding marginal distributions (as illustrated for relatively identifiable parameters k1, k36, k64 and k73). In this case, the k1 component of the best-fit vector matches the mean value of the marginal distribution for k1, but this is not true of k36, k64 and k73 or in general. (B) Predicted trajectories arising from three different types of parameter sampling. In each set of panels, pink, blue and green denote representative good, fair and poor fits. Manifold sampling: left panel shows goodness-of-fit to experimental data of a few simulated EC-RP trajectories, and right panel shows the distribution of 1000 –ln(posterior) values sampled from the joint posterior distribution (right; joint sampling). Independent sampling: similar plots but for parameters sampled from independent marginal distributions ignoring covariation. The inset panel expands the distribution for the smallest values of –ln(posterior). Covariance matrix sampling: similar plots but sampling from a multivariate log-normal distribution with mean and covariance computed from the MCMC walk.
Figure 4
Figure 4
Using parameter vectors obtained by three different sampling methods to make model-based predictions of the time between ligand exposure and caspase activation (Td) or between initial and complete PARP cleavage (Ts), computed using parameter vectors sampled from (A) the joint posterior distributions obtained from the MCMC walk; (B) a multivariate log-normal distribution with mean and covariance computed from the MCMC walk; (C) independent log-normal distributions with means computed from the MCMC walk. Mean values (blue dotted line) and estimated 90% (black dotted lines, gray area) and 60% confidence intervals are shown (green dotted lines, light green area along with experimental data (red). PSRF values obtained via the Gelman–Rubin convergence test for these predicted model features ranged between 1.0001 and 1.0442 for Td and 1.0015 to 1.0343 for Ts.
Figure 5
Figure 5
Discriminating between direct and indirect models of mitochondrial outer membrane permeablization. (A) Graphical depictions of potential indirect and direct mechanisms controlling pore formation by Bax and Bak. See text for details. (B) Both EARM1.3I indirect (red) and EARM1.3D direct (blue) models exhibited an excellent fit to experimental EC-RP trajectories. Thus, the models cannot be distinguished by simple maximum likelihood criteria. For simplicity, simulations were based on a single best-fit parameter vector. (C) Thermodynamic integration curves for the direct and indirect model. (D) Exponentiation of the differential area in the two thermodynamic curves from C provides an estimate of the Bayes factor for direct and indirect models along with the uncertainty in the estimate. On the basis of the distribution of the Bayes factor estimate (reflected in the error bars in C) the direct model is preferred to the indirect by a weight of ∼20, with the 90% confidence interval spanning a range from 16 to 24. (E) Eigenvalue analysis of the landscape around the respective maximum posterior fits shows the direct model (blue) has multiple smaller eigenvalues, suggesting that it is consistent with the data over a larger volume of parameter space and therefore exhibits greater statistical weight.

References

    1. Akaike H (1974) A new look at the statistical model identification. Ieee Trans Automat Contr 19: 716–723
    1. Akaike H (1977) On Entropy Maximization Principle Amsterdam: North-Holland,
    1. Akaike H (1983) Information measures and model selection. Bull Int Stat Inst 50: 277–291
    1. Albeck JG, Burke JM, Aldridge BB, Zhang M, Lauffenburger DA, Sorger PK (2008a) Quantitative analysis of pathways controlling extrinsic apoptosis in single cells. Mol Cell 30: 11–25 - PMC - PubMed
    1. Albeck JG, Burke JM, Spencer SL, Lauffenburger DA, Sorger PK (2008b) Modeling a snap-action, variable-delay switch controlling extrinsic cell death. PLoS Biol 6: 2831–2852 - PMC - PubMed

Publication types

Substances

LinkOut - more resources