Review
. 2013 Mar;14(3):202-16.
doi: 10.1038/nrn3444. Epub 2013 Feb 6.

New insights into the classification and nomenclature of cortical GABAergic interneurons

Affiliations
Review

New insights into the classification and nomenclature of cortical GABAergic interneurons

Javier DeFelipe et al. Nat Rev Neurosci. 2013 Mar.

Abstract

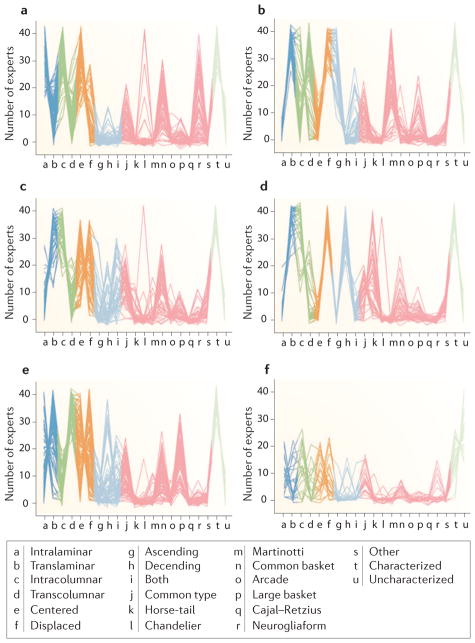
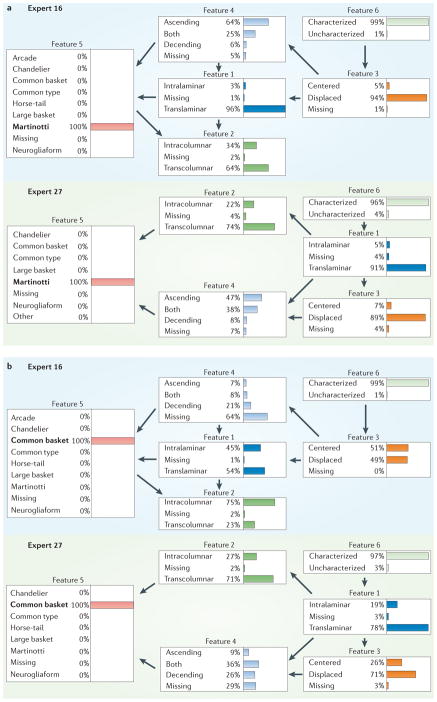
A systematic classification and accepted nomenclature of neuron types is much needed but is currently lacking. This article describes a possible taxonomical solution for classifying GABAergic interneurons of the cerebral cortex based on a novel, web-based interactive system that allows experts to classify neurons with pre-determined criteria. Using Bayesian analysis and clustering algorithms on the resulting data, we investigated the suitability of several anatomical terms and neuron names for cortical GABAergic interneurons. Moreover, we show that supervised classification models could automatically categorize interneurons in agreement with experts' assignments. These results demonstrate a practical and objective approach to the naming, characterization and classification of neurons based on community consensus.


Conflict of interest statement

Competing interests statement

The authors declare no competing financial interests.

Figures

Figure 1
Figure 1. The web-based interactive system
Screenshot of one of the 320 neurons included in the web-based interactive system. Also shown are the six axonal features and their categories (with possible values for each feature) displayed for the experts so they can select, for each feature, the category that is the most appropriate to describe the morphology of the neuron.
Figure 2
Figure 2. Schematics of the morphological features
For each feature, the experts had to select the category that best described the neuron on display. For feature 1, the categories were intralaminar (a,b) versus translaminar (c,d). For feature 2, they were intracolumnar (e,f) versus transcolumnar (g,h). For feature 3, the categories were centered (il) versus displaced (mp). For feature 4, they were ascending, descending or both. (This feature applied only when neurons were translaminar and displaced; o,p.) For feature 5 (interneuron types), the categories were arcade, common basket, large basket, Cajal–Retzius, chandelier, horse-tail, Martinotti, neurogliaform, common type (not shown) or other (not shown). When an insufficient number of morphological axonal features are visualized for a given interneuron the cell is considered anatomically uncharacterized (feature 6; not shown). Dashed horizontal lines indicate the extent of the cortical layer. Vertical grey shadows indicate the extent of the cortical column. Axonal arborization is represented by blue dots. Soma and dendritic arborization are represented as red circles and crosses, respectively. Possible variations on the relative position of the somata with respect to the axonal arborization of displaced neurons are represented by red dashed ovals.
Figure 3
Figure 3. Agreement analysis
a | Relative frequency of each category for each feature (F1 to F6): that is, the number of times a category was selected divided by the total number of ratings for the relevant feature. b | Overall observed agreement (circles) and chance-corrected Fleiss’ pi index (crosses; see Supplementary information S1) for each feature, indicating the degree of concordance between the experts. c | Chance-corrected (Fleiss’ pi index) agreement achieved in each category of each feature. Categories of the same feature are shown using lines with the same colour; for example, the categories intracolumnar and transcolumnar (which correspond to the second axonal feature) are shown with dark green bars. Interneuron types that were easily distinguished by the experts yielded high agreement (for example, the categories chandelier and Martinotti), whereas confusing categories, such as common type, common basket and large basket, yielded low chance-corrected agreement values.
Figure 4
Figure 4. Examples of inter-expert agreement and disagreement
a | Examples of neurons (neurons 3 and 272) categorized by 41 out of 42 experts as Martinotti. b | Box plots showing the agreement (quantified by Cohen’s kappa index) between pairs of experts when comparing cells categorized as Martinotti against all the other interneuron types. For example, the first blue box shows the agreement values between the expert 1 and the other 41 experts when classifying interneurons as Martinotti cells. High values of Cohen’s kappa index indicate high levels of inter-expert agreement. Apart from expert 41, the other experts yielded fairly high agreement when categorizing interneurons as Martinotti cells. The bottom and top of the blue boxes in the box plot are the lower and upper quartiles, respectively; the ends of the whiskers indicate the still considered typical values; the red crosses show outliers. c | A cluster of 44 neurons (shown from left to right) and the way they were assigned to one of the ten categories (each in different colour) of feature 5 by the experts. A vertical bar is shown for each category and each neuron, and the height of each bar indicates the number of experts who selected that category for that neuron. In the case of these 44 neurons, the neurons were classified as Martinotti by most of the experts. d | The left panel is an example of a neuron (neuron 31) that was categorized by 12 experts as common type, by 12 other experts as common basket, by 15 experts as large basket and by two experts as arcade. The right panel is another example of a neuron (neuron 274) that was categorized by 11 experts as common type, by 12 as common basket, by 14 as large basket, by one as chandelier, by one as arcade and by one as other. e | Low agreements between pairs of experts, as quantified by Cohen’s kappa index, when categorizing interneurons as common type (left), common basket (middle) and large basket (right) against all the other interneuron types. f | Examples of clusters of neurons (54, 54 and 80 neurons, respectively) that show no unique category with high bars (compared with panel c). The graphs show that, in each cluster, the neurons received a high number of votes for common type, common basket and large basket rather than mainly for one category. Thus, the categories that were selected most often — large basket (left), common basket (middle) and common type (left) — were nevertheless selected less often (shorter bars) than the category Martinotti in panel c (longer bars). Note that a high number of experts also categorized the neurons as neurogliaform or common basket (high bars in middle and right panels, respectively).
Figure 5
Figure 5. Clustering of neurons considering all features
af | Parallel coordinate diagrams of clusters of neurons obtained with the k-means algorithm (k = 6) considering all of the features at the same time. Each line represents one neuron, showing the number of experts who selected each category of every feature when classifying that neuron. For example, panel b shows a cluster in which the majority of neurons were categorized by many experts as translaminar (dark blue), transcolumnar (dark green), displaced (orange), ascending (light blue), Martinotti (pink) and characterized (light green).
Figure 6
Figure 6. Examples of Bayesian networks
Examples of Bayesian network models of the choice behaviour of two experts (expert 16 and expert 27) when selecting the categories Martinotti (a) or common basket (b) in feature 5. In a Bayesian network structure, each feature is represented with a node (box) in the graph, and an arrow from one node X to another node Y in the graph represents the probabilistic dependence of Y on X (not shown here; see Supplementary information S1 for further details). Note that the direction of an arrow between two nodes does not necessarily reveal causality or hierarchy but merely shows a probabilistic relationship between the two corresponding features. When a category is selected (for example, Martinotti as neuron type in part a), probabilistic rules are used to propagate this information and to compute the conditional probability of any other node (for example, ascending as feature 4), shown by bar charts in this figure. Thus, the blue bar in feature 4 of part a means that if expert 16 called a neuron Martinotti, there was a 64% probability that he or she would consider it ascending. Similarities and differences between experts can be identified by comparing their Bayesian networks. For instance, arrows connecting feature 4 to feature 5 appear in both Bayesian networks, showing a common relationship for experts 16 and 27. Also, the propagated conditional probabilities can be used to compare experts’ opinions. When selecting Martinotti, the propagated probabilities (shown by percentages and coloured bars) are similar in the two Bayesian networks; for example, translaminar in feature 1 has 96% probability for expert 16 and 91% probability in the panel for expert 27 (a). By contrast, the propagated probabilities when selecting common basket differ greatly; for example, there is 75% probability that expert 16 will select intracolumnar in feature 2 and 27% probability that expert 27 will select intracolumnar in feature 2 (b).

References

    1. Petilla Interneuron Nomenclature Group. Petilla Terminology: nomenclature of features of GABAergic interneurons of the cerebral cortex. Nature Rev Neurosci. 2008;9:557–568. A representative group of researchers proposed a standardized nomenclature of interneuron properties, the Petilla terminology, which has been used as a recognized reference in the recent literature. - PMC - PubMed
    1. Jackson JH. On classification and on methods of investigation (1874) In: Taylor E, editor. Selected Writings. Hodder and Stoughton; 1931.
    1. Hamilton D, Shepherd GM, Martone ME, Ascoli GA. An ontological approach to describing neurons and their relationships. Front Neuroinform. 2012;6(15) This article provides a clear introduction to the neuroinformatics infrastructure requirements of neuronal classification, with a review of the outstanding technical, scientific and social challenges for the field. - PMC - PubMed
    1. Larson SD, Martone ME. Ontologies for neuroscience: what are they and what are they good for? Front Neurosci. 2009;3:60–67. - PMC - PubMed
    1. von Kölliker A. Handbuch der Gewebelehre des Menschen. Engelmann; German: 1852.

Publication types

Substances