. 2013 Mar 22;288(12):8187-8197.
doi: 10.1074/jbc.M112.442053. Epub 2013 Feb 5.

Structure of the human angiotensin II type 1 (AT1) receptor bound to angiotensin II from multiple chemoselective photoprobe contacts reveals a unique peptide binding mode

Affiliations

Structure of the human angiotensin II type 1 (AT1) receptor bound to angiotensin II from multiple chemoselective photoprobe contacts reveals a unique peptide binding mode

Dany Fillion et al. J Biol Chem. .

Abstract

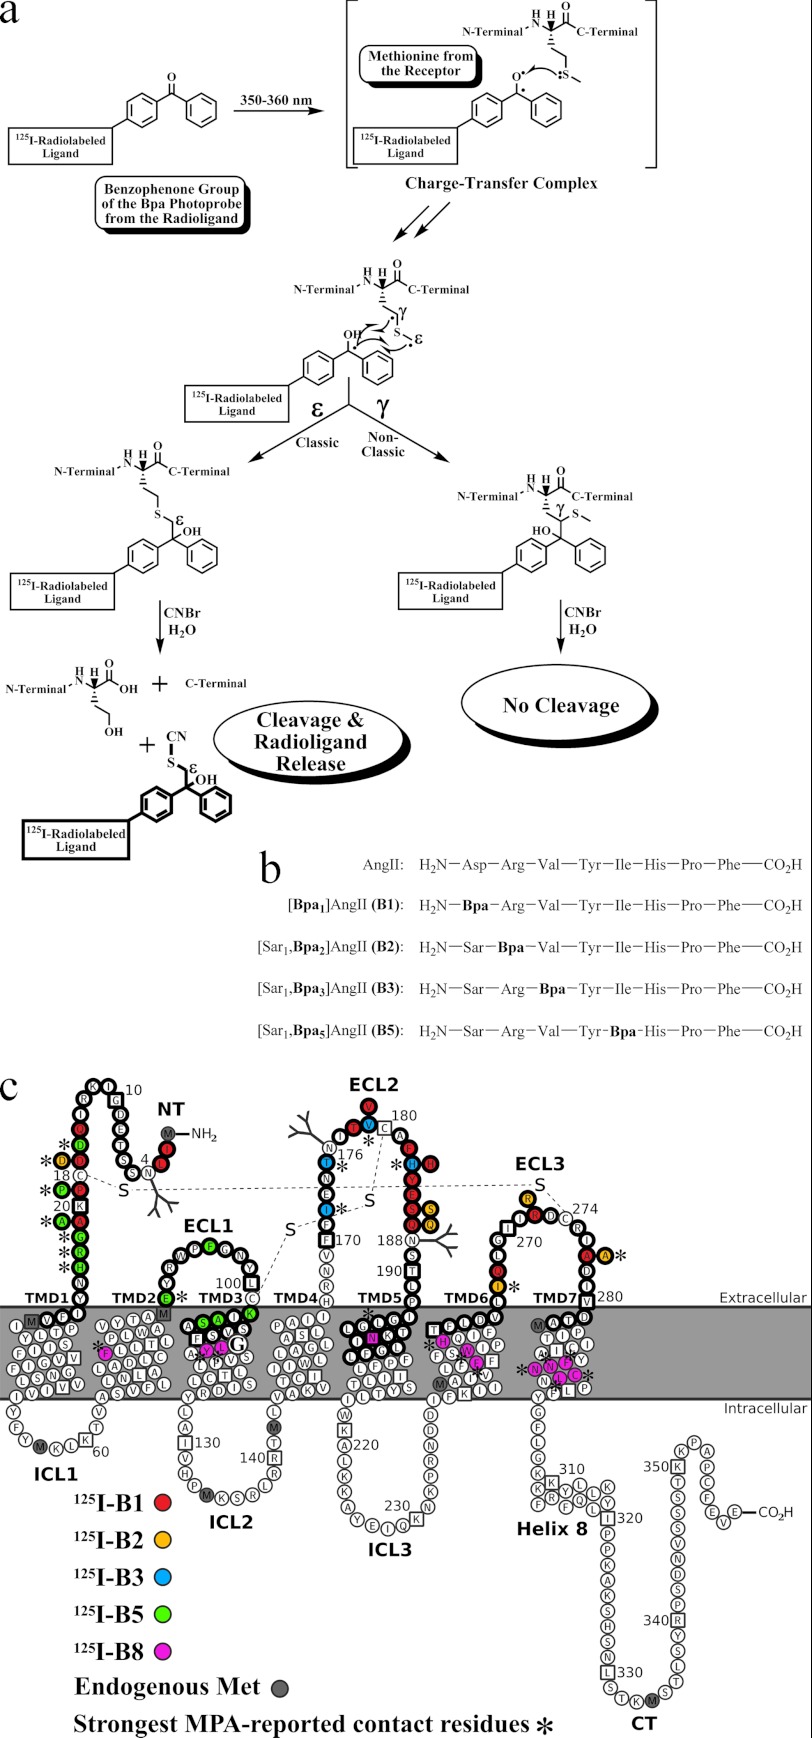
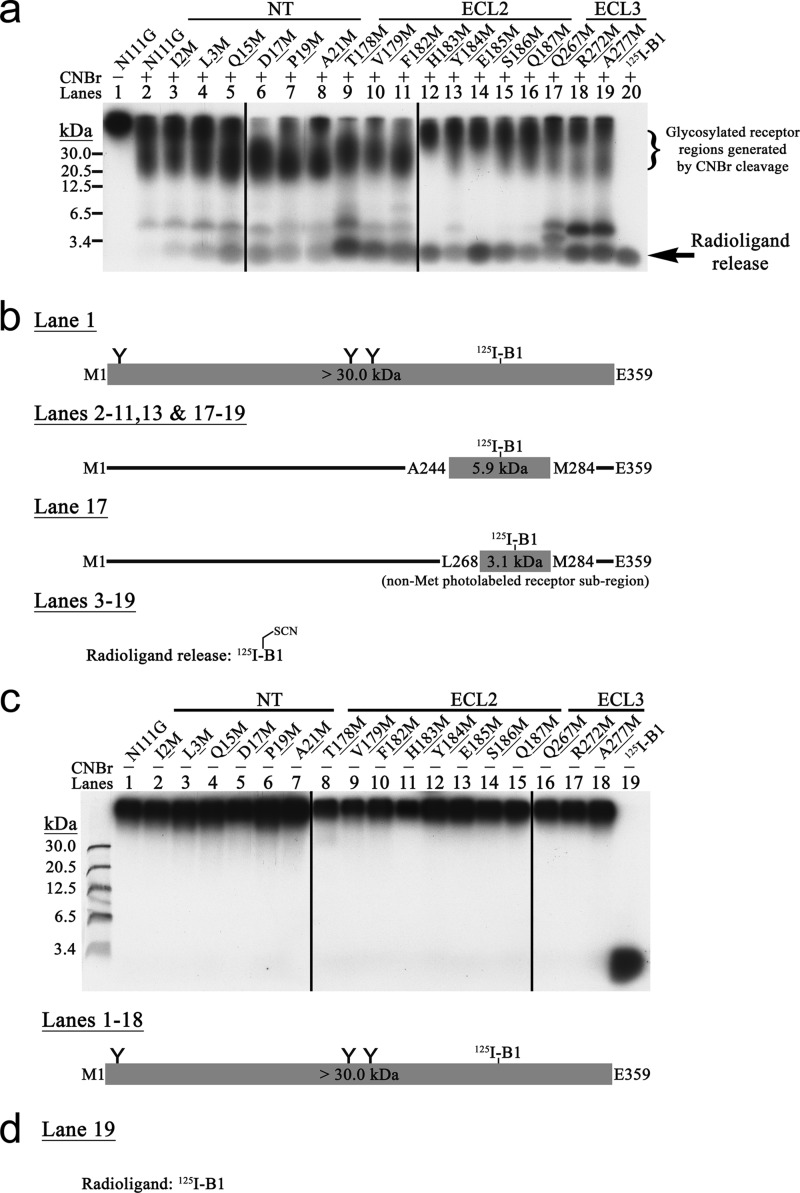
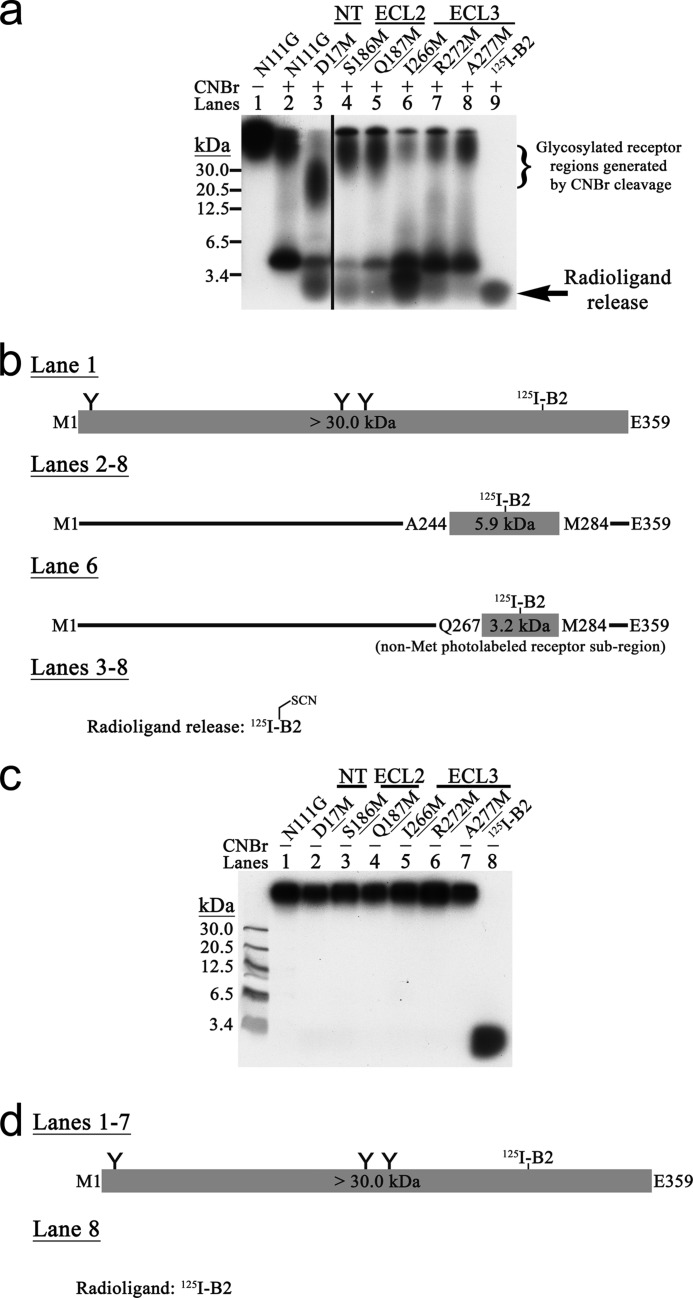
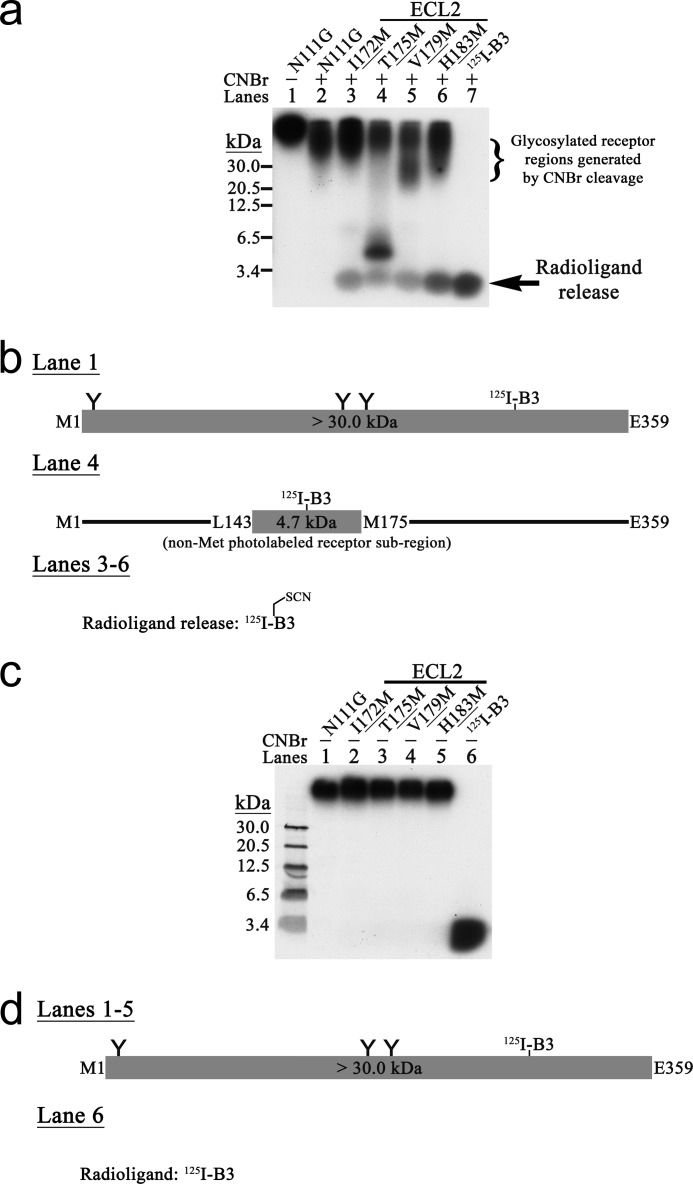
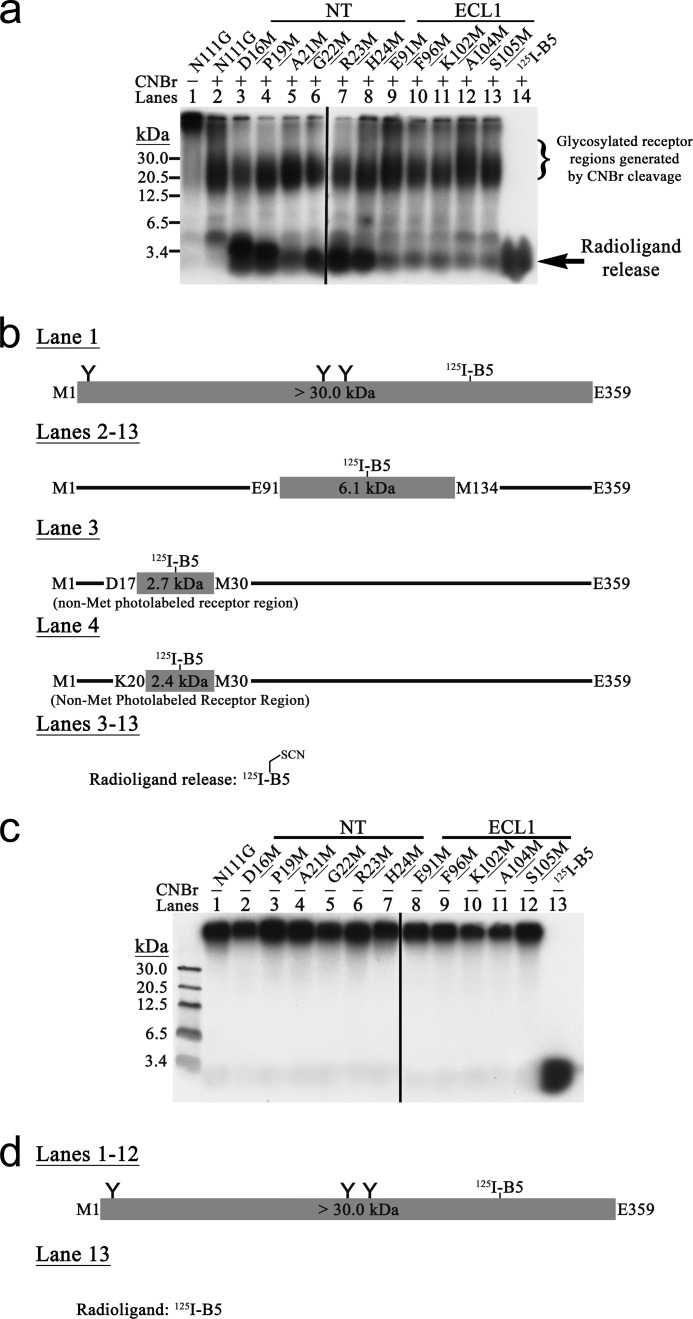
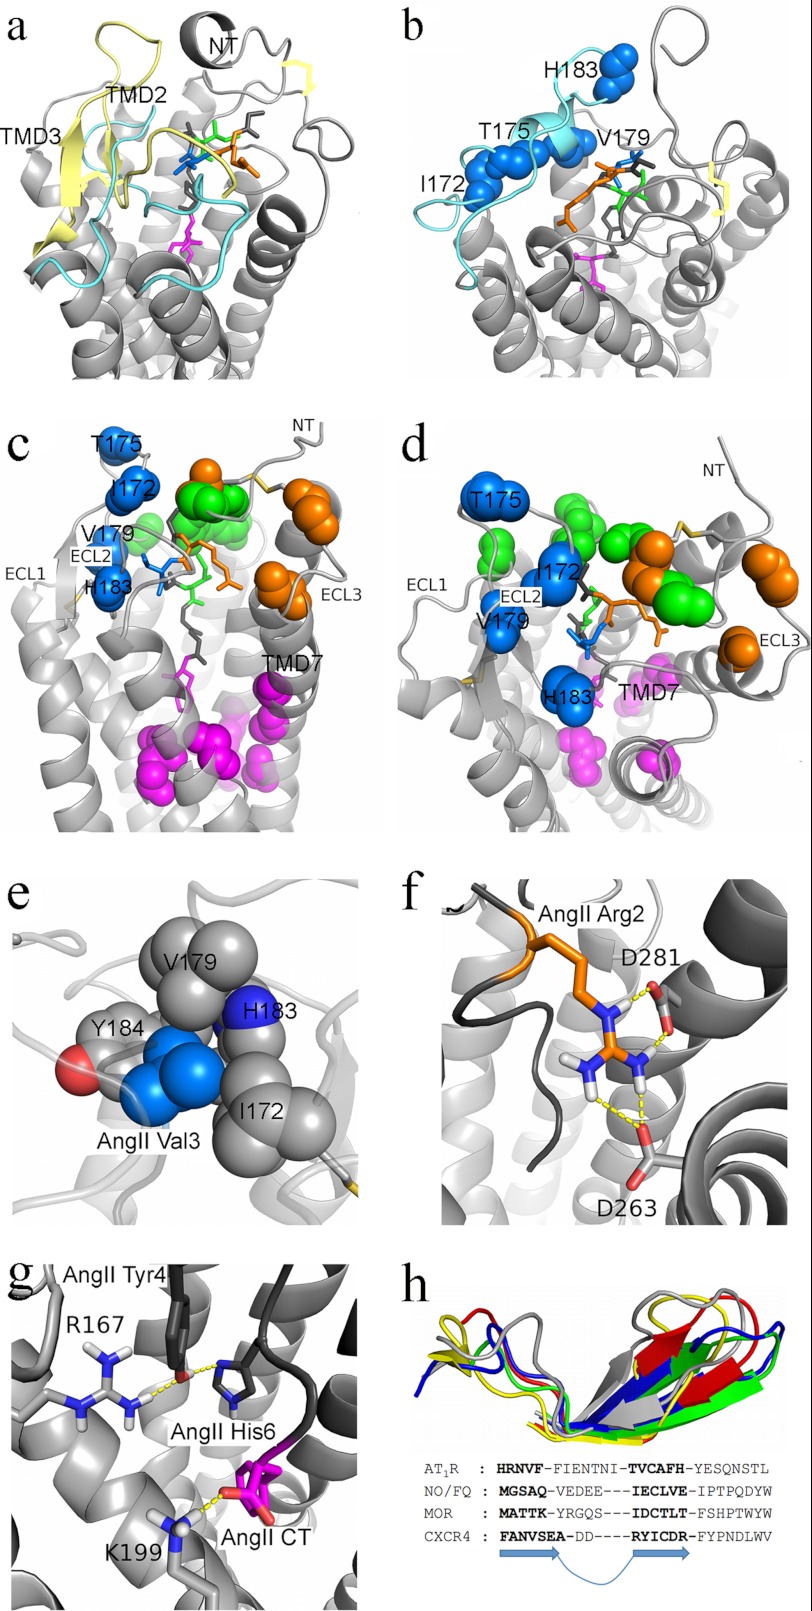
Breakthroughs in G protein-coupled receptor structure determination based on crystallography have been mainly obtained from receptors occupied in their transmembrane domain core by low molecular weight ligands, and we have only recently begun to elucidate how the extracellular surface of G protein-coupled receptors (GPCRs) allows for the binding of larger peptide molecules. In the present study, we used a unique chemoselective photoaffinity labeling strategy, the methionine proximity assay, to directly identify at physiological conditions a total of 38 discrete ligand/receptor contact residues that form the extracellular peptide-binding site of an activated GPCR, the angiotensin II type 1 receptor. This experimental data set was used in homology modeling to guide the positioning of the angiotensin II (AngII) peptide within several GPCR crystal structure templates. We found that the CXC chemokine receptor type 4 accommodated the results better than the other templates evaluated; ligand/receptor contact residues were spatially grouped into defined interaction clusters with AngII. In the resulting receptor structure, a β-hairpin fold in extracellular loop 2 in conjunction with two extracellular disulfide bridges appeared to open and shape the entrance of the ligand-binding site. The bound AngII adopted a somewhat vertical binding mode, allowing concomitant contacts across the extracellular surface and deep within the transmembrane domain core of the receptor. We propose that such a dualistic nature of GPCR interaction could be well suited for diffusible linear peptide ligands and a common feature of other peptidergic class A GPCRs.


Figures

FIGURE 1.
FIGURE 1.
a, MPA (59). Following the binding of the Bpa-substituted ligand with its target, the benzophenone group of the Bpa photoprobe is photoactivated at 350–360 nm to generate a reactive triplet biradical ketone intermediate (19). This photoactivated intermediate may then be rapidly and selectively quenched by a charge transfer complex (60) with a side chain of a Met residue within 3–6 Å (19, 59) in the target to produce a covalent bond between the ligand and the target. The electron transfer quench is more than 104-fold quicker for Met than toward other residues such as Ala for example; it results in an increased incorporation yield of the Bpa photoprobe into Met residues (61, 62). Hence, the charge transfer complex accounts for the strong photochemical selectivity to Met of the Bpa photoprobe. Direct identification of the Bpa incorporation within iteratively mutated Met residues is achieved by a highly specific CNBr-mediated proteolysis reaction (63). Depending on the Bpa regiochemistry of reaction with Met residues, the CNBr proteolysis yields two different pathways. The classical ϵ-pathway of proteolysis (64) generates receptor fragments issued from the C-terminal hydrolysis of Met and more importantly a radioligand methyl isothiocyanate derivative release issued from the hydrolysis of the Cγ–S bond of the Met side chain. This radioligand release indicates that the Bpa photoprobe of the radioligand is covalently cross-linked to the Cϵ of a Met residue in close vicinity. On the other hand, the non-classical γ-pathway of proteolysis (65) is refractory to CNBr hydrolysis at that particular photolabeled Met and thus does not produce radioligand release. In the case where no Met residue is in close vicinity of the Bpa, the photoprobe will photolabel other residues of the target structure protein, e.g. in the case of AT1R and 125I- B8, residues Phe293 and Asn294 (66). CNBr treatment of the resulting photolabeled adducts generates receptor fragments issued from C-terminal cleavage of the different endogenous Met residues without any radioligand release. Contrary to nitrene- or carbene-generating photoprobes, the Bpa presents an extremely low reactivity toward water molecules; this is particularly valuable for the study of hydrophilic receptor domains (–69). Finally, the 125I radioisotope is used for SDS-PAGE autoradiographic detection of photolabeled complexes, CNBr products of proteolysis, and radioligand release. b, primary amino acid structure of the AngII peptide and of the photoreactive analogues used in this study. The Bpa photoprobe is indicated in bold within the name and sequence of the peptide. For photoaffinity labeling, each photoreactive analogue was radiolabeled at Tyr4 with the 125I radioisotope (not illustrated). c, AT1R-N111G secondary structure and MPA-reported contact residues. Met-mutated residues are represented by bold circles, whereas MPA-identified ligand/receptor contact residues are represented in bold circles of the corresponding color that refer to the appropriate photoreactive radioanalogue. The strongest MPA-reported contact residues that compose the different extracellular clusters are indicated by *. Endogenous Met residues are represented by bold black M in gray circles and squares. The N111G mutation is indicated in TMD3 by a bigger circle and font. Squares indicate 10-residue increments. The disulfide bridges and putative N-glycosylation are also shown. CT, C terminus; ICL, intracellular loop.
FIGURE 2.
FIGURE 2.
a, MPA analysis of AT1R-N111G using 125I-B1. 125I-B1-photolabeled complexes were incubated in the absence (see lane 1 for a representative example) or presence (lanes 2–19) of CNBr and then analyzed by SDS-PAGE followed by autoradiography. These results are representative of at least three independent experiments. b, schematic CNBr fragmentation pattern of the MPA-positive Met mutant AT1R-N111G. 125I-B1-photolabeled receptor regions together with their calculated molecular masses that include the mass of 125I-B1 are represented. The three putative N-glycosylation sites are indicated by Y. All the MPA-positive Met mutant AT1Rs displayed a radioligand release band that co-migrated below the 3.4-kDa protein standard marker with the corresponding free photoreactive radioanalogue that was run in parallel. c, CNBr proteolysis specificity for the MPA-positive Met mutant AT1R-N111G. The specificity of CNBr-promoted chemical cleavage of Met residues was assessed by incubation of the various 125I-B1-photolabeled complexes under the same reaction conditions as for a but without CNBr (lanes 1–18). These results are representative of at least three independent experiments. d, schematic pattern without CNBr for the MPA-positive Met mutant AT1R-N111G. Refer to b for key. None of the 125I-B1 MPA-positive Met mutant AT1Rs in the absence of CNBr exhibited a radioligand release band of apparent molecular mass below 3.4 kDa, attesting to the CNBr-promoted proteolysis specificity.
FIGURE 3.
FIGURE 3.
a, MPA analysis of AT1R-N111G using 125I-B2. 125I-B2-photolabeled complexes were incubated in the absence (see lane 1 for a representative example) or presence (lanes 2–8) of CNBr and then analyzed by SDS-PAGE followed by autoradiography. These results are representative of at least three independent experiments. b, schematic CNBr fragmentation pattern of the MPA-positive Met mutant AT1R-N111G. 125I-B2-photolabeled receptor regions together with their calculated molecular masses that include the mass of 125I-B2 are represented. The three putative N-glycosylation sites are indicated by Y. All the MPA-positive Met mutant AT1Rs displayed a radioligand release band that co-migrated below the 3.4-kDa protein standard marker with the corresponding free photoreactive radioanalogue that was run in parallel. c, CNBr proteolysis specificity for the MPA-positive Met mutant AT1R-N111G. The specificity of CNBr-promoted chemical cleavage of Met residues was assessed by incubation of the 125I-B2-photolabeled complexes under the same reaction conditions as for a but without CNBr (lanes 1–7). These results are representative of at least three independent experiments. d, schematic pattern without CNBr for the MPA-positive Met mutant AT1R-N111G. Refer to b for key. None of the 125I-B2 MPA-positive Met mutant AT1Rs in the absence of CNBr exhibited a radioligand release band of apparent molecular mass below 3.4 kDa, attesting to the CNBr-promoted proteolysis specificity.
FIGURE 4.
FIGURE 4.
a, MPA analysis of AT1R-N111G using 125I-B3. 125I-B3-photolabeled complexes were incubated in the absence (see lane 1 for a representative example) or presence (lanes 2–6) of CNBr and then analyzed by SDS-PAGE followed by autoradiography. These results are representative of at least three independent experiments. b, schematic CNBr fragmentation pattern of the MPA-positive Met mutant AT1R-N111G. 125I-B3-photolabeled receptor regions together with their calculated molecular masses that include the mass of 125I-B3 are represented. The three putative N-glycosylation sites are indicated by Y. All the MPA-positive Met mutant AT1Rs displayed a radioligand release band that co-migrated below the 3.4-kDa protein standard marker with the corresponding free photoreactive radioanalogue that was run in parallel. c, CNBr proteolysis specificity for the MPA-positive Met mutant AT1R-N111G. The specificity of CNBr-promoted chemical cleavage of Met residues was assessed by incubation of the 125I-B3-photolabeled complexes under the same reaction conditions as for a but without CNBr (lanes 1–5). These results are representative of at least three independent experiments. d, schematic pattern without CNBr for the MPA-positive Met mutant AT1R-N111G. Refer to b for key. None of the 125I-B3 MPA-positive Met mutant AT1Rs in the absence of CNBr exhibited a radioligand release band of apparent molecular mass below 3.4 kDa, attesting to the CNBr-promoted proteolysis specificity.
FIGURE 5.
FIGURE 5.
a, MPA analysis of AT1R-N111G using 125I-B5. 125I-B5-photolabeled complexes were incubated in the absence (see lane 1 for a representative example) or presence (lanes 2–13) of CNBr and then analyzed by SDS-PAGE followed by autoradiography. These results are representative of at least three independent experiments. b, schematic CNBr fragmentation pattern of the MPA-positive Met mutant AT1R-N111G. 125I-B5-photolabeled receptor regions together with their calculated molecular masses that include the mass of 125I-B5 are represented. The three putative N-glycosylation sites are indicated by Y. All the MPA-positive Met mutant AT1Rs displayed a radioligand release band that co-migrated below the 3.4-kDa protein standard marker with the corresponding free photoreactive radioanalogue that was run in parallel. c, CNBr proteolysis specificity for the MPA-positive Met mutant AT1R-N111G. The specificity of CNBr-promoted chemical cleavage of Met residues was assessed by incubation of the 125I-B5-photolabeled complexes under the same reaction conditions as for a but without CNBr (lanes 1–12). These results are representative of at least three independent experiments. d, schematic pattern without CNBr for the MPA-positive Met mutant AT1R-N111G. Refer to b for key. None of the 125I-B5 MPA-positive Met mutant AT1Rs in the absence of CNBr exhibited a radioligand release band of apparent molecular mass below 3.4 kDa, attesting to the CNBr-promoted proteolysis specificity.
FIGURE 6.
FIGURE 6.
Rhodopsin- (a) and β2-adrenergic receptor-based (b) models of AT1R are shown. The receptor backbone is shown in light gray. The disulfide bridges are shown as yellow sticks. The AngII ligand backbone is shown as gray sticks with residues 2, 3, 5, and 8 colored orange, blue, green, and magenta, respectively. The ECL2 of both the rhodopsin- and β2-adrenergic receptor-based models is shown in light blue, whereas the ECL2 from the CXCR4-based model is shown in light yellow for comparison. Backbone atoms of the MPA-reported hits of 125I-B3 are shown as blue spheres on the β2-adrenergic receptor-based model. c and d, CXCR4-based model of AT1R. The TMD view (c) shows the AngII binding mode, and the ECL view (d) shows the several clusters of interaction with AngII. Backbone atoms of the spatially clustered residues are shown in colored spheres. Cluster I and AngII position 2 are shown in orange, cluster II and AngII position 3 are shown in blue, cluster III and AngII position 5 are shown in green, and cluster IV and AngII position 8 are shown in magenta. e–g, interactions of the AT1R CXCR4-based structure with AngII. e, ECL2 residues Ile172, Val179, Ala181, His183, and Tyr184 (shown as gray spheres with nitrogen atom in dark blue and oxygen atom in red) of the AT1R form a hydrophobic interaction cluster with Val3 (shown as light blue sphere) of AngII. f, hydrogen bonding network of residue Asp281 and Asp263 with Arg2 of AngII. g, hydrogen bonding network of residue Arg167 with Tyr4 and His6 of AngII as well as of residue Lys199 with the carboxyl of Phe8 of AngII. h, structural comparison of the ECL2 from AT1R based on the CXCR4 template with that of the CXCR4 and some opioid receptors. The ECL2 of the AT1R as initially generated by the LOMETS server and after molecular dynamics simulation with AngII is shown in blue and gray, respectively. The ECL2 of the nociceptin/orphanin FQ (N/OFQ) and μ-opioid (MOR) receptors and that of CXCR4 are shown in yellow, red, and green, respectively. CT, C terminus.

References

    1. Palczewski K., Kumasaka T., Hori T., Behnke C. A., Motoshima H., Fox B. A., Le Trong I., Teller D. C., Okada T., Stenkamp R. E., Yamamoto M., Miyano M. (2000) Crystal structure of rhodopsin: a G protein-coupled receptor. Science 289, 739–745 - PubMed
    1. Haga K., Kruse A. C., Asada H., Yurugi-Kobayashi T., Shiroishi M., Zhang C., Weis W. I., Okada T., Kobilka B. K., Haga T., Kobayashi T. (2012) Structure of the human M2 muscarinic acetylcholine receptor bound to an antagonist. Nature 482, 547–551 - PMC - PubMed
    1. Shimamura T., Shiroishi M., Weyand S., Tsujimoto H., Winter G., Katritch V., Abagyan R., Cherezov V., Liu W., Han G. W., Kobayashi T., Stevens R. C., Iwata S. (2011) Structure of the human histamine H1 receptor complex with doxepin. Nature 475, 65–70 - PMC - PubMed
    1. Chien E. Y., Liu W., Zhao Q., Katritch V., Han G. W., Hanson M. A., Shi L., Newman A. H., Javitch J. A., Cherezov V., Stevens R. C. (2010) Structure of the human dopamine D3 receptor in complex with a D2/D3 selective antagonist. Science 330, 1091–1095 - PMC - PubMed
    1. Warne T., Serrano-Vega M. J., Baker J. G., Moukhametzianov R., Edwards P. C., Henderson R., Leslie A. G., Tate C. G., Schertler G. F. (2008) Structure of a β1-adrenergic G-protein-coupled receptor. Nature 454, 486–491 - PMC - PubMed

Publication types

MeSH terms

LinkOut - more resources