. 2013 Mar 29;288(13):8922-34.
doi: 10.1074/jbc.M112.446500. Epub 2013 Feb 5.

Quantitative characterization of the activation steps of mannan-binding lectin (MBL)-associated serine proteases (MASPs) points to the central role of MASP-1 in the initiation of the complement lectin pathway

Affiliations

Quantitative characterization of the activation steps of mannan-binding lectin (MBL)-associated serine proteases (MASPs) points to the central role of MASP-1 in the initiation of the complement lectin pathway

Márton Megyeri et al. J Biol Chem. .

Abstract

Mannan-binding lectin (MBL)-associated serine proteases, MASP-1 and MASP-2, have been thought to autoactivate when MBL/ficolin·MASP complexes bind to pathogens triggering the complement lectin pathway. Autoactivation of MASPs occurs in two steps: 1) zymogen autoactivation, when one proenzyme cleaves another proenzyme molecule of the same protease, and 2) autocatalytic activation, when the activated protease cleaves its own zymogen. Using recombinant catalytic fragments, we demonstrated that a stable proenzyme MASP-1 variant (R448Q) cleaved the inactive, catalytic site Ser-to-Ala variant (S646A). The autoactivation steps of MASP-1 were separately quantified using these mutants and the wild type enzyme. Analogous mutants were made for MASP-2, and rate constants of the autoactivation steps as well as the possible cross-activation steps between MASP-1 and MASP-2 were determined. Based on the rate constants, a kinetic model of lectin pathway activation was outlined. The zymogen autoactivation rate of MASP-1 is ∼3000-fold higher, and the autocatalytic activation of MASP-1 is about 140-fold faster than those of MASP-2. Moreover, both activated and proenzyme MASP-1 can effectively cleave proenzyme MASP-2. MASP-3, which does not autoactivate, is also cleaved by MASP-1 quite efficiently. The structure of the catalytic region of proenzyme MASP-1 R448Q was solved at 2.5 Å. Proenzyme MASP-1 R448Q readily cleaves synthetic substrates, and it is inhibited by a specific canonical inhibitor developed against active MASP-1, indicating that zymogen MASP-1 fluctuates between an inactive and an active-like conformation. The determined structure provides a feasible explanation for this phenomenon. In summary, autoactivation of MASP-1 is crucial for the activation of MBL/ficolin·MASP complexes, and in the proenzymic phase zymogen MASP-1 controls the process.


Figures

FIGURE 1.
FIGURE 1.
Recombinant fragments and mutants of MASP-1 and -2. A, domain structures of MASP-1 and -2 and the recombinant fragments (CCP1-CCP2-SP) designated as rMASP-1 and rMASP-1 used for this study. The disulfide bridge joining the A and B chains of the full-length protein and the short and B chains of the recombinant fragments in the active form is indicated. B, mutations introduced into rMASP-1 and -2 in order to separate and quantitatively characterize their autoactivation steps as well as the possible cross-activation steps.
FIGURE 2.
FIGURE 2.
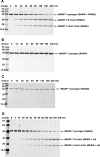
Separation of the two autoactivation steps of MASP-1. A, cleavage of rMASP-1 S646A by the R448Q variant modeling the “zymogen autoactivation” step. rMASP-1 S646A at 5.5 μm was mixed with rMASP-1 R448Q at 550 nm final concentration and incubated at 37 °C. B, as a control, rMASP-1 S646A (5.5 μm) was incubated alone. No cleavage was observed during the incubation period at 37 °C. C, rMASP-1 R448Q at 550 nm was incubated alone. No cleavage was observed during the incubation period at 37 °C. D, cleavage of rMASP-1 S646A by WT rMASP-1 modeling the “autocatalytic activation” step. rMASP-1 S646A at 1.1 μm was mixed with WT rMASP-1 at 2.2 nm final concentration and incubated at 37 °C. Samples were taken at the indicated time points, and appropriate amounts (0.5–2 μg/lane) were analyzed by SDS-PAGE under reducing conditions. Fitting is presented in supplemental Fig. S1, and the determined activation rate constants (kobs/[E]T) are listed in Table 1.
FIGURE 3.
FIGURE 3.
MASP-2 zymogen autoactivation. Cleavage of rMASP-2 S633A by the R444Q variant was used to model the “zymogen autoactivation” step of MASP-2. rMASP-2 S633A at 45 μm was mixed with rMASP-2 R444Q at 45 μm final concentration and incubated at 37 °C for 139 h. Samples were taken at the indicated time points, and appropriate amounts (about 2 μg of total protein/lane) were analyzed by SDS-PAGE under reducing conditions. Fitting is presented in supplemental Fig. S1, and the determined activation rate constant (kobs/[E]T) is shown in Table 1.
FIGURE 4.
FIGURE 4.
Examples of cross-activation between MASP-1 and-2. A, cleavage of rMASP-2 S633A by rMASP-1 R448Q modeling a possible cross-activation step, where zymogen MASP-1 cleaves zymogen MASP-2. rMASP-2 S633A at 5.7 μm was mixed with rMASP-1 R448Q at 1.1 μm final concentration and incubated at 37 °C for 7 h. B, cleavage of rMASP-1 S646A by WT rMASP-2 modeling a possible cross-activation step, where active MASP-2 cleaves zymogen MASP-1. rMASP-1 S646A at 3.2 μm was mixed with WT rMASP-2 at 100 nm final concentration and incubated at 37 °C for 150 min. Samples were taken at the indicated time points and appropriate amounts (about 2 μg of total protein/lane) were analyzed by SDS-PAGE under reducing conditions. Fitting is presented in supplemental Fig. S1, and the determined activation rate constants (kobs/[E]T) are listed in Table 1.
FIGURE 5.
FIGURE 5.
A kinetic model of lectin pathway activation. This figure graphically illustrates the kinetic rate constant obtained for the “zymogen autoactivation” and “autocatalytic activation” steps for both MASP-1 and MASP-2 as well as those of the possible “cross-activation” steps. Colored arrows point from the enzyme to the substrate. The model suggests that the autoactivation of MASP-1 is rapid, whereas the autoactivation of MASP-2 is very slow due to the extremely slow “zymogen autoactivation” step. The model also suggests that MASP-2 is activated primarily by MASP-1, and at the initial phase, when all enzymes are zymogens, zymogen MASP-1 plays a pivotal role in initiating the activation process.
FIGURE 6.
FIGURE 6.
Activation rMASP-3 by rMASP-1. Cleavage of WT zymogen rMASP-3 by WT (active) rMASP-1 modeling a possible cross-activation step. rMASP-3 at 2 μm was mixed with rMASP-1 at 100 nm final concentration and incubated at 37 °C for 300 min. Samples were taken at the indicated time points, and appropriate amounts (about 1.5 μg of total protein/lane) were analyzed by SDS-PAGE under reducing conditions. Fitting is presented in supplemental Fig. S1, and the determined activation rate constant (kobs/[E]T) is shown in Table 1.
FIGURE 7.
FIGURE 7.
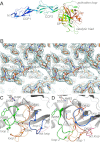
Structure of zymogen rMASP-1 (catalytic fragment). A, the structure consists of the CCP1, CCP2, and the SP domains (schematic representation, with the N and C termini, the partially disordered activation loop, and the catalytic triad labeled). B, the catalytic triad (Ser646, His490, Asp552) is in active conformation, the rotated Asp645 residue at the starting point of loop 1 is relatively accessible, and loop 2 (Trp668–Lys675 region) is in the collapsed conformation (stereo representation, with the 2FoFc electron density map contoured at the 1σ level). Comparison of loop compositions and conformations of the activation domains are shown for zymogen structures in C (MASP-1) and D (MASP-2). Loops are colored as follows. Pink, activation loop; blue, loop D; orange, loop 1; green, loop 2. The catalytic triad, the hinge points of loop 1 (Asp645/632 in MASP-1/MASP-2) and loop 2 (Trp668/655), as well as the aspartate determining the primary substrate specificity (Asp640/627) and the positively charged residue blocking the S1 pocket (Lys675/Arg630) are shown with stick representations. Balls represent further charged residues. Disordered residues are modeled and shown with dots. The loop 1 region of the activated structure is shown for reference (orange, transparent colors) with its positively charged new N terminus important for reorienting Asp645/632 as a blue cross.

References

    1. Neuenschwander P. F., Fiore M. M., Morrissey J. H. (1993) Factor VII autoactivation proceeds via interaction of distinct protease-cofactor and zymogen-cofactor complexes. Implications of a two-dimensional enzyme kinetic mechanism. J. Biol. Chem. 268, 21489–21492 - PubMed
    1. Zhuo R., Siedlecki C. A., Vogler E. A. (2006) Autoactivation of blood factor XII at hydrophilic and hydrophobic surfaces. Biomaterials 27, 4325–4332 - PubMed
    1. Thielens N. M., Illy C., Bally I. M., Arlaud G. J. (1994) Activation of human complement serine-proteinase C1r is down-regulated by a Ca2+-dependent intramolecular control that is released in the C1 complex through a signal transmitted by C1q. Biochem. J. 301, 509–516 - PMC - PubMed
    1. Kardos J., Harmat V., Palló A., Barabás O., Szilágyi K., Gráf L., Náray-Szabó G., Goto Y., Závodszky P., Gál P. (2008) Revisiting the mechanism of the autoactivation of the complement protease C1r in the C1 complex. Structure of the active catalytic region of C1r. Mol. Immunol. 45, 1752–1760 - PubMed
    1. Gál P., Barna L., Kocsis A., Závodszky P. (2007) Serine proteases of the classical and lectin pathways. Similarities and differences. Immunobiology 212, 267–277 - PubMed

Publication types

MeSH terms