Meta-Analysis
. 2013:3:1215.
doi: 10.1038/srep01215. Epub 2013 Feb 5.

Robust shifts in S100a9 expression with aging: a novel mechanism for chronic inflammation

Affiliations
Meta-Analysis

Robust shifts in S100a9 expression with aging: a novel mechanism for chronic inflammation

William R Swindell et al. Sci Rep. 2013.

Abstract

The S100a8 and S100a9 genes encode a pro-inflammatory protein (calgranulin) that has been implicated in multiple diseases. However, involvement of S100a8/a9 in the basic mechanisms of intrinsic aging has not been established. In this study, we show that shifts in the abundance of S100a8 and S100a9 mRNA are a robust feature of aging in mammalian tissues, involving a range of cell types including the central nervous system. To identify transcription factors that control S100a9 expression, we performed a large-scale transcriptome analysis of 62 mouse and human cell types. We identified cell type-specific trends, as well as robust associations linking S100a9 coexpression to elevated frequency of ETS family motifs, and in particular, to motifs recognized by the transcription factor SPI/PU.1. Sparse occurrence of SATB1 motifs was also a strong predictor of S100a9 coexpression. These findings offer support for a novel mechanism by which a SPI1/PU.1-S100a9 axis sustains chronic inflammation during aging.


Figures

Figure 1
Figure 1. Shifts in the expression of S100a8 and S100a9 are a robust feature of aging in human and mouse tissues (meta-analysis of microarray data).
The effects of aging on the expression of S100-encoding mRNAs were evaluated in human (left) and mouse (right) tissues. All human data was generated using the Affymetrix Human Genome U133 Plus 2.0 array platform (29 experiments), and all mouse data was generated using the Affymetrix Mouse Genome 430 2.0 array platform (34 experiments). Data were obtained from the Gene Expression Omnibus or ArrayExpress databases. Colors denote the estimated fold-change over 40 years in humans (left; old/young) or over 2 years in mice (right; old/young). Triangles denote significant effects of aging on the expression of the listed gene (row) with respect to the indicated tissue (column) (P < 0.05 or FDR < 0.05).
Figure 2
Figure 2. In silico strategy for identifying cis-regulatory mechanisms controlling S100a9 expression.
The figure illustrates a general procedure for identifying a cluster of S100a9-coexpressed genes (parts A – C), which can then be evaluated to identify TF binding sites that occur at disproportionately high frequency within associated genomic sequences (part D). The procedure is here illustrated for a single cell type (mouse chondrocytes), but we have applied the methodology across a broader panel of 30 mouse and 32 human cell types. In the first step (A), a foreground set of S100a9-coexpressed transcripts is identified. This is done by calculating the Spearman rank correlation (rs) between each transcript and S100a9, and then ranking all transcripts by the magnitude of formula image
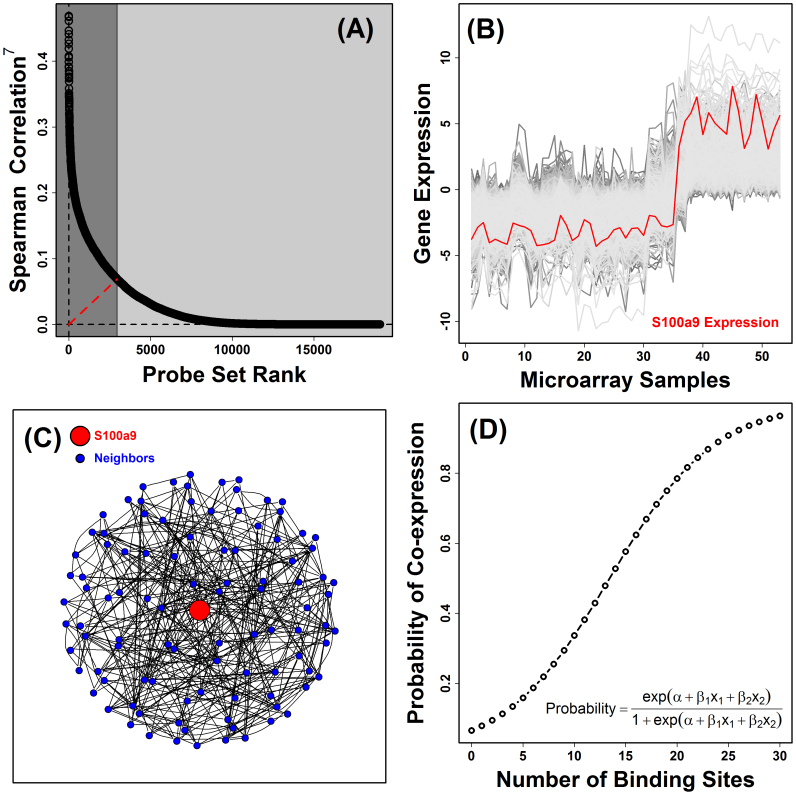
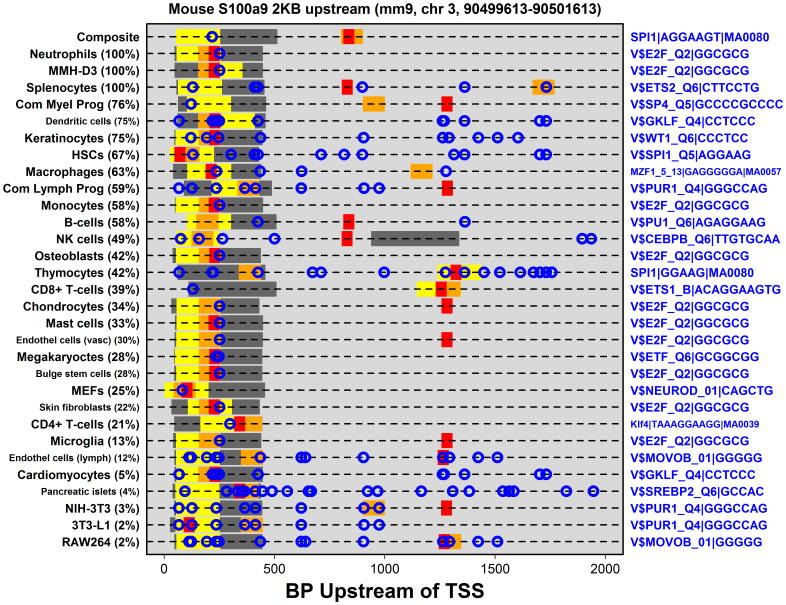
. The dashed red line shown in (A) represents the segment with minimal distance between the origin (lower left corner) and the curve shown in the figure. This red line serves to define the foreground set of S100a9-coexpressed genes (dark grey region). In part (B), this S100a9-coexpression cluster is illustrated with respect to the 53 microarray samples used to calculate Spearman rank correlations shown in (A), where each microarray sample was generated by hybridization with cDNA derived from mouse chondrocytes. The foreground set of S100a9-coexpressed genes can thus be viewed as the local sub-network that surrounds S100a9, as illustrated in (C). In the final step (D), a generalized additive logistic model (GAM) is used identify significant associations between S100a9 coexpression and the number of TF binding sites present within the 2 KB region upstream of the transcription start site (or other genomic regions). In GAM models, the probability of S100a9 coexpression is modeled (vertical axis) as a function of two variables x1 and x2, where x1 is the length of unmasked sequence scanned for a given gene and x2 is the number of TF binding sites identified in the upstream region. GAM models were fit for each of 1209 TF binding sites, and a significant association between S100a9 coexpression and binding site occurrence was evaluated based upon significance of the coefficient β2.
Figure 3
Figure 3. Top-ranked transcription factor motifs that predict S100a9 coexpression (30 mouse cell types).
Top-ranked motifs are listed in the left margin and were selected based upon three criteria. First, we identified those motifs for which an increased number of occurrences significantly increased the probability of S100a9 coexpression in the composite network (i.e., lowest p-values in composite with Z > 0; left margin labels with black font). Second, we identified those motifs for which an increased number of occurrences significantly increased the probability of S100a9 coexpression across the largest total number of cell types (i.e., largest number of up-triangles per row; left margin labels with red font). Third, for the 10 cell types that most consistently expressed S100a9 above background in microarray samples (i.e., neutrophils, …, monocytes), we identified the single motif most significantly associated with S100a9 coexpression (i.e., lowest p-value for each cell type with Z > 0; left margin labels with blue font). Positive Z statistics (red heatmap colors) indicate that increased motif occurrence within 2 KB upstream regions was associated with increased probability of S100a9 coexpression. Negative Z statistics (green heatmap colors) indicate that decreased motif occurrence 2 KB upstream was associated with increased probability of S100a9 coexpression. For each cell type (columns), the percentage shown in parentheses is the fraction of microarray samples for which S100a9 was expressed above background.
Figure 4
Figure 4. Bivariate motif combinations that best predict S100a9 coexpression in 30 mouse cell types.
For each cell type, we identified a set of TF motifs for which the number of binding sites in the region 2 KB upstream of transcription start sites was a significant predictor of S100a9 coexpression (P < 0.05). Among these motifs, all possible pairwise combinations were evaluated as predictors of S100a9 coexpression within logistic regression models. The right margin lists the best bivariate model identified for each cell type (Akaike information criterion). For motifs shown in red font, increased motif occurrence was associated with increased probability of S100a9 coexpression (Z > 0), while conversely, for motifs shown in green font, decreased motif occurrence in was associated with increased probability of S100a9 coexpression (Z < 0). 10000 cross-validation simulations were performed to assess the ability of each model to predict S100a9 coexpression. The average AUC among all simulations is plotted in the figure (filled circles), with error bars spanning ± one standard deviation. Yellow boxes for each cell type outline the range of AUC statistics obtained for a univariate null model in which unmasked sequence length was the only predictor variable (mean AUC ± 1 standard deviation). Blue symbols represent cases for which AUC statistic distributions for the null and full models do not overlap, indicating that the combined frequencies of the two motifs yielded a sensitive and specific model for prediction of S100a9 coexpression.
Figure 5
Figure 5. The region 150–250 BP upstream of the mouse S100a9 gene (mm9, chr3, 90499762–90499862) contains the highest concentration of TF binding sites that predict S100a9 coexpression.
For each cell type, the 2 KB region upstream of the S100a9 transcription start site was scanned for matches to the TF binding sites within our dictionary of 1209 motifs. If a match was identified, the matching region was assigned a cell-type-specific score (proportional to the Z statistic calculated for that motif and cell type), which quantified the degree to which increased motif occurrence increased the probability of S100a9 coexpression. If more than one motif matched at a given position, the highest score was assigned. A sliding window analysis was then used to identify regions with greatest concentration of high-scoring base pairs (dark grey = best 400 BP window; yellow = best 200 BP window; orange = best 100 BP window; red = best 50 BP window). The right margin (blue symbols) lists the individual motif, with at least one match 2 KB upstream, for which increased motif occurrence was most significantly associated with S100a9 coexpression (i.e., lowest p-value with Z > 0).
Figure 6
Figure 6. Top-ranked transcription factor motifs that predict S100A9 coexpression (32 human cell types).
Motifs listed in the left margin were selected based upon the three criteria described in the Figure 3 legend. Positive Z statistics (red heatmap colors) indicate that increased motif occurrence within 2 KB upstream regions was associated with increased probability of S100a9 coexpression. Negative Z statistics (green heatmap colors) indicate that decreased motif occurrence 2 KB upstream was associated with increased probability of S100a9 coexpression. For each cell type (columns), the percentage shown in parentheses is the fraction of microarray samples for which S100a9 was expressed above background.
Figure 7
Figure 7. Bivariate motif combinations that best predict S100A9 coexpression in 32 human cell types.
For each cell type, the right margin lists the bivariate motif model that best predicted S100A9 coexpression for each cell type (AIC criterion). Bivariate models were chosen and evaluated as described in the Figure 4 legend.
Figure 8
Figure 8. Aging increases mRNA and protein levels of SPI1/PU.1 with an overlapping distribution of SPI1/PU.1 and S100a9 in older tissues (CB6F1 mice).
RT-PCR was used to evaluate the expression of SPI1/PU.1 mRNA in (A) tail skin, (B) liver (C) kidney and (D) lung of CB6F1 mice scarified at 5 or 30 months of age. Expression was normalized to 18S ribosomal RNA (Rn18s). An asterisk symbol denotes a significant difference between young and old mice of the same sex (P < 0.05; two-tailed t-test). In part (E), immunostaining for SPI1/PU.1 showed increased abundance of SPI1/PU.1 in older tissues (top panels), with increased nuclear SPI1/PU.1 and elevation of S100a9 in cytoplasmic regions (bottom panels; red = SPI1/PU.1; green = S100a9; blue = DAPI). (F) Proposed model by which over-production of S100a9 engenders a pro-inflammatory microenvironment, with sustained activation of the RAGE and NF-κB, leading to recruitment and migration of leukocytes into local tissues. This in turn leads to further infiltration by inflammatory cell types that actively transcribe S100a9, driving a self-reinforcing cycle that sustains inflammation and lymphoid aggregation with aging.

References

    1. Tuppo E. E. & Arias H. R. The role of inflammation in Alzheimer's disease. Int. J. Biochem. Cell Biol. 37, 289–305 (2005). - PubMed
    1. Weber C. & Noels H. Atherosclerosis: current pathogenesis and therapeutic options. Nat. Med. 17, 1410–22 (2011). - PubMed
    1. Lepperdinger G. Inflammation and mesenchymal stem cell aging. Curr. Opin. Immunol. 23, 518–24 (2011). - PMC - PubMed
    1. Swindell W. R. et al. Meta-profiles of gene expression during aging: limited similarities between mouse and human and an unexpectedly decreased inflammatory signature. PLoS One 7, e33204 (2012). - PMC - PubMed
    1. Singh P. et al. Lymphoid neogenesis and immune infiltration in aged liver. Hepatology 47, 1680–90 (2008). - PMC - PubMed

Publication types

MeSH terms

LinkOut - more resources