. 2013 Mar 5;110(10):E968-77.
doi: 10.1073/pnas.1120991110. Epub 2013 Feb 6.

Branching process deconvolution algorithm reveals a detailed cell-cycle transcription program

Affiliations

Branching process deconvolution algorithm reveals a detailed cell-cycle transcription program

Xin Guo et al. Proc Natl Acad Sci U S A. .

Abstract

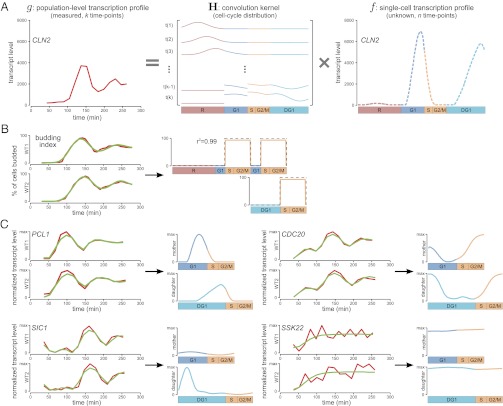
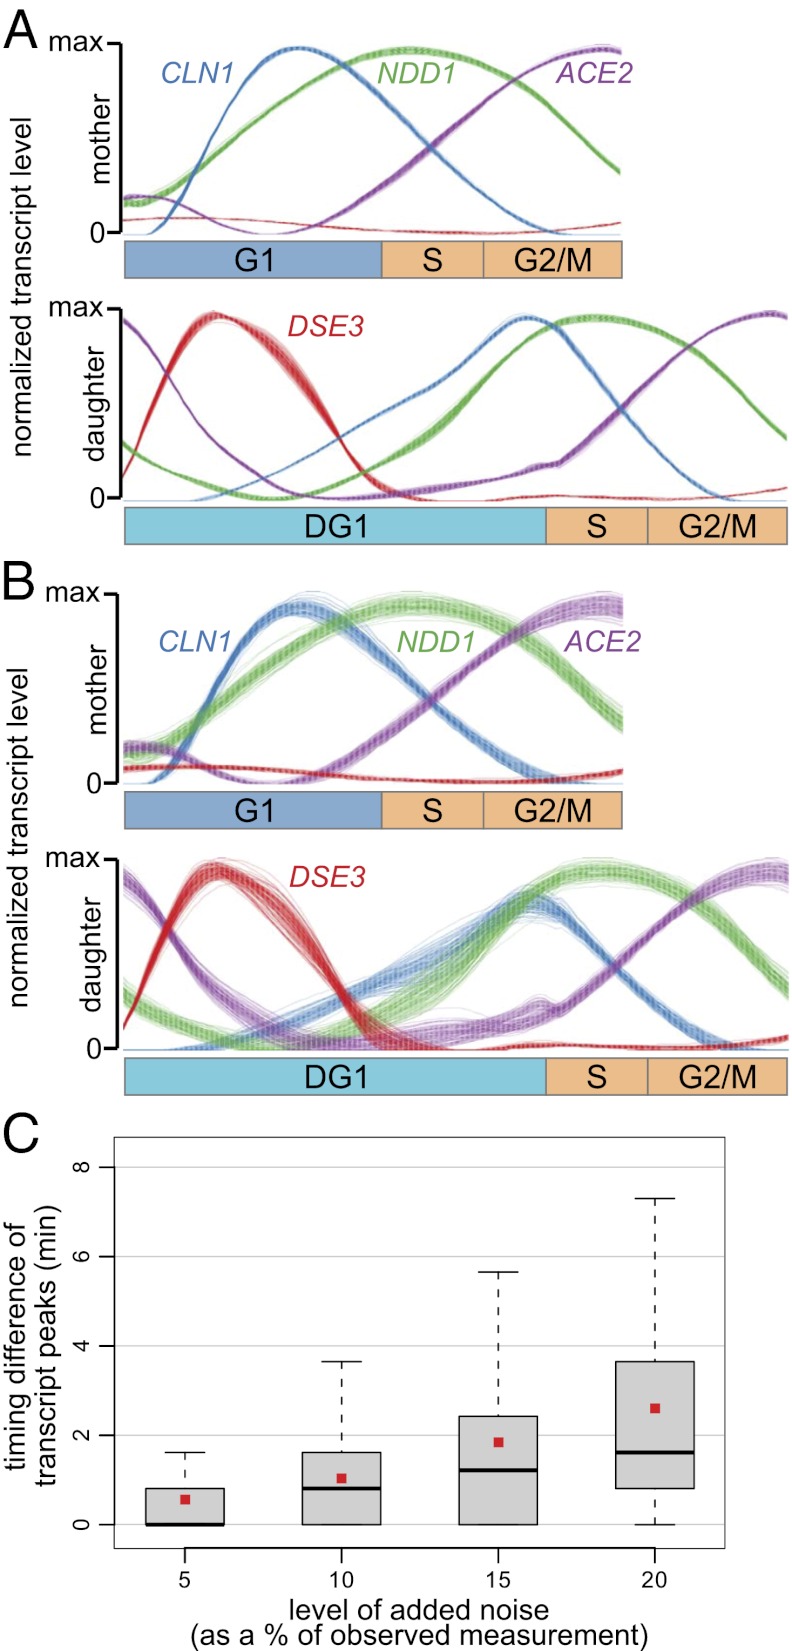
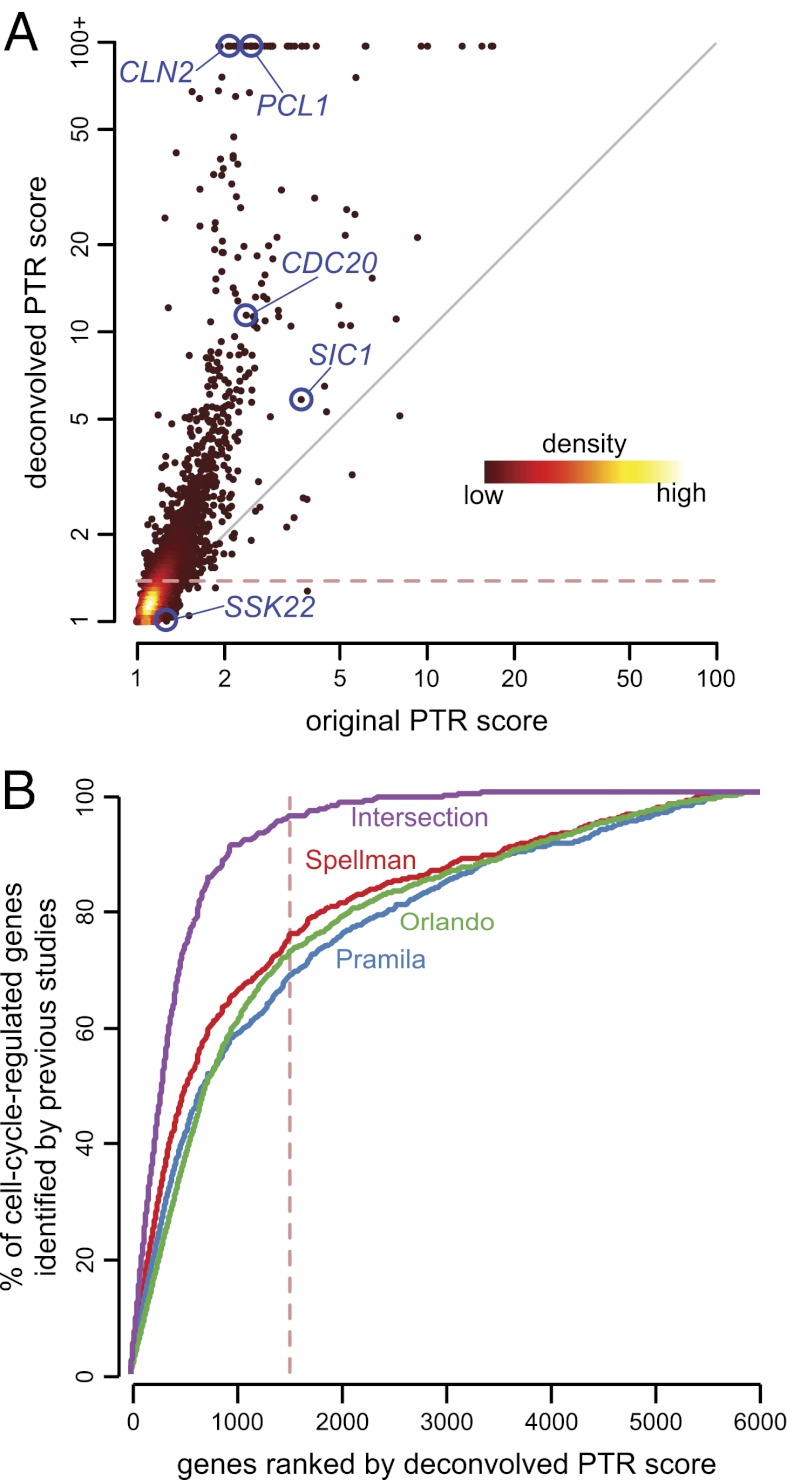
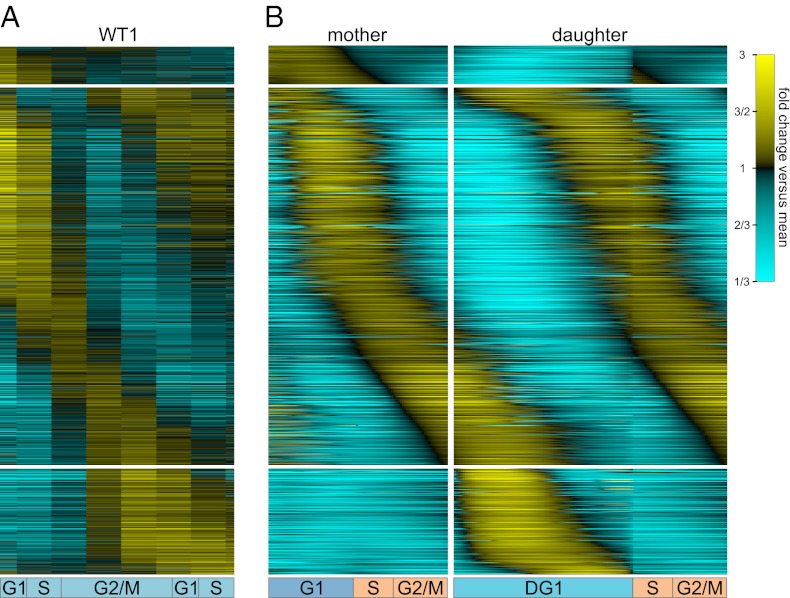
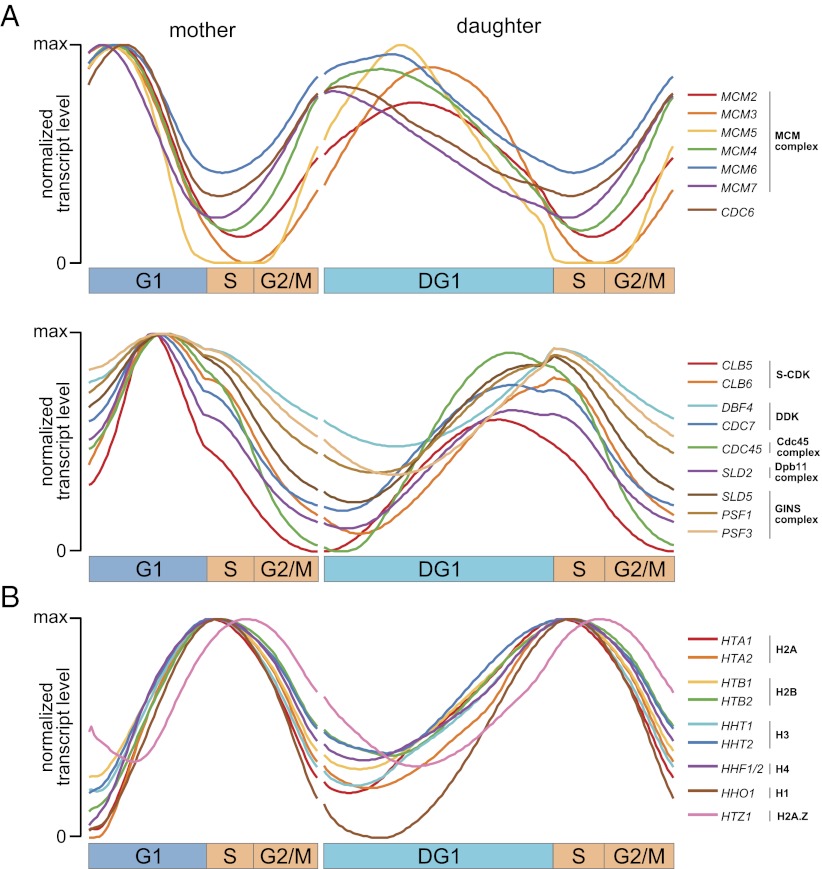
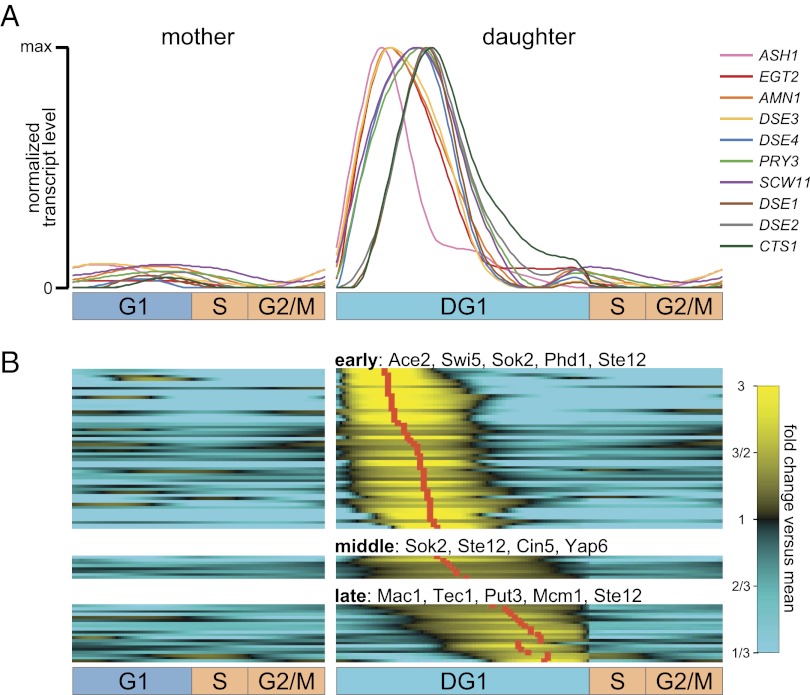
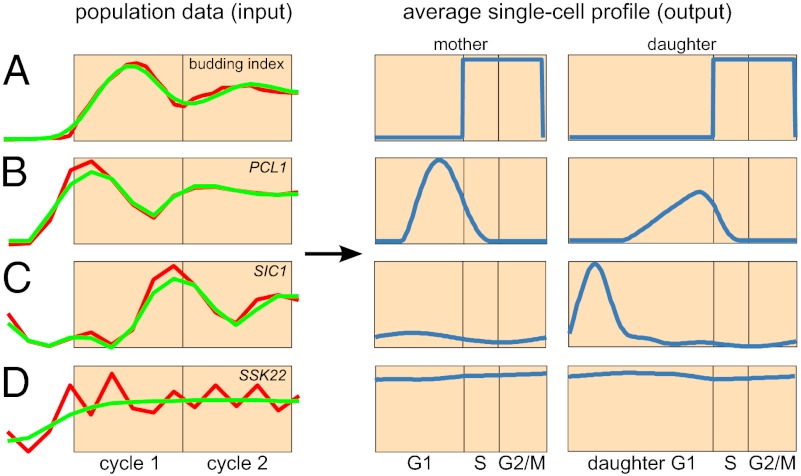
Due to cell-to-cell variability and asymmetric cell division, cells in a synchronized population lose synchrony over time. As a result, time-series measurements from synchronized cell populations do not reflect the underlying dynamics of cell-cycle processes. Here, we present a branching process deconvolution algorithm that learns a more accurate view of dynamic cell-cycle processes, free from the convolution effects associated with imperfect cell synchronization. Through wavelet-basis regularization, our method sharpens signal without sharpening noise and can remarkably increase both the dynamic range and the temporal resolution of time-series data. Although applicable to any such data, we demonstrate the utility of our method by applying it to a recent cell-cycle transcription time course in the eukaryote Saccharomyces cerevisiae. Our method more sensitively detects cell-cycle-regulated transcription and reveals subtle timing differences that are masked in the original population measurements. Our algorithm also explicitly learns distinct transcription programs for mother and daughter cells, enabling us to identify 82 genes transcribed almost entirely in early G1 in a daughter-specific manner.


Conflict of interest statement

The authors declare no conflict of interest.

Figures

Fig. 1.
Fig. 1.
Deconvolution recovers average single-cell profiles from population-level data. (A) Algorithm overview. Deconvolution is formulated as an ill-posed discrete inverse problem g = H × f, in which g is a column vector containing the measured population-level time-series data (for example, the transcription profile of the G1 cyclin CLN2; Left, red), H is the convolution kernel calculated from CLOCCS parameters, and f is a column vector representing the components of the unknown dynamic profile of an average individual cell, which is to be estimated. After regularizing using a wavelet basis, our optimization algorithm learns smooth estimates for the four components of f, corresponding to the intervals R, G1, post-G1, and DG1; we consistently color these intervals red, blue, orange, and cyan. Thus, the algorithm takes g as input and learns f as output, yielding an average single-cell profile whose dynamic range and temporal resolution have been dramatically increased (as illustrated here by CLN2). (B) Joint deconvolution of replicate budding index measurements. (Left) The two replicate wild-type budding index measurements in red, along with the fit to those time series learned by our algorithm overlaid in green. (Right) The deconvolved budding profile, learned jointly from the two replicates. The true budding profile is shown as a dashed line for comparison (r2 = 0.99). (C) Joint deconvolution of replicate transcription profiles for four representative genes. Shown for each gene are two replicate measured transcription profiles in red, the fit to those time series learned by our algorithm overlaid in green, and separate deconvolved transcription profiles for mother and daughter cells. To facilitate cross-comparison, all transcription profiles are normalized so that their maximum levels are the same height; consequently, the increased amplitude produced by deconvolution is not apparent (dynamic range before and after deconvolution for these genes is shown later in Fig. 3A). The cyclin PCL1 peaks late in both G1 and DG1, the APC activator CDC20 peaks during mitosis, and the CDK inhibitor SIC1 is transcribed primarily during DG1. For genes whose two replicate profiles are in poor agreement—such as the MAP kinase SSK22 (Pearson’s correlation = 0.14)—our algorithm removes apparent noise; the resultant deconvolved profile smoothly traces the broad trajectory of measured transcript levels across both replicates.
Fig. 2.
Fig. 2.
Deconvolved profiles are robust to uncertainty in inputs. (A) Robustness of deconvolved profiles with respect to uncertainty in CLOCCS parameter estimates. Shown are 100 overlaid deconvolved transcription profiles for the G1 cyclin CLN1, the S-phase transcriptional activator NDD1, the transcriptional activator ACE2 expressed late in the cell cycle to drive early G1 transcription in a daughter-specific manner, and the daughter-specifically expressed DSE3. The 100 deconvolved transcription profiles for each gene were produced using 100 different CLOCCS parameterizations, each a random realization from the CLOCCS Markov chain. The most noticeable uncertainty in the deconvolved profiles seems to be for DSE3 in the middle of DG1, but even this uncertainty is minimal. Further examples are given in Fig. S2. (B) Robustness of deconvolved profiles with respect to noise in input transcript levels. Shown are 100 overlaid deconvolved transcription profiles for CLN1, NDD1, ACE2, and DSE3. These 100 profiles for each gene were produced by deconvolving 100 different perturbations of the input transcript levels by multiplicative noise at an average of 10%. (C) Effective temporal resolution of deconvolved profiles as a function of measurement noise. The x axis indicates the average level of random multiplicative noise added to input transcript levels at every point in the time series. Box plots display the distribution of timing differences (unsigned) between the transcription peaks of deconvolved profiles with and without noise added. Gray boxes indicate interquartile ranges, thick black bars indicate median values, and small red squares indicate mean values.
Fig. 3.
Fig. 3.
Genome-wide analysis of deconvolved transcription profiles reveals a large number of transcripts fluctuating during the cell cycle. (A) Dynamic range of transcription profiles before and after deconvolution. The density scatterplot depicts PTR scores for all 5,670 transcription profiles before and after deconvolution. PTR scores above 100 are shown truncated because the PTR score can become arbitrarily large if the denominator approaches zero. Note that although most genes have increased dynamic range after deconvolution (above diagonal), some genes have decreased dynamic range (below diagonal), owing to our wavelet-based regularization. The five genes whose deconvolved transcription profiles appear in Fig. 1 are highlighted in blue. The dashed red line indicates the deconvolved PTR score threshold corresponding to the 1,500 most strongly cell-cycle–regulated genes. (B) Recovery of yeast genes labeled in previous studies as cell-cycle–regulated. We ranked all 5,670 genes by their deconvolved PTR score. The plot shows the cumulative recall (sensitivity) of recallable genes from previous studies. Genes with the highest 1,500 PTR scores (dashed red line) include 96% of the 440 genes labeled by all three earlier studies as cell-cycle–regulated.
Fig. 4.
Fig. 4.
Transcript dynamics of 1,500 most strongly cell-cycle–regulated genes. Heat maps depict the dynamics of transcripts in the measured (A) and deconvolved (B) transcription profiles of the 1,500 most strongly cell-cycle–regulated genes. Corresponding rows in the various heat maps represent the same gene. Note that although our algorithm learns the deconvolved transcription profiles from two independent replicates of the measured data, only WT1 is shown in A for space (WT2 data are nearly identical).
Fig. 5.
Fig. 5.
High temporal resolution of deconvolution reveals fine timing of transcription programs. (A) Normalized deconvolved transcription profiles of genes playing key roles in the origin-selection (Upper) and origin-activation (Lower) steps of DNA replication. Profiles of CDT1, MCM10, SLD3 (in the Cdc45 complex), DPB11 (in the Dpb11 complex), and PSF2 (in the GINS complex) are not shown because their deconvolved PTR scores fall below the PTR threshold of our top 1,500 genes [none of these five are identified as cell-cycle–regulated in any previous study (1, 3, 4) except for PSF2 in ref. 4]. (B) Normalized deconvolved transcription profiles of histone genes in yeast. Note that the only two histone genes with somewhat distinctive profiles are the H2A.Z histone variant which peaks later and the H1 linker histone whose transcript levels approach zero during DG1. Fig. S3 shows an alternative representation of all these profiles.
Fig. 6.
Fig. 6.
Branching process construction enables deconvolution to reveal a daughter-specific G1 transcription program. Our deconvolution algorithm explicitly learns distinct cell-cycle transcription programs for both mother and daughter cells, enabling us to explore transcriptional behavior of daughter cells that cannot be observed from the population-level transcription profiles. (A) Deconvolved transcription profiles in mother (Left) and daughter (Right) cells of genes previously characterized as daughter-specific by Colman-Lerner et al. (27). (B) Two criteria were used to identify 82 genes transcribed primarily and almost entirely in the DG1 interval (which we call daughter-specific genes). All daughter-specific genes in A were identified by our criteria and thus appear again in this set. According to the timing of transcription peaks in DG1, we classified these genes into three subclusters: early, middle, and late. Up to five overrepresented TFs of each subcluster are shown (full list in Table S3).
Fig. P1.
Fig. P1.
Deconvolution recovers average single-cell profiles from population-level data for both mother and daughter cells. (A–D) (Left) Input population-level time-series data (red) and the fit to these data under our algorithm (green). (Right) Deconvolved transcription profiles for both mother and daughter cells (blue). (A) Budding index measurements: Cells become budded just before the start of S phase. (B) PCL1: Transcription profiles are fairly similar between mother and daughter cells. (C) SIC1: Transcription profiles show a sharp burst of expression that is specific to daughter cells. (D) SSK22: Transcription profiles are denoised by deconvolution.

Similar articles

Cited by

References

    1. Spellman PT, et al. Comprehensive identification of cell cycle-regulated genes of the yeast Saccharomyces cerevisiae by microarray hybridization. Mol Biol Cell. 1998;9(12):3273–3297. - PMC - PubMed
    1. Cho RJ, et al. A genome-wide transcriptional analysis of the mitotic cell cycle. Mol Cell. 1998;2(1):65–73. - PubMed
    1. Pramila T, Wu W, Miles S, Noble WS, Breeden LL. The Forkhead transcription factor Hcm1 regulates chromosome segregation genes and fills the S-phase gap in the transcriptional circuitry of the cell cycle. Genes Dev. 2006;20(16):2266–2278. - PMC - PubMed
    1. Orlando DA, et al. Global control of cell-cycle transcription by coupled CDK and network oscillators. Nature. 2008;453(7197):944–947. - PMC - PubMed
    1. Granovskaia MV, et al. High-resolution transcription atlas of the mitotic cell cycle in budding yeast. Genome Biol. 2010;11(3):R24. - PMC - PubMed