. 2013 Apr;87(8):4496-506.
doi: 10.1128/JVI.03413-12. Epub 2013 Feb 6.

Splenic priming of virus-specific CD8 T cells following influenza virus infection

Affiliations

Splenic priming of virus-specific CD8 T cells following influenza virus infection

Damian L Turner et al. J Virol. 2013 Apr.

Abstract

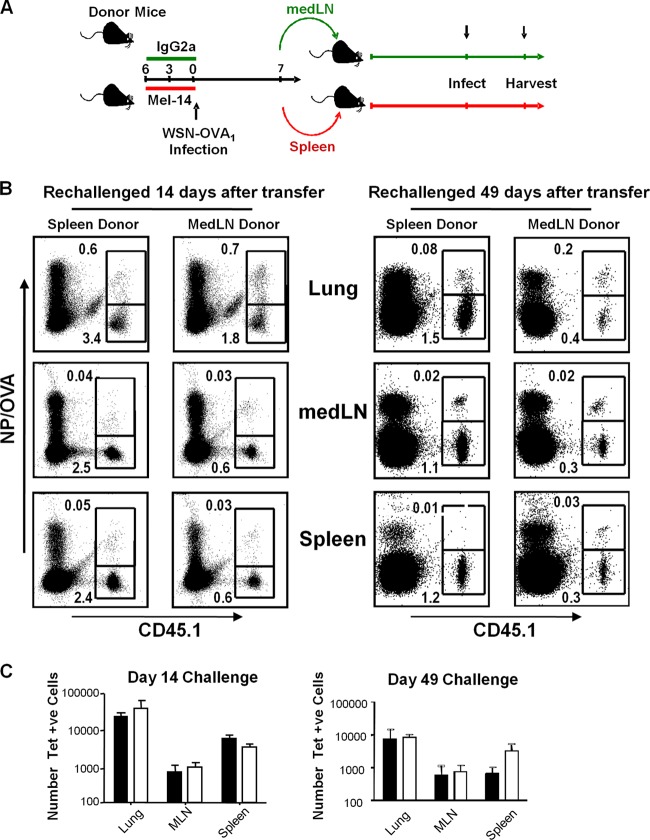
In healthy individuals, influenza virus (IAV) infection generally remains localized to the epithelial cells of the respiratory tract. Previously, IAV-specific effector CD8 T cells found systemically during the course of IAV infection were thought to have been primed in lung-draining lymph nodes with subsequent migration to other tissues. However, little is known about whether other lymphoid sites participate in the generation of virus-specific CD8 T cells during localized IAV infection. Here, we present evidence of early CD8 T cell priming in the spleen following respiratory IAV infection independent of lung-draining lymph node priming of T cells. Although we found early indications of CD8 T cell activation in the lymph nodes draining the respiratory tract, we also saw evidence of virus-specific CD8 T cell activation in the spleen. Furthermore, CD8 T cells primed in the spleen differentiated into memory cells of equivalent longevity and with similar recall capacity as CD8 T cells primed in the draining lymph nodes. These data showed that the spleen contributes to the virus-specific effector and memory CD8 T cell populations that are generated in response to respiratory infection.


Figures

Fig 1
Fig 1
The presence of viral antigen was determined in the medLN and spleen after respiratory infection. A total of 100,000 naive CD45.1 OT-I cells were transferred into CD45.2 C57BL/6 mice, which were infected with 1,000 PFU of WSN-OVA1 influenza virus by i.n. infection. At days 2, 3, and 4, the cells were harvested from the medLN, spleen, and pLN (inguinal, brachial, axillary, and mesenteric lymph nodes) and enriched for CD45.1 by magnetic cell separation. Single cell suspensions were stained with fluorescently labeled antibodies to CD45.1, CD8, and CD69 and analyzed by flow cytometry. (A) Histograms show the CD69 profiles and forward-scatter profiles of gated CD8+ CD45.1+ cells. (B) Graphs represent the means and standard errors of the mean (SEM) of the frequency of CD69+ and forward scatterhi cells (n = 3) at each time point. Two-way analysis of variance (ANOVA) of medLN versus pLN and spleen versus pLN was performed (*, P < 0.05; **, P < 0.01; ****, P < 0.0001).
Fig 2
Fig 2
Viral antigen is transiently presented to CD8 T cells in the spleen following respiratory influenza virus infection. (A) CD45.2 C57BL/6 mice were administered 1,000 PFU of WSN-OVA1 by i.n. infection and at days 3, 5, or 11 106 CD45.1 CFSE-labeled OT-I cells were adoptively transferred. At 22 h after transfer, the spleen, mediastinal, inguinal, mesenteric, and cervical lymph nodes were harvested, and 2 × 10⁶ total cells were placed in culture for 3 days. The CFSE profiles of gated populations of CD45.1+ transferred cells are shown. The numbers represent the means and SEM of two or three animals per group. The results are representative of three independent experiments. (B) A total of 106 CFSE-labeled naive F5 cells were transferred into animals previously infected with 500 EID50 E61-13-H17 strain of influenza virus. The cells were harvested 24 h later and then placed in culture for 3 days. Histograms represent the CFSE profiles of transferred cells from individual tissues. The numbers represent the means and SEM of two or three animals per group. The results are representative of two independent experiments.
Fig 3
Fig 3
Antigen encounter in the spleen occurs in the T-cell areas of splenic follicles. (A) CD45.2 C57BL/6 mice were inoculated i.n. with 1,000 PFU of WSN-OVA1 or WSN-OVA0 influenza virus. At 5 days after infection, naive CD45.1 OT-I cells were transferred intravenously, and 24 h later the spleens were harvested, sectioned, and stained with OVA:Kb tetramer (red) and fluorescently labeled antibodies specific for B220 (green) and CD45.1 (blue). Tissue sections were then analyzed by confocal microscopy (×100 total magnification). (B) In parallel experiments, the lymphoid organs were harvested, and the transferred cell population in each tissue analyzed for CD69 expression (left panel) and forward scatter (right panel) by flow cytometry. The statistical method used was one-way ANOVA/Dunnett post-analysis (*, (P < 0.05). The results are representative of two independent experiments. (C) CD90.2 BALB/c mice were inoculated intranasally with 200 TCID50 of PR8 influenza virus. At 4 days after infection, naive CD90.1 TS1 cells were transferred into these animals; 24 h later, the lymphoid organs and lungs were harvested, and the transferred cell population was analyzed for CD69 and CD25 expression by flow cytometry. The spleens and lungs were harvested from control or PR8-infected mice at day 4 and homogenized, and the virus titers were determined by a MDCK TCID50 titration assay. The means and SEM for three mice per infected group are shown (uninfected group, n = 2).
Fig 4
Fig 4
Sequestration of virus-specific cells in the medLN does not affect the expansion of the splenic virus-specific CD8 T cell population. C57BL/6 mice were inoculated i.n. with 1,000 PFU of WSN-OVA1 and then treated with 1 mg of FTY720/kg or PBS at 4 days after infection. At day 7, the lung, spleen, and medLN were harvested, and the cells were stained with MAbs to CD8 and CD11a and with PA224-233:Db, NP366-374:Db, and OVA:Kb tetramers. (A) Representative plots are gated on CD8 T cells, with percentages shown representing populations of CD11ahi cells that are NP, PA, or OVA specific. (B) Graphs show the means and SEM of the total number of NP-, PA-, or OVA-specific cells present at day 7 p.i. in the indicated tissues after PBS or FTY720 treatment. **, P < 0.01; ns, P > 0.05 (as determined by two-way ANOVA).
Fig 5
Fig 5
Inhibiting priming of virus-specific cells in the medLN has no effect on the expansion of virus-specific CD8 T cells in the spleen. C57BL/6 mice were pretreated with three doses of 250 μg of Mel-14 or IgG2a MAb 3 days apart. At the time of the third dose, animals were infected intranasally with 1,000 PFU of WSN-OVA1. At 7 days after infection, the lung, spleen, and medLN were harvested, and the cells were stained with MAbs specific for CD8 and CD11a and with NP366-374:Db and OVA:Kb tetramers. (Top) Representative plots showing the frequency of NP-specific and OVA-specific cells of total CD8 T cells in the indicated tissues of mice treated with Mel-14 or IgG MAb. (Bottom) Total number of OVA-specific and NP-specific CD8 T cells in the spleen, lung, and mediastinal lymph node were measured 7 days postinfection. The graph indicates the means and SEM for three animals per group. **, P < 0.01; *, P < 0.05 (as determined by two-way ANOVA).
Fig 6
Fig 6
CD8 T cells primed in the medLN and in the spleen have a similar capacity to generate a recall response. (A) Schematic of the protocol used to generate and transfer medLN-primed and splenic-primed cells. Briefly, C57BL/6 mice were pretreated with three doses of 250 μg of Mel-14 or IgG2a MAb 3 days apart. At the time of the third dose, animals were infected i.n. with 1,000 PFU of WSN-OVA1. At 7 days after infection, the mediastinal lymph nodes (medLN) were harvested from IgG2a-treated mice, while the spleens were harvested from Mel-14-treated animals, and the cells enriched for CD8 by magnetic cell separation. Total CD8-enriched medLN and spleen cells were transferred into uninfected mice at numbers that contained 10,000 NP/OVA tetramer-positive cells. (B) At 14 days (left panel) and 49 days (right panel) after transfer, recipient mice were challenged with WSN-OVA1, and 7 days later, the spleen, medLN, and lung harvested and stained with fluorescently labeled anti-CD45.1 antibody and NP366-374:Db and OVA:Kb tetramers. Shown are representative plots of gated CD8+ cells with percentages showing the frequency of NP- and OVA-specific CD45.1+ transferred cells. (C) Graphs represent the means and SEM of the absolute numbers of NP-and OVA-specific CD45.1+ CD8 T cells after recall at 14 days (left) and 49 days (right) after transfer (n = 4 to 5 animals per group). Open bars, medLN cells transferred; solid bars, spleen cells transferred.
Fig 7
Fig 7
CD8 T cells primed in the medLN and in the spleen have similar capacity to produce IFN-γ upon recall. Mice were treated with Mel-14 or IgG2a and infected as in Fig. 6A. The medLN were harvested from IgG-treated mice, while the spleens were harvested from Mel-14-treated animals, and the cells were enriched for CD8 by magnetic cell separation as in Fig. 6A. Whole CD8-enriched medLN and spleen cells were transferred into naive mice at numbers which contained 20,000 NP/OVA tetramer-positive cells. (A) At 20 days after transfer, recipient mice were infected with WSN-OVA1 and, 8 days later, the spleen, medLN, and lung were harvested and stimulated for 5 h with SIINFEKL peptide (1 μg/ml) and NP366-374 (1 μg/ml) in a standard in vitro restimulation assay. The cells were then stained with fluorescently labeled CD11a, CD8, and CD45.1 antibodies and then permeabilized and stained with fluorescently labeled anti-IFN-γ antibody. Shown are representative plots of gated CD8+ CD45.1+ transferred cells with percentages showing the frequency of IFN-γ-producing cells. (B) Graphs represent the total number of IFN-γ-producing transferred cells in the indicated tissues after recall (n = 4 per group).

Similar articles

Cited by

References

    1. Inaba K, Turley S, Yamaide F, Iyoda T, Mahnke K, Inaba M, Pack M, Subklewe M, Sauter B, Sheff D, Albert M, Bhardwaj N, Mellman I, Steinman RM. 1998. Efficient presentation of phagocytosed cellular fragments on the major histocompatibility complex class II products of dendritic cells. J. Exp. Med. 188:2163–2173 - PMC - PubMed
    1. Albert ML, Sauter B, Bhardwaj N. 1998. Dendritic cells acquire antigen from apoptotic cells and induce class I-restricted CTLs. Nature 392:86–89 - PubMed
    1. Bender A, Albert M, Reddy A, Feldman M, Sauter B, Kaplan G, Hellman W, Bhardwaj N. 1998. The distinctive features of influenza virus infection of dendritic cells. Immunobiology 198:552–567 - PubMed
    1. Hamilton-Easton A, Eichelberger M. 1995. Virus-specific antigen presentation by different subsets of cells from lung and mediastinal lymph node tissues of influenza virus-infected mice. J. Virol. 69:6359–6366 - PMC - PubMed
    1. Legge KL, Braciale TJ. 2003. Accelerated migration of respiratory dendritic cells to the regional lymph nodes is limited to the early phase of pulmonary infection. Immunity 18:265–277 - PubMed

Publication types

MeSH terms

LinkOut - more resources