. 2013 Apr;24(7):1068-82.
doi: 10.1091/mbc.E12-09-0661. Epub 2013 Feb 6.

Central role of the exchange factor GEF-H1 in TNF-α-induced sequential activation of Rac, ADAM17/TACE, and RhoA in tubular epithelial cells

Affiliations

Central role of the exchange factor GEF-H1 in TNF-α-induced sequential activation of Rac, ADAM17/TACE, and RhoA in tubular epithelial cells

Faiza Waheed et al. Mol Biol Cell. 2013 Apr.

Abstract

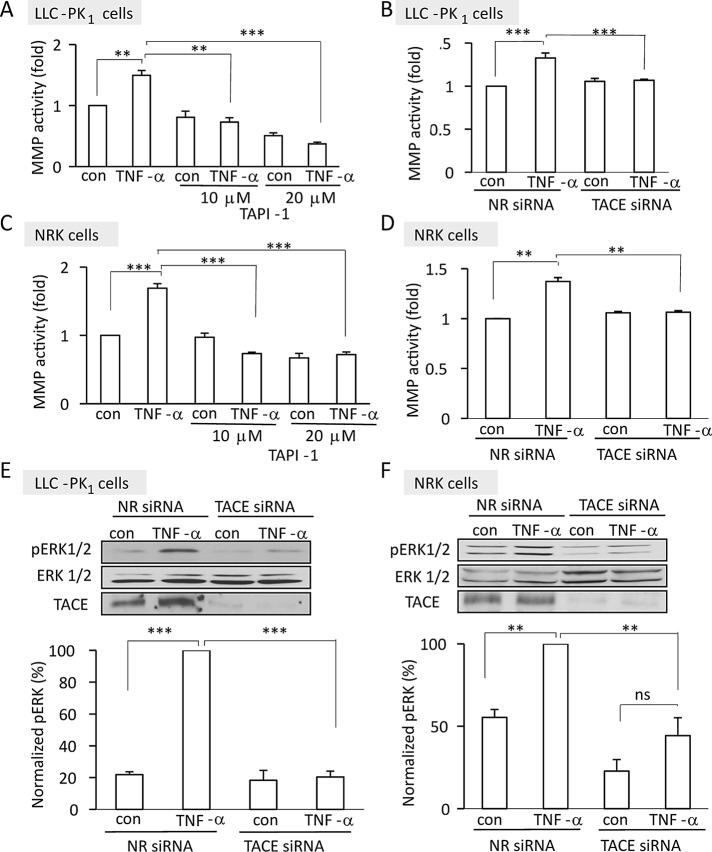
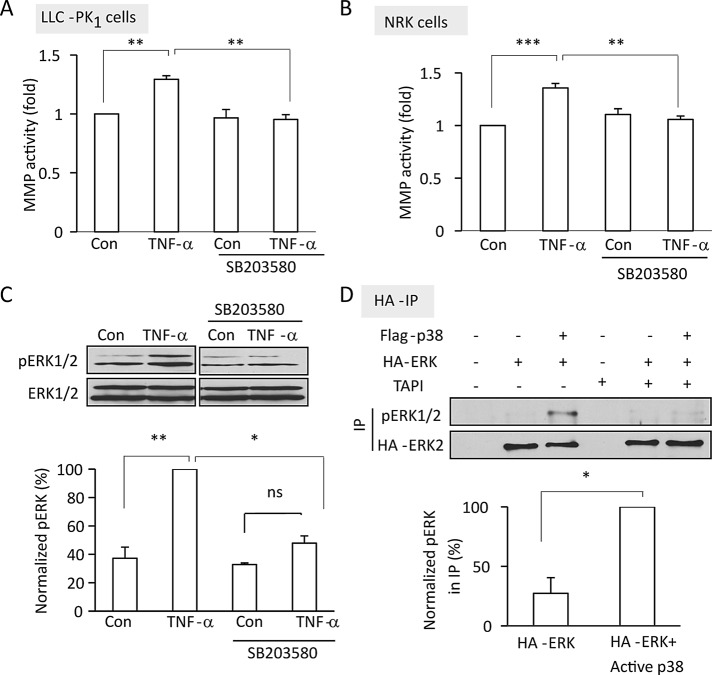
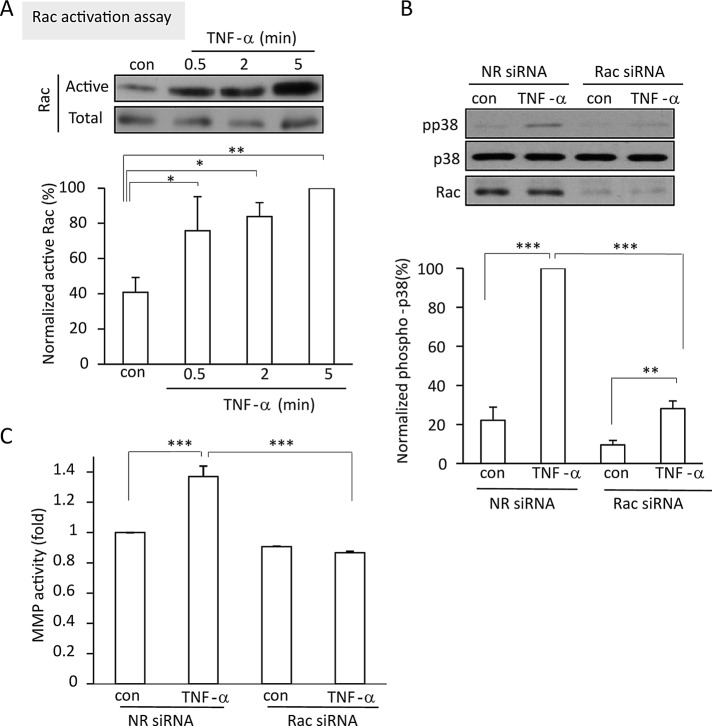
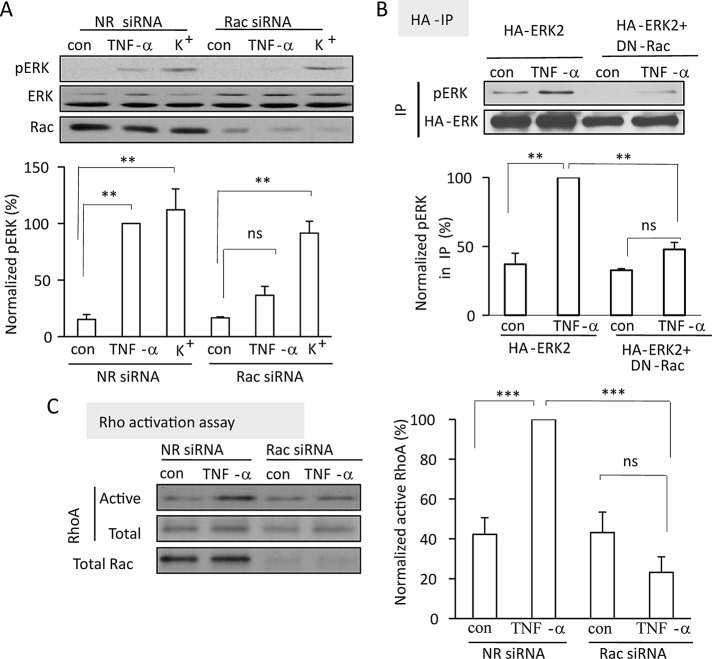
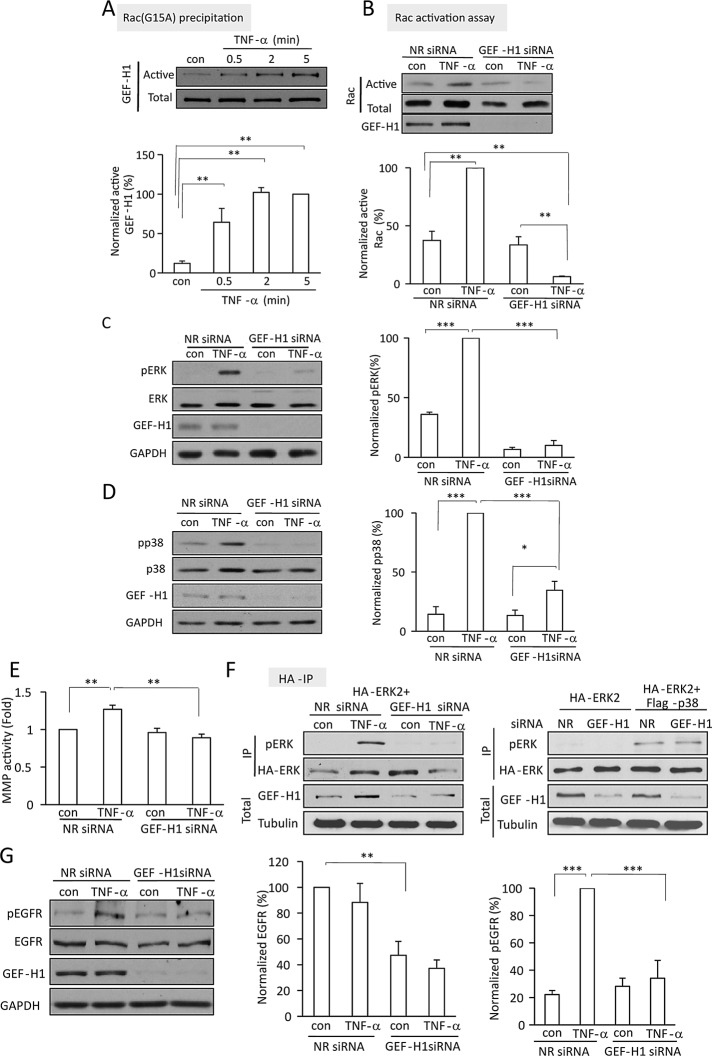
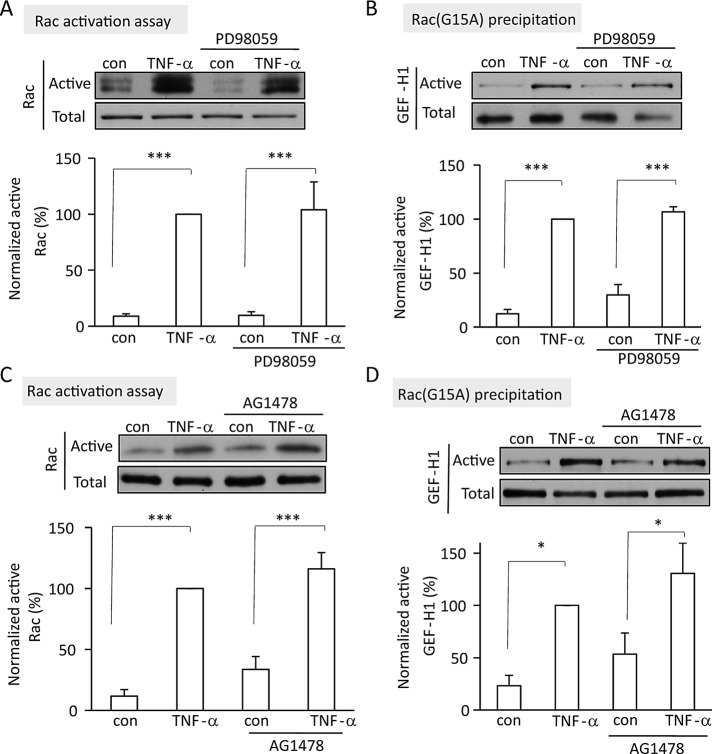
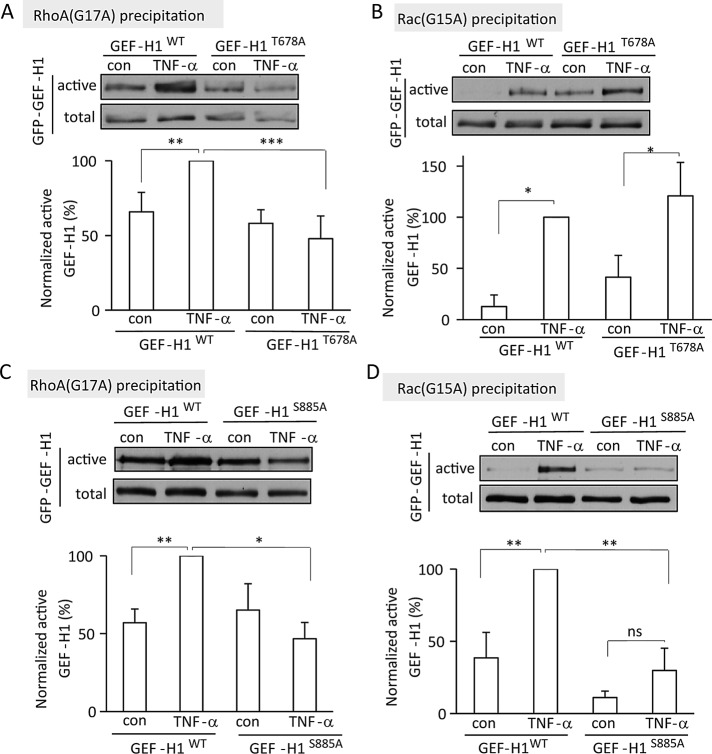
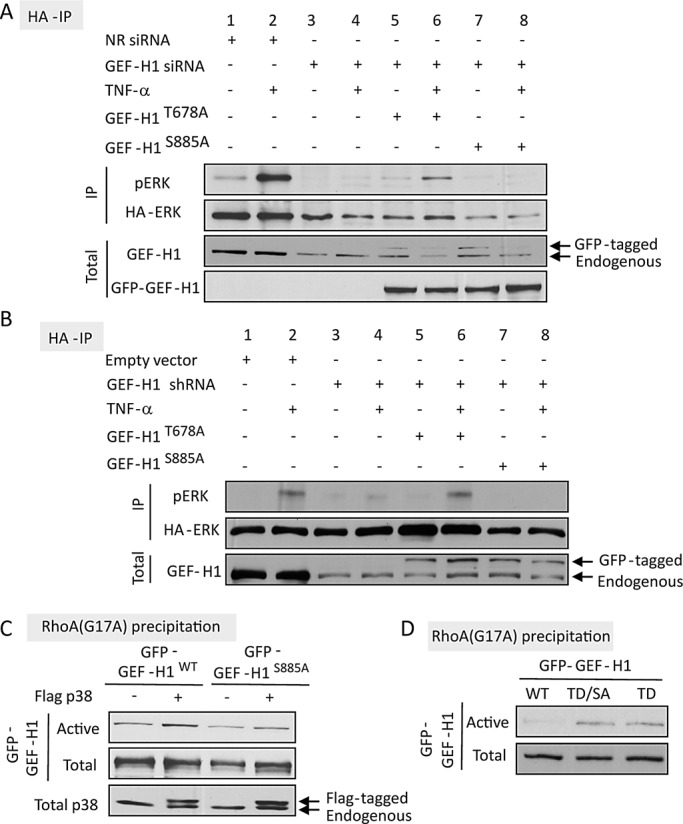
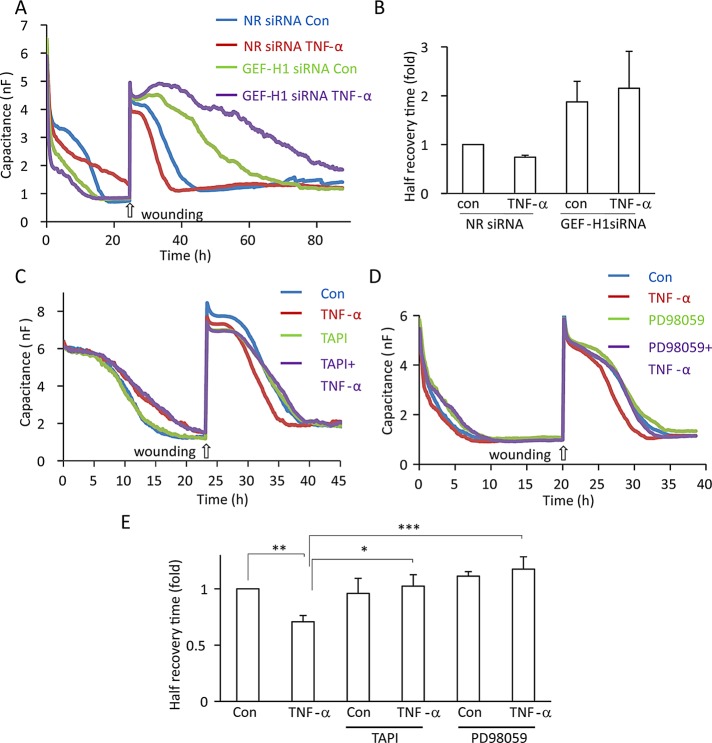
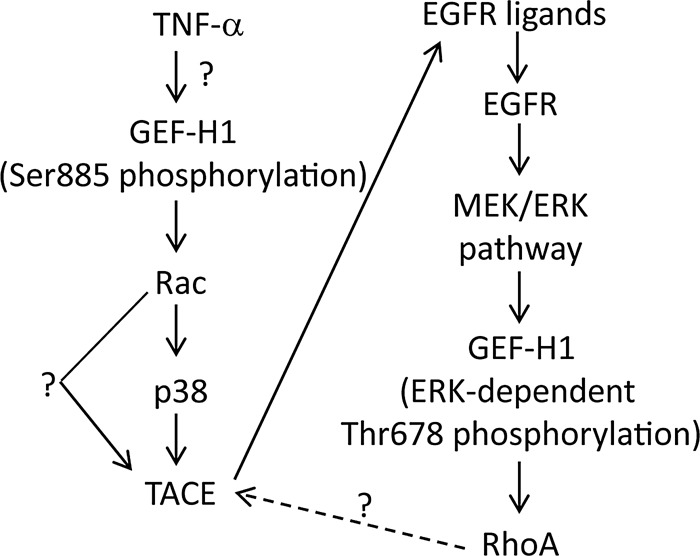
Transactivation of the epidermal growth factor receptor (EGFR) by tumor necrosis factor-α (TNF-α) is a key step in mediating RhoA activation and cytoskeleton and junction remodeling in the tubular epithelium. In this study we explore the mechanisms underlying TNF-α-induced EGFR activation. We show that TNF-α stimulates the TNF-α convertase enzyme (TACE/a disintegrin and metalloproteinase-17), leading to activation of the EGFR/ERK pathway. TACE activation requires the mitogen-activated protein kinase p38, which is activated through the small GTPase Rac. TNF-α stimulates both Rac and RhoA through the guanine nucleotide exchange factor (GEF)-H1 but by different mechanisms. EGFR- and ERK-dependent phosphorylation at the T678 site of GEF-H1 is a prerequisite for RhoA activation only, whereas both Rac and RhoA activation require GEF-H1 phosphorylation on S885. Of interest, GEF-H1-mediated Rac activation is upstream from the TACE/EGFR/ERK pathway and regulates T678 phosphorylation. We also show that TNF-α enhances epithelial wound healing through TACE, ERK, and GEF-H1. Taken together, our findings can explain the mechanisms leading to hierarchical activation of Rac and RhoA by TNF-α through a single GEF. This mechanism could coordinate GEF functions and fine-tune Rac and RhoA activation in epithelial cells, thereby promoting complex functions such as sheet migration.


Figures

FIGURE 1:
FIGURE 1:
(A–D) TNF-α activates TACE. Confluent LLC-PK1 (A, B) or NRK (C, D) cells were treated with 50 ng/ml TNF-α for 30 min, and MMP activity was measured in the cell lysates using a fluorigenic peptide substrate, as described in Materials and Methods. In A and C cells were pretreated for 30 min with 10 or 20 μM TAPI-1 as indicated. In B and D cells were transfected with NR or TACE-specific siRNA 48 h before TNF-α addition. After subtraction of the background fluorescence, the control fluorescence values in each experiment were taken as unity, and the fluorescence in the treated samples was expressed as fold increase. The graphs represent mean ± SEM from three independent experiments performed in triplicate. (E, F) TACE mediates TNF-α–induced ERK activation. LLC-PK1 (E) or NRK (F) cells were transfected with nonrelated siRNA or siRNA directed against pig (E) or rat (F) TACE. Forty-eight hours later the cells were treated with 10 ng/ml TNF-α for 10 min, and the levels of phospho-ERK, total ERK, and TACE were detected by Western blotting. The graphs show quantification of the blots using densitometry. The amount of phospho-ERK was normalized to total ERK in the corresponding cell lysates. The results in each experiment were expressed as percentage compared with the TNF–α–treated sample, taken as 100%. The graphs show mean ± SE from n = 3 independent experiments. Statistical analysis is described in Materials and Methods.
FIGURE 2:
FIGURE 2:
TNF-α–induced TACE and ERK activation is mediated by p38. (A–C) Confluent LLC-PK1 (A, C) or NRK (B) cells were treated with 10 μM SB203580 for 30 min, followed by 50 ng/ml TNF-α (30 min [A, B] or 5 min [C]). In A and B, MMP activity was measured and expressed as in Figure 1. In C, pERK and ERK levels were determined as in Figure 1. (D) LLC-PK1 cells grown in 10-cm dishes were transfected with HA-tagged ERK2 with or without cotransfection of FLAG-p38. Forty-eight hours later, where indicated, cells were treated with 10 μM TAPI for 30 min. Next the cells were lysed and HA-ERK was precipitated through the tag, and pERK and HA in the precipitates were detected by Western blotting. The graphs in C and D show quantification of the blots by densitometry. Density values of pERK were normalized using the corresponding total ERK (C) or HA (D) signal and were expressed as in Figure 1. All graphs show mean ± SE from n = 3 independent experiments. Note that in C the samples were run on the same gel, and unrelated lanes were cut from the scanned gel.
FIGURE 3:
FIGURE 3:
Rac is activated by TNF-α and mediates p38 and TACE activation. (A) TNF-α activates Rac. LLC-PK1 cells were treated with 10 ng/ml TNF-α for the indicated times. Cells were lysed, and active Rac was precipitated using GST-PBD. Rac in the precipitates and total cell lysates (active and total, respectively) was detected by Western blotting and quantified by densitometry. The amount of active Rac in each sample was normalized to the corresponding total Rac. The data obtained in each experiment are expressed as percentage compared with the level of the 5-min TNF-α–treated sample, which is taken as 100%. (B, C) LLC-PK1 cells were transfected with NR or porcine Rac1/2-specific siRNA. Forty-eight hours later the cells were treated with 10 ng/ml TNF-α for 5 min (B) or 30 min (C). In B, total cell lysates were probed on Western blots with antibodies against phospho-p38, p38, Rac, and the loading control GAPDH. The blots were quantified and phospho-p38 normalized with p38 in the same samples, as described for pERK in Figure 1. In C, TACE activity was measured as described in Figure 1. The graphs show mean ± SE from n = 5 (A), 8 (B), or 3 (C) independent experiments.
FIGURE 4:
FIGURE 4:
Rac mediates ERK and RhoA activation induced by TNF-α. (A) LLC-PK1 cells were transfected with NR siRNA or porcine Rac1/2 siRNA. Forty-eight hours later the cells were incubated in Na+ medium for 15 min, followed by the addition of 10 ng/ml TNF-α in Na+ medium or exchange of the medium for K+ medium (5 min). pERK was detected and quantified as in Figure 1. The blot was stripped and reprobed with anti-Rac. (B) Cells were transfected with HA-ERK2 with or without cotransfection of DN-Rac and 48 h later treated with TNF-α (5 min). HA-ERK was precipitated and its phosphorylation detected as in Figure 2D. (C) Cells were transfected with NR siRNA or porcine Rac1/2-specific siRNA for 48 h. Cells were treated with TNF-α (5 min), and active RhoA was precipitated with GST-RBD and quantified as described for Rac in Figure 3. The graphs show mean ± SE from n = 3 (A, B) or 5 (C) independent experiments.
FIGURE 5:
FIGURE 5:
TNF-α activates Rac, TACE, and ERK through GEF-H1. (A) LLC-PK1 cells were treated with 10 ng/ml TNF-α for the indicated times. Active GEF-H1 was precipitated using GST-Rac(G15A). GEF-H1 in the precipitates and total cell lysates (active and total, respectively) was detected by Western blotting. The blots were quantified as described for Rac. (B–E, G) LLC-PK1 cells were transfected with NR siRNA or GEF-H1-specific siRNA. Forty-eight hours later the cells were treated with 10 ng/ml TNF-α for 5 min (B–D, G) or 30 min (E). In B, active Rac was detected and quantified as in Figure 3. In C and D, pERK, ERK, phospho-p38, p38, GEF-H1, and GAPDH were detected by Western blotting. In E, MMP activity was determined as in Figure 1. In G, pEGFR was detected using an antibody against phospho-Y845 EGFR. For all blots quantification was done using densitometry as described earlier. The data for phospho-p38, pERK, and pEGFR were normalized to the corresponding total levels of these proteins, and the data for EGFR were normalized using GAPDH. (F) LLC-PK1 cells were transfected with HA-ERK2 with cotransfection of NR siRNA, GEF-H1 siRNA, or FLAG-p38, as indicated. Where indicated, cells were treated with TNF-α for 5 min. HA-ERK was precipitated and its phosphorylation assessed using a pERK antibody. The top two blots show the immunoprecipitated pERK and HA signals (IP), and the bottom two blots demonstrate GEF-H1 and tubulin in the corresponding total cell lysates. The graphs show mean ± SE from n = 3 (E–G), 4 (A, B), or 8 (C, D) independent experiments.
FIGURE 6:
FIGURE 6:
TNF–α-induced Rac activation and stimulation of GEF-H1 toward Rac do not require EGFR and ERK. LLC-PK1 cells were treated with 20 μM PD98059 (A, B) or 10 μM AG1478 (C, D) for 15 min, followed by addition of 10 ng/ml TNF-α for 5 min (A, C) or 2 min (B, D). In A and C, active Rac was precipitated using GST-PBD. In B and D, active GEFs were precipitated using GST-Rac(G15A), and GEF-H1 was detected by Western blotting. Densitometric analysis was done as described. The graphs show mean ± SE from n = 4 (A–C) or 3 (D) independent experiments.
FIGURE 7:
FIGURE 7:
Differential role of the GEF-H1 T678 and S885 phosphorylation sites in GEF-H1 activation toward Rac and RhoA. LLC-PK1 cells were transfected with GFP-tagged wild-type GEF-H1 (GEF-H1WT) or the nonphosphorylatable point mutant GEF-H1T678A or GEF-H1S885A as indicated. At 48 h posttransfection, cells were treated with 10 ng/ml TNF-α (5 min), and activated GEFs were precipitated using RhoA(G17A) (A, C) or Rac(G15A) (B, D). The GFP-tagged GEF-H1 protein was detected by Western blotting using anti-GFP. The blots were quantified as described earlier. The graphs show mean ± SE from n = 4 (A, D) or 3 (B and C) independent experiments.
FIGURE 8:
FIGURE 8:
(A, B) Differential role of T678 and S885 in TNF-α–induced ERK activation. (A) LLC-PK1 cells grown in 6-cm dishes were transfected with 100 nM NR or GEF-H1–specific siRNA and 24 h later with GFP-GEF-H1T678A or GFP- GEF-H1TS885A along with HA-ERK2. (B) Cells were transfected with GEF-H1 shRNA along with HA-ERK with or without GFP- GEF-H1T678A or GFP- GEF-H1TS885A. Details of the transfection are described in Materials and Methods. Cells were treated with 10 ng/ml TNF-α as indicated, and HA-ERK was immunoprecipitated and its phosphorylation detected using Western blotting as in Figure 2D. GEF-H1 and GFP were also detected in the cell lysates to assess down-regulation of endogenous GEF-H1 and expression of the GFP-tagged mutants. (C, D) Role of S885 in GEF-H1 activation toward RhoA. LLC-PK1 cells were transfected with GFP-GEF-H1WT, GFP-GEF-H1S885A, or GFP-GEF-H1T678D (labeled as TD) or GFP-GEF-H1T678D/S885A (labeled as TD/SA) as indicated. Activated GFP-GEF-H1 was precipitated using RhoA(G17A) and detected by Western blotting with anti-GFP, as described earlier. In C, p38 in the cell lysates was also detected. Note that the transfected FLAG-tagged p38 is visualized as an additional, higher band (see arrows). Throughout the figure representative blots of three independent experiments are shown.
FIGURE 9:
FIGURE 9:
TNF-α enhances epithelial migration through GEF-H1, TACE, and ERK. (A, B) GEF-H1 mediates TNF-α–induced enhanced migration. LLC-PK1 cells were transfected with NR or GEF-H1-specific siRNA and 24 h later plated into wells of an ECIS 8W1E array and grown with continuous measurement of C at 32 kHz until confluence was reached (indicated by C reaching its minimum value). Next a wound was generated by applying an elevated voltage pulse. Where indicated, before wounding the cells were treated with 20 ng/ml TNF-α. Recovery of the layer was monitored by measuring C at 32 kHz. Typical recovery curves are shown. The graph in B shows the half–recovery times for each condition, calculated as described in Materials and Methods. Values for the controls were taken as unity, and the other conditions were expressed as fold changes. Mean ± SEM of n = 4 independent experiments performed in duplicate. Note that although the trend was detectable in all experiments, the combined data do not reach statistical significance. (C–E) TACE and ERK are required for TNF-α–induced enhanced migration. Wound-healing assays using LLC-PK1 cells were performed as described. Where indicated, before wounding the cells were treated with 20 ng/ml TNF-α with or without 10 μM TAPI-1 or PD98059. In E, half–recovery times are shown (mean ± SEM of n = 4 independent experiments, performed in duplicate).
FIGURE 10:
FIGURE 10:
The proposed mechanism of TNF-α–induced TACE and subsequent EGFR/ERK/GEF-H1/RhoA activation.

Similar articles

Cited by

References

    1. Argast GM, Campbell JS, Brooling JT, Fausto N. Epidermal growth factor receptor transactivation mediates tumor necrosis factor-induced hepatocyte replication. J Biol Chem. 2004;279:34530–34536. - PubMed
    1. Benais-Pont G, Punn A, Flores-Maldonado C, Eckert J, Raposo G, Fleming TP, Cereijido M, Balda MS, Matter K. Identification of a tight junction-associated guanine nucleotide exchange factor that activates Rho and regulates paracellular permeability. J Cell Biol. 2003;160:729–740. - PMC - PubMed
    1. Birkenfeld J, Nalbant P, Bohl BP, Pertz O, Hahn KM, Bokoch GM. GEF-H1 modulates localized RhoA activation during cytokinesis under the control of mitotic kinases. Dev Cell. 2007;12:699–712. - PMC - PubMed
    1. Birkenfeld J, Nalbant P, Yoon SH, Bokoch GM. Cellular functions of GEF-H1, a microtubule-regulated Rho-GEF: is altered GEF-H1 activity a crucial determinant of disease pathogenesis. Trends Cell Biol. 2008;18:210–219. - PubMed
    1. Birukova AA, Fu P, Xing J, Yakubov B, Cokic I, Birukov KG. Mechanotransduction by GEF-H1 as a novel mechanism of ventilator-induced vascular endothelial permeability. Am J Physiol Lung Cell Mol Physiol. 2010;298:L837–L848. - PMC - PubMed

Publication types

MeSH terms