. 2013 Apr;24(7):964-81.
doi: 10.1091/mbc.E12-10-0742. Epub 2013 Feb 6.

Critical residues in the PMEL/Pmel17 N-terminus direct the hierarchical assembly of melanosomal fibrils

Affiliations

Critical residues in the PMEL/Pmel17 N-terminus direct the hierarchical assembly of melanosomal fibrils

Ralf M Leonhardt et al. Mol Biol Cell. 2013 Apr.

Abstract

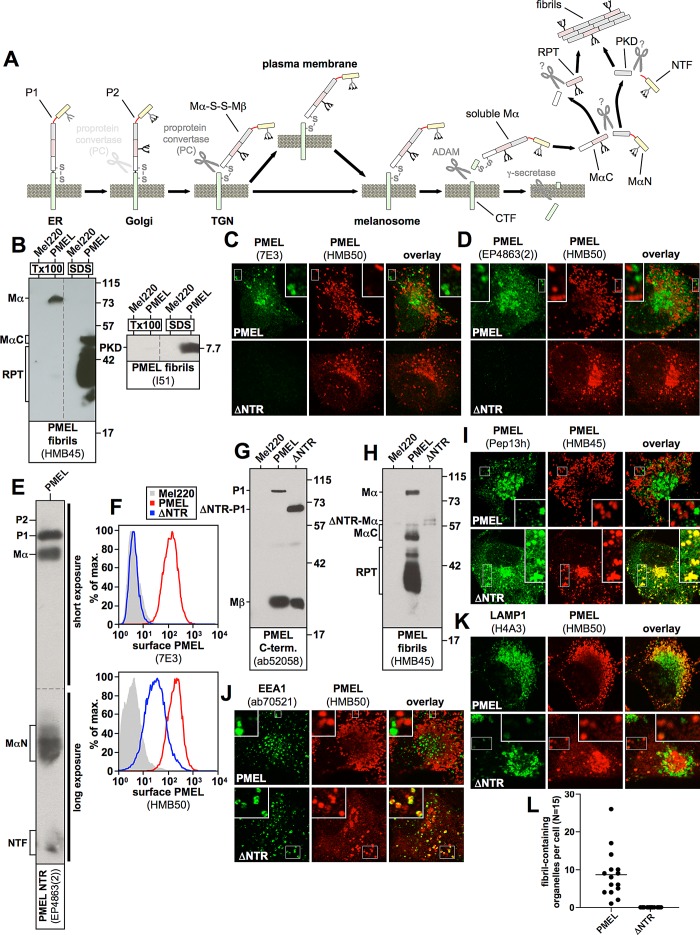
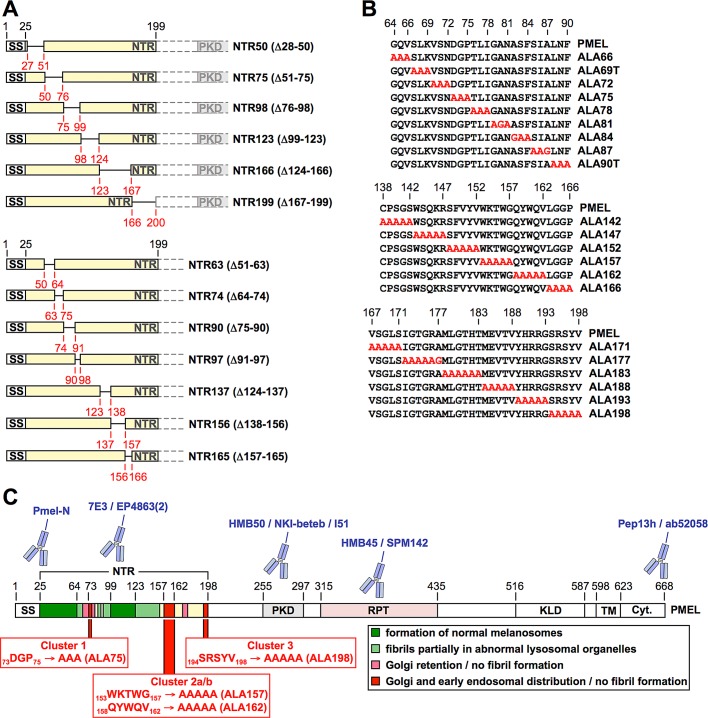
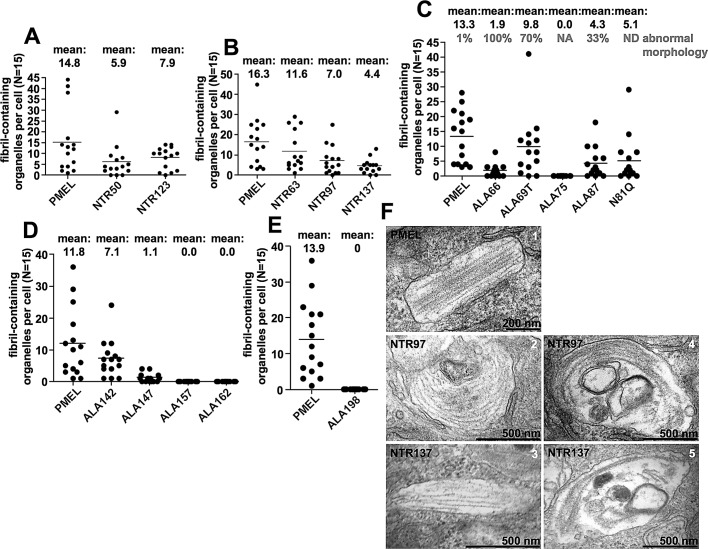
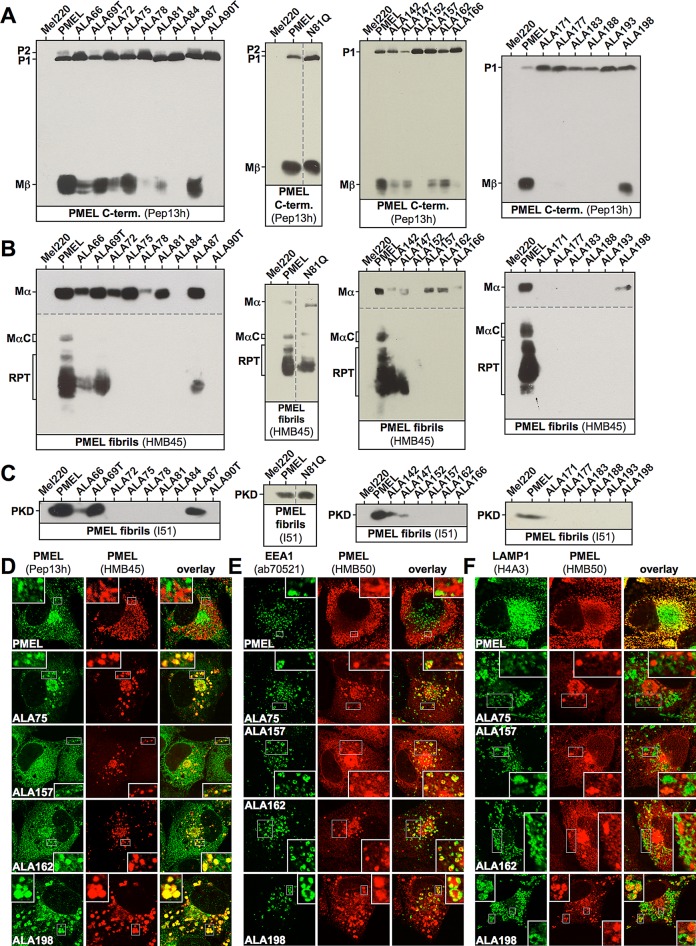
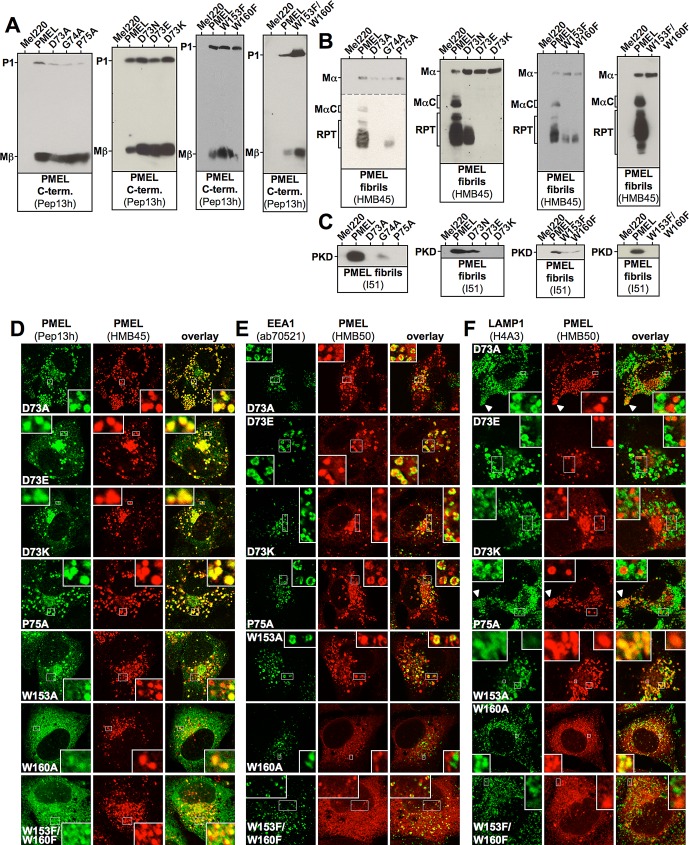
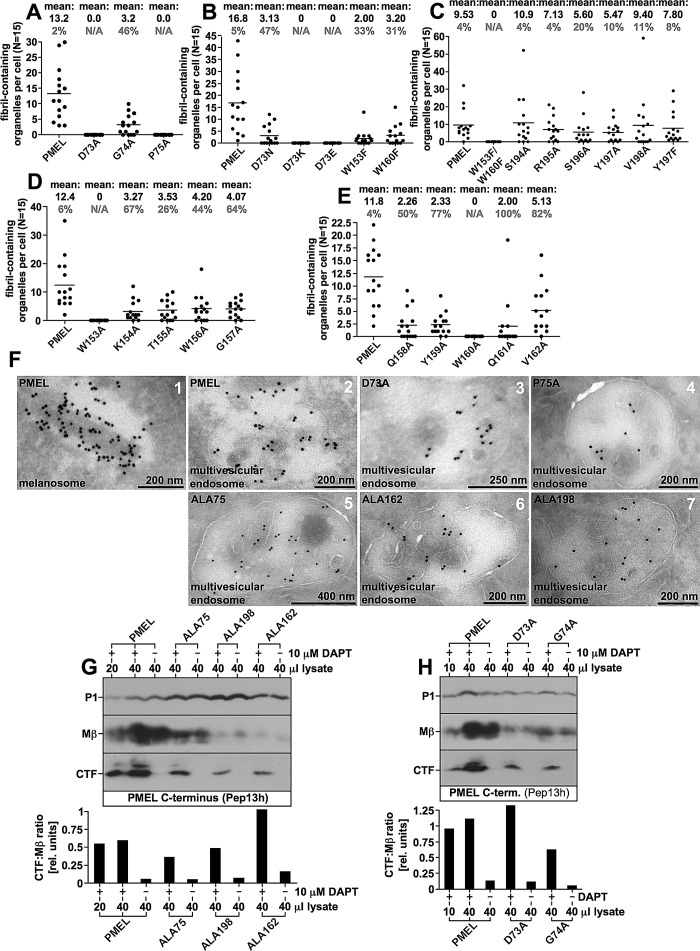
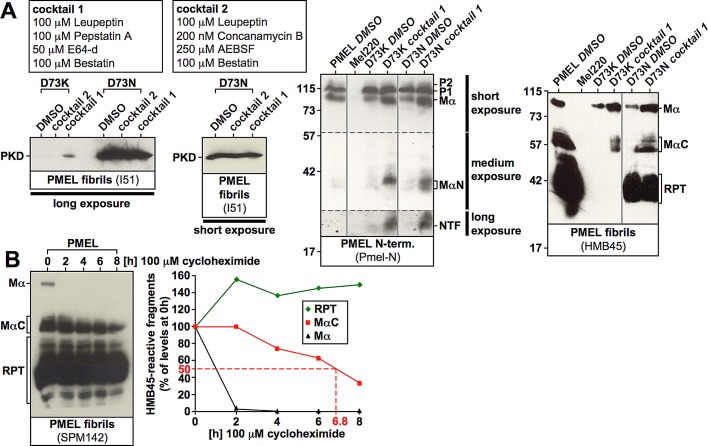
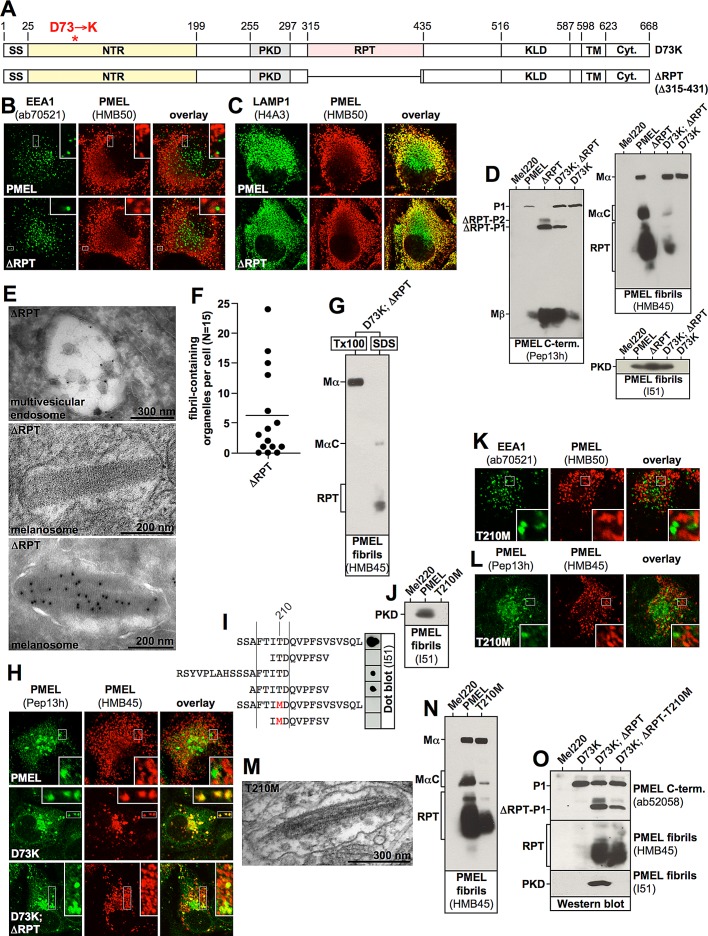
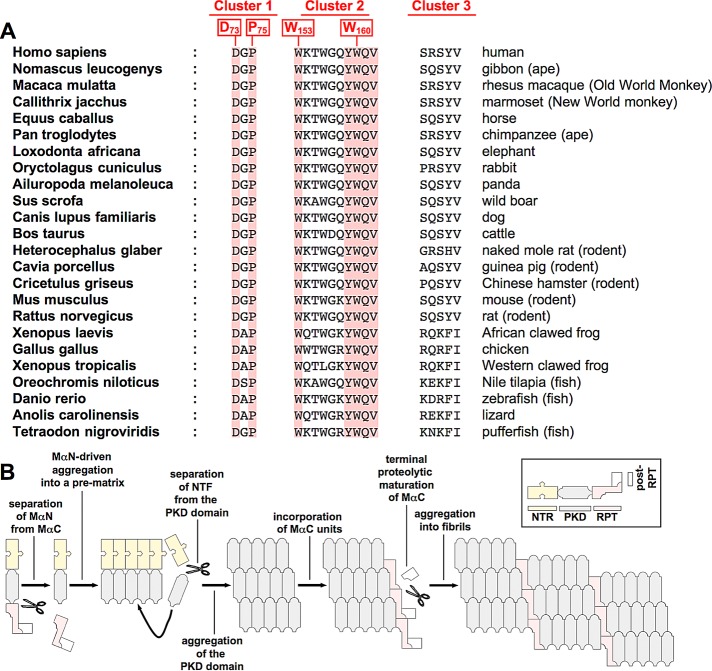
PMEL (also called Pmel17 or gp100) is a melanocyte/melanoma-specific glycoprotein that plays a critical role in melanosome development by forming a fibrillar amyloid matrix in the organelle for melanin deposition. Although ultimately not a component of mature fibrils, the PMEL N-terminal region (NTR) is essential for their formation. By mutational analysis we establish a high-resolution map of this domain in which sequence elements and functionally critical residues are assigned. We show that the NTR functions in cis to drive the aggregation of the downstream polycystic kidney disease (PKD) domain into a melanosomal core matrix. This is essential to promote in trans the stabilization and terminal proteolytic maturation of the repeat (RPT) domain-containing MαC units, precursors of the second fibrillogenic fragment. We conclude that during melanosome biogenesis the NTR controls the hierarchical assembly of melanosomal fibrils.


Figures

FIGURE 1:
FIGURE 1:
(A) The PMEL maturation pathway. PMEL is inserted into the endoplasmic reticulum membrane in the so-called P1 form. After its release into the Golgi apparatus, N-linked oligosaccharides mature, and additional O-linked glycosylation is added, giving rise to the P2 form. Starting in the medial Golgi or in the trans-Golgi network, PMEL undergoes cleavage by a proprotein convertase, which separates the luminal fragment Mα from the membrane-standing fragment Mβ (S1 cleavage). These fragments, however, remain linked to each other by a disulfide bridge. In this form (Mα-S-S-Mβ) the protein is, either directly or via the plasma membrane, delivered into stage I melanosomes, which represent a specialized multivesicular early endosome. PMEL is originally targeted to the limiting membrane of this organelle but subsequently buds into the interior in a process dependent on the tetraspanin CD63. Next a metalloprotease of the ADAM family liberates the soluble Mα fragment from the membrane (S2 cleavage), and the remaining truncated portion of Mβ (called the CTF fragment) is degraded by γ-secretase (S3 cleavage). After this, Mα is cleaved by an unknown protease between the PKD and the RPT domain, giving rise to two halves—the N-terminal fragment, MαN, and the C-terminal fragment, MαC. Both MαN and MαC undergo further processing, which eventually liberates the PKD-containing fibrillogenic fragment, as well as a ladder of fibril-associated fragments containing the RPT domain. These two types of fragments assemble into the characteristic PMEL fibrils. The NTR is not or only to a minor extent part of the fibrils. (B) MαC, the mature RPT domain, and the mature PKD are distributed in the fibril-containing Triton X-100–insoluble fraction. Cells were extracted in 2% Triton X-100 for 1 h and centrifuged at 100,000 × g for 10 min before supernatant was removed and analyzed by SDS–PAGE and Western blotting (left lanes labeled Tx100 in both blots). The Triton X-100–insoluble pellet was resuspended in PBS/1% SDS/1% β-mercaptoethanol and incubated for 10 min at room temperature, followed by 10 min at 100°C, and analyzed on the same gel (right lanes labeled SDS in both blots). Vertical dashed lines indicate where irrelevant lanes have been removed from the image. (C, D) The indicated cell lines were analyzed by IF using antibodies against PMEL fibrils (HMB50) and either antibody 7E3, raised against full-length recombinant PMEL (C), or antibody EP4863(2), raised against a peptide located within the first 100 amino acids of the PMEL NTR (D). Note that both 7E3 and EP4863(2) do not recognize the NTR deletion mutant ΔNTR, display a staining pattern limited to the ER, Golgi, and endosomes (but not stage II melanosomes), and fail to colocalize with HMB50-reactive fibrils. (E) Western blot analysis of a lysate derived from PMEL-expressing Mel220 cells. Note that antibody EP4863(2) specifically recognizes PMEL fragments that contain the NTR, such as P1, P2, Mα, MαN, and NTF. (F) The indicated transfectants were surface labeled with antibody HMB50 against folded PMEL (bottom) or PMEL-specific antibody 7E3 (top) and analyzed by flow cytometry. Note that antibody 7E3 does not recognize construct ΔNTR. (G, H) Western blot analysis of SDS-lysed total membranes using PMEL-specific antibodies ab52058 (G) and HMB45 (H). (I–K) The indicated cell lines were analyzed by IF using antibodies against newly synthesized (Pep13h) and mature (HMB45) PMEL (I), the early endosomal marker EEA1 (ab70521) and mature PMEL (HMB50; J), or the lysosomal marker LAMP1 (H4A3) and mature PMEL (HMB50; K). Note that the HMB45/HMB50-reactive population of ΔNTR but not of wt-PMEL colocalizes with the respective newly synthesized, Pep13h-reactive population (I) partially in endosomes with intense peripheral EEA1 decoration (J; see Supplemental Table S1). Only mature wt-PMEL distributes into the characteristic melanosomal horseshoe-shaped band wrapping around the perinuclear LAMP1high zone (K). (L) Quantification of the EM analysis of Epon-embedded Mel220 transfectants showing the number of fibril-containing organelles per cell (n = 15).
FIGURE 2:
FIGURE 2:
A functional map of the PMEL NTR. (A, B) Schematic representation of PMEL NTR deletion (A) and alanine-scanning (B) mutants. (C) Domain organization of PMEL and functional map of the NTR. This figure summarizes the findings shown in Figures 3 and 4 and Supplemental Figures S1–S3. The color code indicates largely dispensable regions in the NTR (dark green) and regions that when mutationally targeted cause at least partial deposition of fibrils in lysosomes (light green), Golgi retention (pink), or the phenotype observed with deletion of the entire NTR (red). Regions that when targeted by alanine-scanning mutagenesis resulted in ER retention and strongly reduced reactivity with conformation-sensitive antibodies such as HMB50 are shown in yellow. Clusters 1–3, which were subsequently targeted by single-alanine exchanges, are highlighted. PMEL-specific antibodies used in this study are pictographically assigned to the domains that they recognize. See also Table 1 and Supplemental Table S1.
FIGURE 3:
FIGURE 3:
Fibril formation by PMEL NTR deletion and alanine-scanning mutants. (A–E) Quantification of the EM analysis of Epon-embedded Mel220 transfectants showing the number of fibril-containing organelles per cell (n = 15). (F) EM images for mutants NTR97 and NTR137. The quantification of fibril formation shown in A–E is based on images like these and those shown in Supplemental Figure S2B. Note that mutants NTR97 and NTR137 form fibrils in both conventional melanosomes (left) and abnormal organelles sharing lysosomal characteristics (right).
FIGURE 4:
FIGURE 4:
Proteolytic maturation and subcellular distribution of PMEL NTR alanine-scanning mutants. (A–C) Western blot analysis of SDS-lysed total membranes using PMEL-specific antibodies Pep13h (A), HMB45 (B), and I51 (C). Vertical dashed lines indicate positions where irrelevant lanes have been removed from the image. Horizontal dashed lines separate different exposures of the same blot. (D–F) Selected cell lines from A–C were analyzed by IF using antibodies against newly synthesized (Pep13h) and mature (HMB45) PMEL (D), the early endosomal marker EEA1 (ab70521) and mature PMEL (HMB50; E), or the lysosomal marker LAMP1 (H4A3) and mature PMEL (HMB50; F). Note that the HMB45/HMB50-reactive population of the indicated alanine-scanning mutants but not of wt-PMEL colocalizes with the respective newly synthesized, Pep13h-reactive population (D) partially in endosomes with intense peripheral EEA1 decoration (E; see Supplemental Table S1). Only mature wt-PMEL distributes into the characteristic melanosomal horseshoe-shaped band wrapping around the perinuclear LAMP1high zone (F). The corresponding IF data for the other mutants in A–C are shown in Supplemental Figures S3 and S1, D and E.
FIGURE 5:
FIGURE 5:
Trafficking and processing of selected PMEL NTR point mutants. (A–C) Western blot analysis of SDS-lysed total membranes using PMEL-specific antibodies Pep13h (A), HMB45 (B), and I51 (C). Horizontal dashed lines separate different exposures of the same blot. (D–F) Selected cell lines from A–C and Supplemental Figure S4, A–C, were analyzed by IF using antibodies against newly synthesized (Pep13h) and mature (HMB45) PMEL (D), the early endosomal marker EEA1 (ab70521) and mature PMEL (HMB50; E), or the lysosomal marker LAMP1 (H4A3) and mature PMEL (HMB50;F). The corresponding IF data for the other point mutants generated for this study are shown in Supplemental Figures S4 and S5.
FIGURE 6:
FIGURE 6:
Fibril formation, trafficking, and S2 processing of selected PMEL NTR mutants. (A–E) EM analysis of Epon-embedded Mel220 transfectants (see Supplemental Figure S6 for respective electron micrographs). Quantification of fibril formation (n = 15) is shown. Percentage abnormal organelles is shown in gray. (F) Selected NTR mutants were analyzed by cryo–immuno EM using the PMEL-specific antibody HMB45. Note the labeling on ILVs. (G, H) Selected NTR mutants were treated with the γ-secretase inhibitor DAPT or dimethyl sulfoxide for 2.5 h and analyzed by Western blot using the PMEL-specific antibody Pep13h (top). CTF:Mβ ratios were determined densitometrically and are represented as bars (bottom).
FIGURE 7:
FIGURE 7:
Proteolytic processing proceeds largely normally in NTR mutants. (A) Cells expressing nonfunctional D73K (see Figure 6B) or partially functional D73N (see Figure 6B and Supplemental Figure S6A, 11A and 11B) were treated with dimethyl sulfoxide or either of two protease inhibitor cocktails for 6.5 h before total membranes were prepared, lysed in SDS, and analyzed by Western blot using the PMEL-specific antibodies I51, Pmel-N, and HMB45. A long and a short exposure of the same I51-stained blot are shown to the left. Vertical solid lines indicate positions where irrelevant lanes have been removed from the image. Horizontal dashed lines separate different exposures of the same blot. (B) Cells expressing wt-PMEL were treated with 100 μM cycloheximide for up to 8 h, and SDS-lysed total membranes were analyzed by Western blot using the antibody SPM142, which recognizes the RPT domain (left). Band intensities were determined densitometrically (right).
FIGURE 8:
FIGURE 8:
The NTR and the PKD must be provided in cis for fibril formation but can stabilize the RPT domain–containing MαC fragments in trans. (A) Schematic representation of the PMEL mutant ΔRPT. (B, C) Mel220 cells expressing wt-PMEL or ΔRPT were analyzed by IF using antibodies against the early endosomal marker EEA1 (ab70521) and mature PMEL (HMB50; B) or the lysosomal marker LAMP1 (H4A3) and mature PMEL (HMB50; C). (D) SDS-lysed total membranes derived from cells expressing wt-PMEL, ΔRPT, or D73K or coexpressing ΔRPT and D73K were analyzed by Western blot using the PMEL-specific antibodies Pep13h, HMB45, and I51. (E) Mel220 transfectants stably expressing ΔRPT were analyzed by EM (Epon-embedded cells; middle) or cryo–immuno EM using the PMEL-specific antibody HMB50 (top and bottom). (F) EM analysis of Epon-embedded Mel220 transfectants expressing ΔRPT. Quantification of fibril formation (n = 15) is shown. (G) D73K-derived MαC and mature RPT domain stabilized by a coexpressed ΔRPT construct are distributed in the Triton X-100–insoluble fibril fraction, whereas D73K-derived Mα remains Triton X-100 soluble. A total membrane fraction was extracted in 1% Triton X-100 for 1 h and centrifuged at 100,000 × g for 45 min before supernatant was removed and analyzed by SDS–PAGE and Western blotting (left lane labeled Tx100). The Triton X-100–insoluble pellet was resuspended in PBS/1% SDS/1% β-mercaptoethanol and incubated for 10 min at room temperature, followed by 10 min at 100°C and analyzed on the same gel (right lane labeled SDS). (H) Cells expressing wt-PMEL or D73K or coexpressing ΔRPT and D73 were analyzed by IF using the PMEL-specific antibodies Pep13h and HMB45. (I) The indicated synthetic peptides were adsorbed to nitrocellulose membrane, and a dot blot was performed using antibody I51. Note that the exchange of threonine 210 to methionine abrogates the recognition of the peptide by the antibody (compare lane 1 to lane 5). (J) SDS-lysed total membranes derived from cells expressing wt-PMEL or T210M were analyzed by Western blot using the PMEL-specific antibody I51. (K, L) Mel220 cells expressing T210M were analyzed by IF using antibodies against the early endosomal marker EEA1 (ab70521) and mature PMEL (HMB50;K) or the PMEL-specific antibodies Pep13h and HMB45 (L). (M) Mel220 transfectants stably expressing T210M were analyzed by EM (Epon-embedded cells). (N) SDS-lysed total membranes derived from cells expressing wt-PMEL or T210M were analyzed by Western blot using the PMEL-specific antibody HMB45. (O) SDS-lysed total membranes derived from cells expressing D73K alone, coexpressing ΔRPT and D73K, or coexpressing I51-nonreactive ΔRPT-T210M and D73K were analyzed by Western blot using the PMEL-specific antibodies ab52058, HMB45, and I51.
FIGURE 9:
FIGURE 9:
(A) Evolutionary conservation of amino acid residues in clusters 1–3 (see Figure 2C for the definition and position of the three clusters). (B) Model of PMEL fibril formation. The NTR is required in cis to first drive the aggregation of the PKD-containing fibrillogenic fragment into an amyloid core matrix. MαC is then incorporated in a second step, promoting stability and the terminal proteolytic maturation of this fragment. Coaggregation of PKD and the RPT domain eventually leads to the formation of mature fibrils.

Similar articles

Cited by

References

    1. Berson JF, Harper DC, Tenza D, Raposo G, Marks MS. Pmel17 initiates premelanosome morphogenesis within multivesicular bodies. Mol Biol Cell. 2001;12:3451–3464. - PMC - PubMed
    1. Berson JF, Theos AC, Harper DC, Tenza D, Raposo G, Marks MS. Proprotein convertase cleavage liberates a fibrillogenic fragment of a resident glycoprotein to initiate melanosome biogenesis. J Cell Biol. 2003;161:521–533. - PMC - PubMed
    1. Bogan AA, Thorn KS. Anatomy of hot spots in protein interfaces. J Mol Biol. 1998;280:1–9. - PubMed
    1. Carrithers MD, Chatterjee G, Carrithers LM, Offoha R, Iheagwara U, Rahner C, Graham M, Waxman SG. Regulation of podosome formation in macrophages by a splice variant of the sodium channel SCN8A. J Biol Chem. 2009;284:8114–8126. - PMC - PubMed
    1. Dimberu PM, Leonhardt RM. Cancer immunotherapy takes a multi-faceted approach to kick the immune system into gear. Yale J Biol Med. 2011;84:371–380. - PMC - PubMed

Publication types

MeSH terms

LinkOut - more resources