

Temporal development of muscle atrophy in murine model of arthritis is related to disease severity
- PMID: 23389765
- PMCID: PMC3774915
- DOI: 10.1007/s13539-013-0102-1
Temporal development of muscle atrophy in murine model of arthritis is related to disease severity
Abstract
Background: Rheumatoid arthritis (RA) is an inflammatory autoimmune disease of unknown etiology, affecting mainly the joint but also other tissues. RA patients usually present weakness and muscle atrophy, nonarticular manifestations of the disease. Although causing great impact, the understanding of muscle atrophy, its development, and the mechanisms involved is still very limited. The objective of this study is to evaluate the development of muscle atrophy in skeletal muscle of a murine model of arthritis.
Methods: The experimental murine model of collagen-induced arthritis (CIA) was used. DBA/1J mice were randomly divided into three groups: control (CO, n = 25), sham arthritis (SA, n = 25), and arthritis (CIA, n = 28), analyzed in different time points: 25, 35, and 45 days after the induction of arthritis. The arthritis development was followed by clinical scores and hind paw edema three times a week. The spontaneous exploratory locomotion and weight were evaluated weekly. In all time points, serum was collected before the death of the animals for cytokine analysis, and myofiber cross-sectional areas (CSA) of gastrocnemius (GA) and tibialis anterior (TA) skeletal muscles were evaluated.
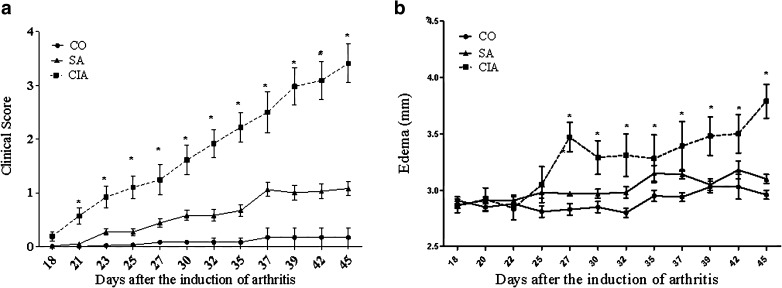
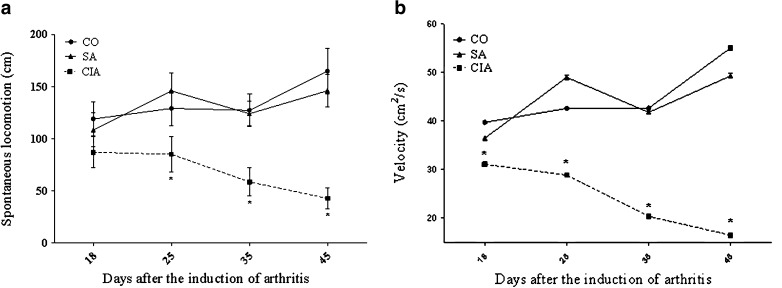
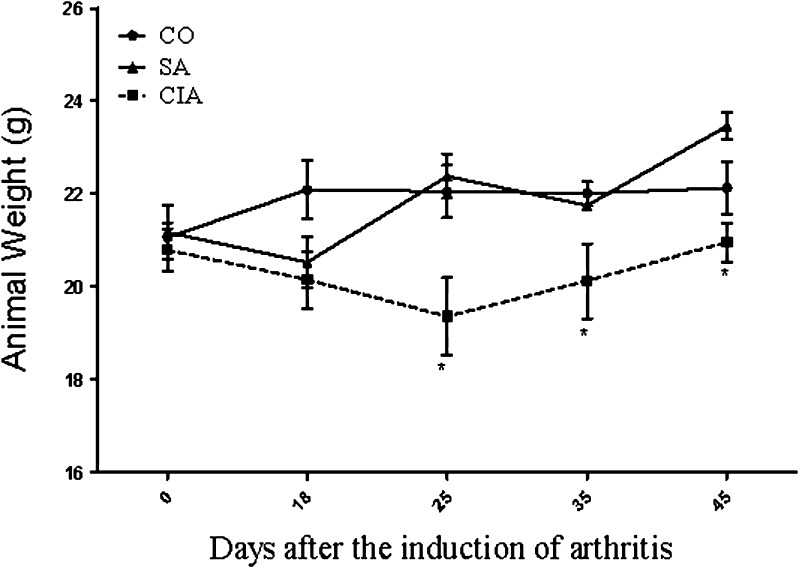
Results: The clinical parameters of arthritis progressively increased in CIA in all experimental times, demonstrating the greatest difference from other groups at 45 days after induction (clinical score: CO, 00 ± 00; SA, 1.00 ± 0.14; CIA, 3.28 ± 0.41 p > 0.05). The CIA animals had lower weights during all the experimentation periods with a difference of 6 % from CO at 45 days (p > 0.05). CIA animals also demonstrated progressive decrease in distance walked, with a reduction of 54 % in 35 and 74 % at 45 days. Cytokine analysis identified significant increase in IL-6 serum levels in CIA than CO and SA in all experimental times. CSA of the myofiber of GA and TA was decreased 26 and 31 % (p > 0.05) in CIA in 45 days after the induction of disease, respectively. There was significant and inverse correlation between the disease clinical score and myofiber CSA in 45 days (GA: r = -0.71; p = 0.021).
Conclusion: Our results point to a progressive development of muscle wasting, with premature onset arthritis. These observations are relevant to understand the development of muscle loss, as well as for the design of future studies trying to understand the mechanisms involved in muscle wasting. As far as we are concerned, this is the first study to evaluate the relation between disease score and muscle atrophy in a model of arthritis.
Figures

References
-
- da Rochal OM, et al. Sarcopenia da caquexia reumatoide:conceituação, mecanismos, consequências clínicas e tratamentos possíveis. Rev Bras Reumatol. 2009;49:288–301. doi: 10.1590/S0482-50042009000300010. - DOI
LinkOut - more resources
Full Text Sources
Other Literature Sources
Research Materials
