. 2013 Apr;2(2):243-58.
doi: 10.1002/mbo3.71. Epub 2013 Feb 7.

Burkholderia cenocepacia conditional growth mutant library created by random promoter replacement of essential genes

Affiliations

Burkholderia cenocepacia conditional growth mutant library created by random promoter replacement of essential genes

Ruhi A M Bloodworth et al. Microbiologyopen. 2013 Apr.

Abstract

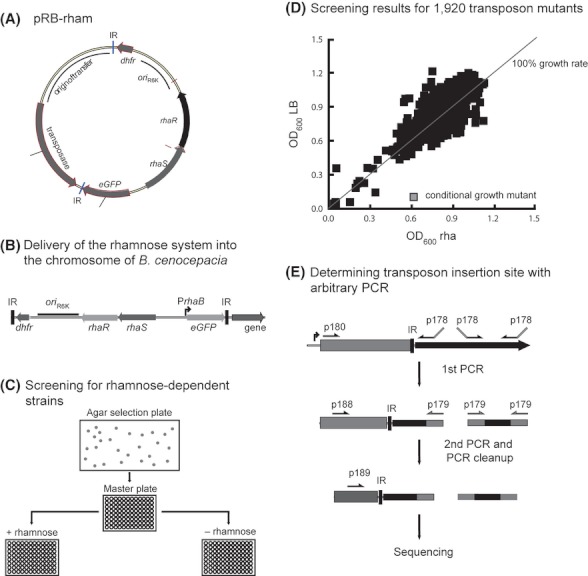
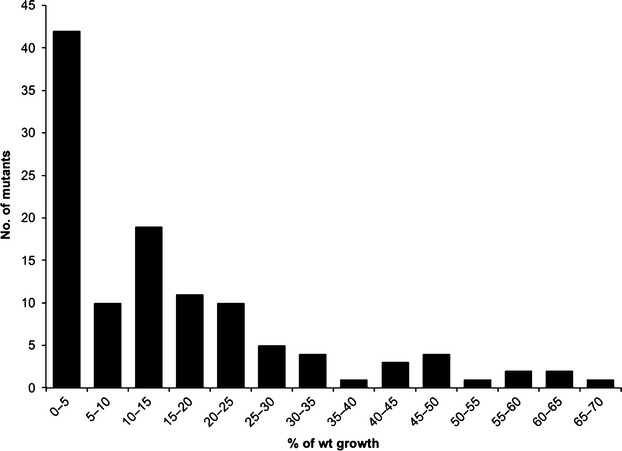
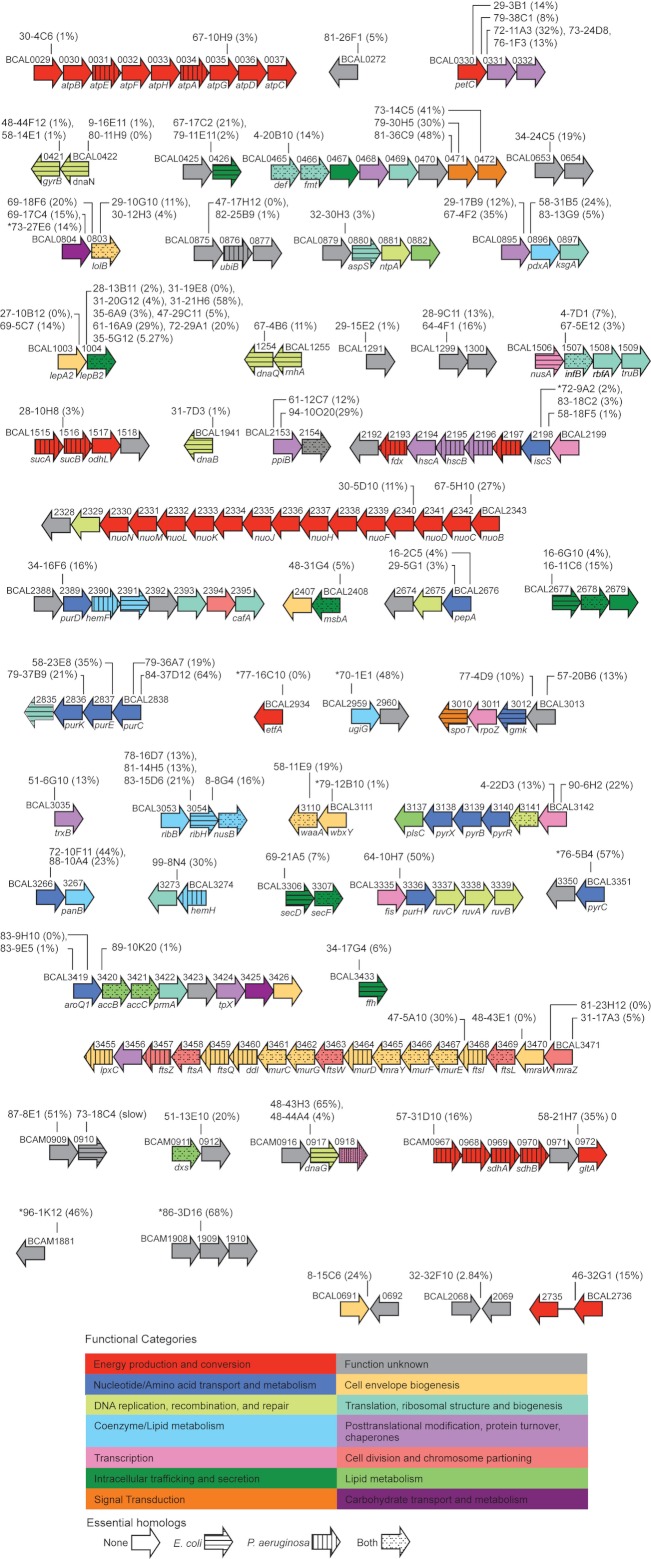
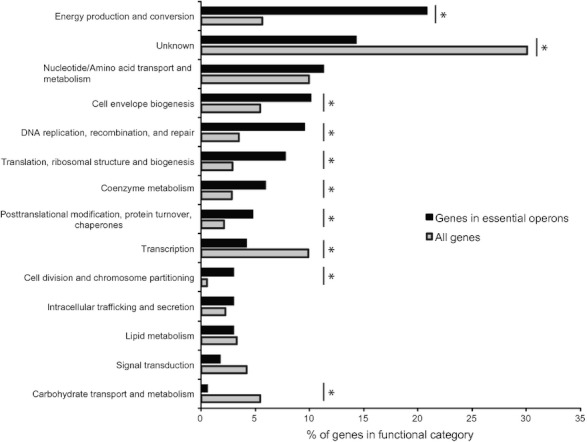
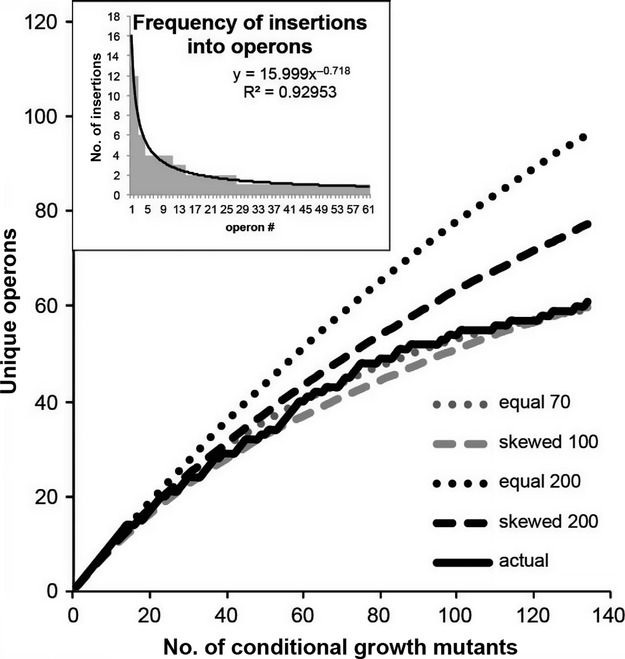
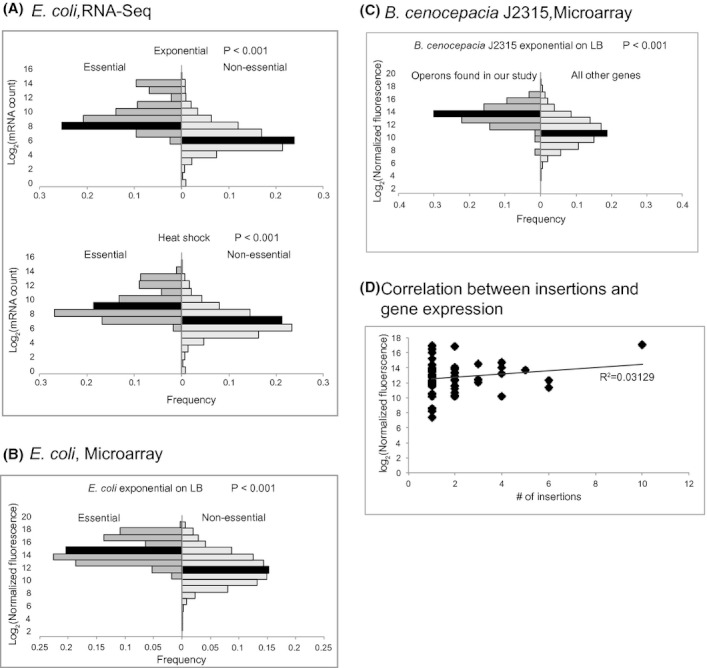
Identification of essential genes by construction of conditional knockouts with inducible promoters allows the identification of essential genes and creation of conditional growth (CG) mutants that are then available as genetic tools for further studies. We used large-scale transposon delivery of the rhamnose-inducible promoter, PrhaB followed by robotic screening of rhamnose-dependent growth to construct a genomic library of 106 Burkholderia cenocepacia CG mutants. Transposon insertions were found where PrhaB was in the same orientation of widely conserved, well-characterized essential genes as well as genes with no previous records of essentiality in other microorganisms. Using previously reported global gene-expression analyses, we demonstrate that PrhaB can achieve the wide dynamic range of expression levels required for essential genes when the promoter is delivered randomly and mutants with rhamnose-dependent growth are selected. We also show specific detection of the target of an antibiotic, novobiocin, by enhanced sensitivity of the corresponding CG mutant (PrhaB controlling gyrB expression) within the library. Modulation of gene expression to achieve 30-60% of wild-type growth created conditions for specific hypersensitivity demonstrating the value of the CG mutant library for chemogenomic experiments. In summary, CG mutants can be obtained on a large scale by random delivery of a tightly regulated inducible promoter into the bacterial chromosome followed by a simple screening for the CG phenotype, without previous information on gene essentiality.


Figures

Figure 1
Figure 1
Construction of a Burkholderia cenocepacia CG mutant library. (A) Transposon vector pBR-rham is a derivative of pSCrhaBoutgfp (Cardona et al. 2006). See Experimental Procedures for details on plasmid construction. (B) Trimethoprim resistance provided by the dhfr cassette was used to select for the transconjugants containing an outward-facing rhamnose-inducible promoter PrhaB. (C) The transconjugants were robotically picked into 96- or 384-well master plates before being robotically replicated into 96- or 384-well secondary plates containing LB with and without rhamnose. (D) The OD600nm of the plates were read after 16 h and mutants showing at least 50% less growth in the absence of rhamnose were included in the library. (E) The insertion sites of the mutants were primarily determined using arbitrary primed PCR to preferentially amplify the transposon–genome junction and sequenced using a transposon-specific primer.
Figure 2
Figure 2
Histogram of growth for 115 CG mutants in the absence of rhamnose. Burkholderia cenocepacia K56-2 (wild-type) and CG mutants were grown in LB without rhamnose and OD600nm was measured after 22 h. Percentage of wild-type growth was defined as the growth of CG mutants relative to that of B. cenocepacia K56-2. Bars represent the total number of CG mutants with percent of wild-type growth within the range indicated by flanking numbers.
Figure 3
Figure 3
The 50 putative essential operons identified in Burkholderia cenocepacia 56-2. Each block represents a putative essential operon, and each arrow represents a gene. Operons include genes downstream from the mutant insertion sites according to OperonDB or DOOR. Genes are ordered according to the locus names of the B. cenocepacia J2315 genome. For each mutant, the strain name and the approximate location of the PrhaB are indicated by vertical lines. Exact location of insertion sites are listed in Table S1. Mutants where the location of the transposon insertion site could not be determined at the nucleotide level are indicated with an asterisk. The percentage of wild-type growth in the absence of rhamnose is found between brackets beside the strain name. Genes are color coded according to putative function and black patterns indicate essentiality of homologs in Escherichia coli (horizontal), Pseudomonas aeruginosa (vertical), or both (spots). Three mutant strains, 46-32G1, 8-15C6, and 32-32F10, whose insertion sites and conditional-growth phenotypes are confirmed but no downstream genes appear to be part of the same operon, are shown separately at the end.
Figure 4
Figure 4
Functional categories of genes in putative essential operons. Putative gene function is based on the GO (Gene Ontology) and COG (Cluster of Orthologous Genes) annotations. For each functional category, Pearson's chi-squared test was used to determine whether the occurrence of the category in the entire genome differs statistically from its occurrence in the putative essential genes identified in this study. A star indicates a P-value of less than 0.05.
Figure 5
Figure 5
The rate at which new operons were discovered. The rate at which unique operons were discovered experimentally (actual) is compared with four simulations averaging 100 trials of 200, 100, or 70 essential operons, assuming either that every essential operon is equally likely to be detected (equal) or that the observed frequency distribution applies to all essential operons (skewed). The inset shows the frequency at which essential operons were discovered experimentally.
Figure 6
Figure 6
The distribution of gene expression in putatively essential and nonessential genes. The black bars contain the median level of gene expression for each class. The distribution of expression between essential and nonessential genes for each species/condition/methodology was compared using a Mann–Whitney test. Median values, U statistic, and number (n) of essential and nonessential genes are as follows. (A) Exponentially growing cells (median mRNA transcripts: 364.7 essential, 51.8 nonessential, U = 893,584, P < 0.001), heat-shock treatment (median mRNA transcripts: 294 essential, 69.3 nonessential, U = 786,268, P < 0.001) nnonessential = 4038, nessential = 280; (B) cDNA microarray for exponentially growing cells (median fluorescence: 16,700.09 essential, 3328.65 nonessential, U = 701,538, nessential = 280, nnonessential = 3868, P < 0.001); (C) cDNA microarray for Burkholderia cenocepacia J2315 (median fluorescence: 10,448.6 operons in library, 1864.7 other genes, U = 346,475, nessential = 6875, nnonessential = 63, P < 0.001); (D) There is no correlation between levels of gene expression and the frequency at which insertions into an operon were recovered.
Figure 7
Figure 7
Genetic duplication in Burkholderia cenocepacia J2315, Pseudomonas aeruginosa PA01, and Escherichia coli K12 as a function of DNA sequence similarity. For each strain, the genome was downloaded from the Genome directory of NCBI and a BLAST database was built containing all annotated coding regions. For each gene, similar genes within the same genome were identified using blastn with an expect cutoff of 0.1. Stringency cutoff was defined by percent coverage in the gene alignment and % sequence identity. A stringency cutoff of 40%, for example, means that both percent coverage and sequence identity between two genes are equal or higher than 40%. A gene was included in the same paralogous group when percent coverage and percent identity with at least one member of the group satisfied the stringency cutoff. The inset shows a scaled-up figure of the 60–100 stringency cutoff. Note that paralogous group denotes genes that meet the required conditions for inclusion within the group without any reference to gene history or gene evolution.

References

    1. Akerley BJ, Rubin EJ, Novick VL, Amaya K, Judson N, Mekalanos JJ. A genome-scale analysis for identification of genes required for growth or survival of Haemophilus influenzae. Proc. Natl. Acad. Sci. USA. 2002;99:966–971. - PMC - PubMed
    1. Altschul SF, Gish W, Miller W, Myers EW, Lipman DJ. Basic local alignment search tool. J. Mol. Biol. 1990;215:403–410. - PubMed
    1. Ashburner M, Ball CA, Blake JA, Botstein D, Butler H, Cherry JM, et al. Gene ontology: tool for the unification of biology. The gene ontology consortium. Nat. Genet. 2000;25:25–29. - PMC - PubMed
    1. Baba T, Huan HC, Datsenko K, Wanner BL, Mori H. The applications of systematic in-frame, single-gene knockout mutant collection of Escherichia coli K-12. Methods Mol. Biol. 2008;416:183–194. - PubMed
    1. Bazzini S, Udine C, Sass A, Pasca MR, Longo F, Emiliani G, et al. Deciphering the role of RND efflux transporters in Burkholderia cenocepacia. PLoS ONE. 2011;6:e18902. - PMC - PubMed

Publication types