. 2013 Feb 5:2:e00306.
doi: 10.7554/eLife.00306.

Time line of redox events in aging postmitotic cells

Affiliations

Time line of redox events in aging postmitotic cells

Nicolas Brandes et al. Elife. .

Abstract

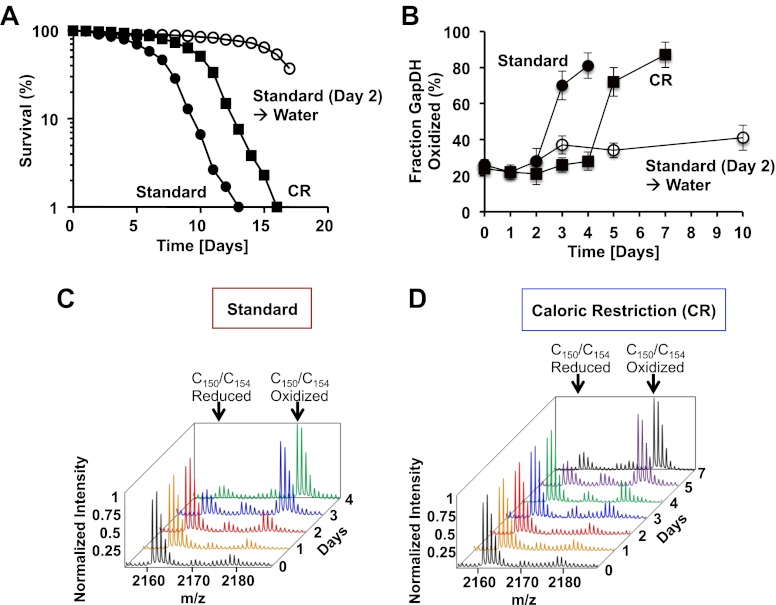
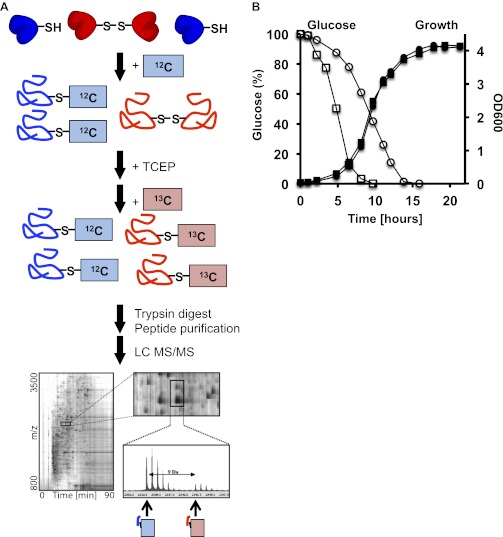
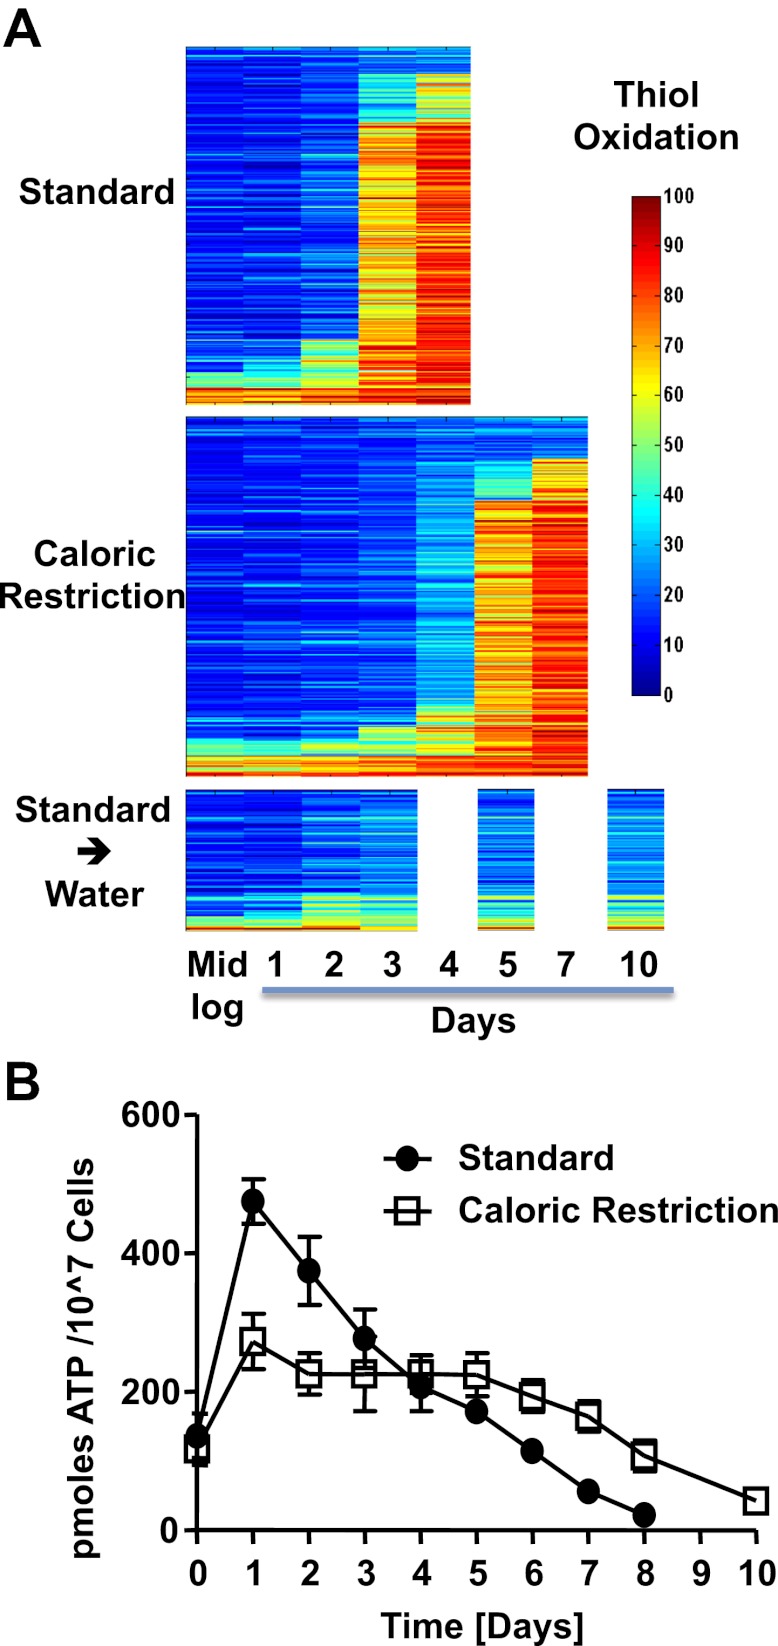
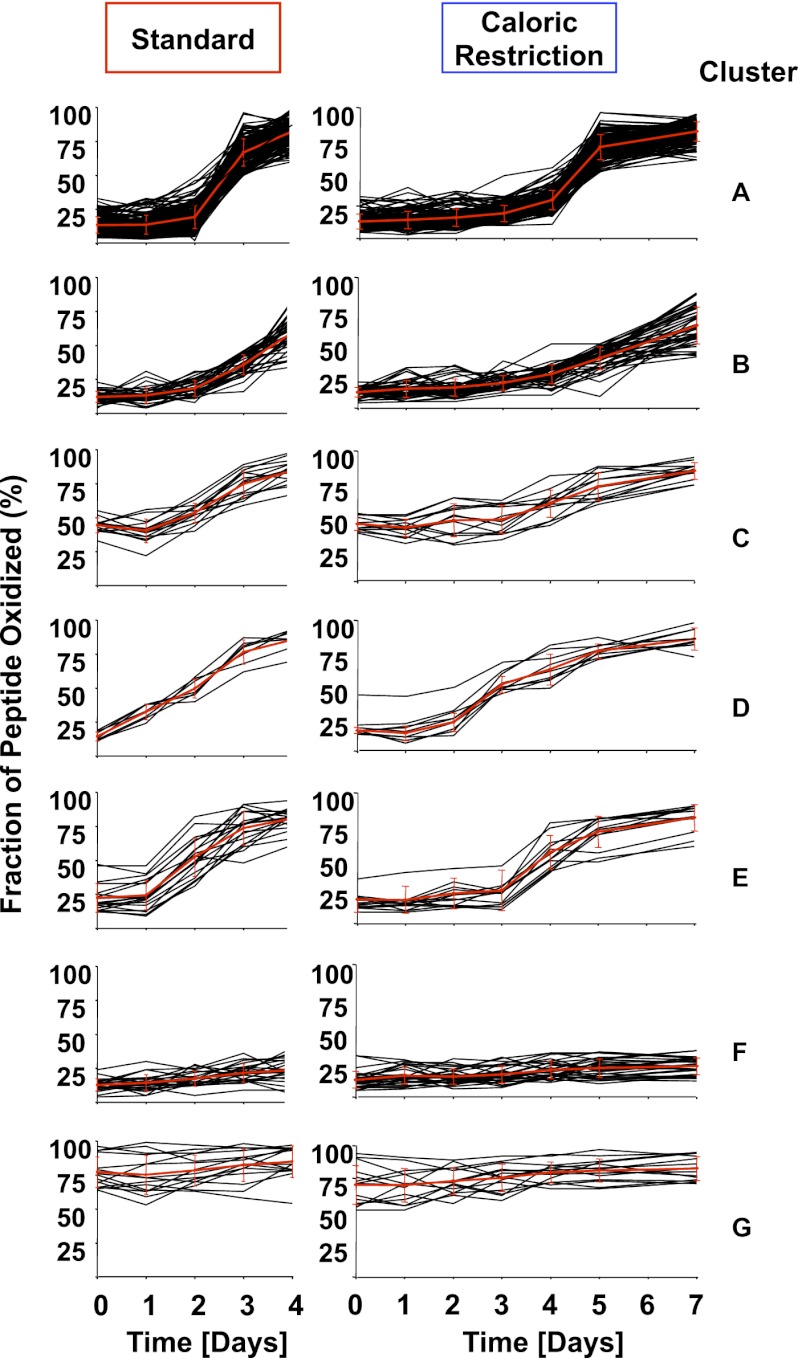
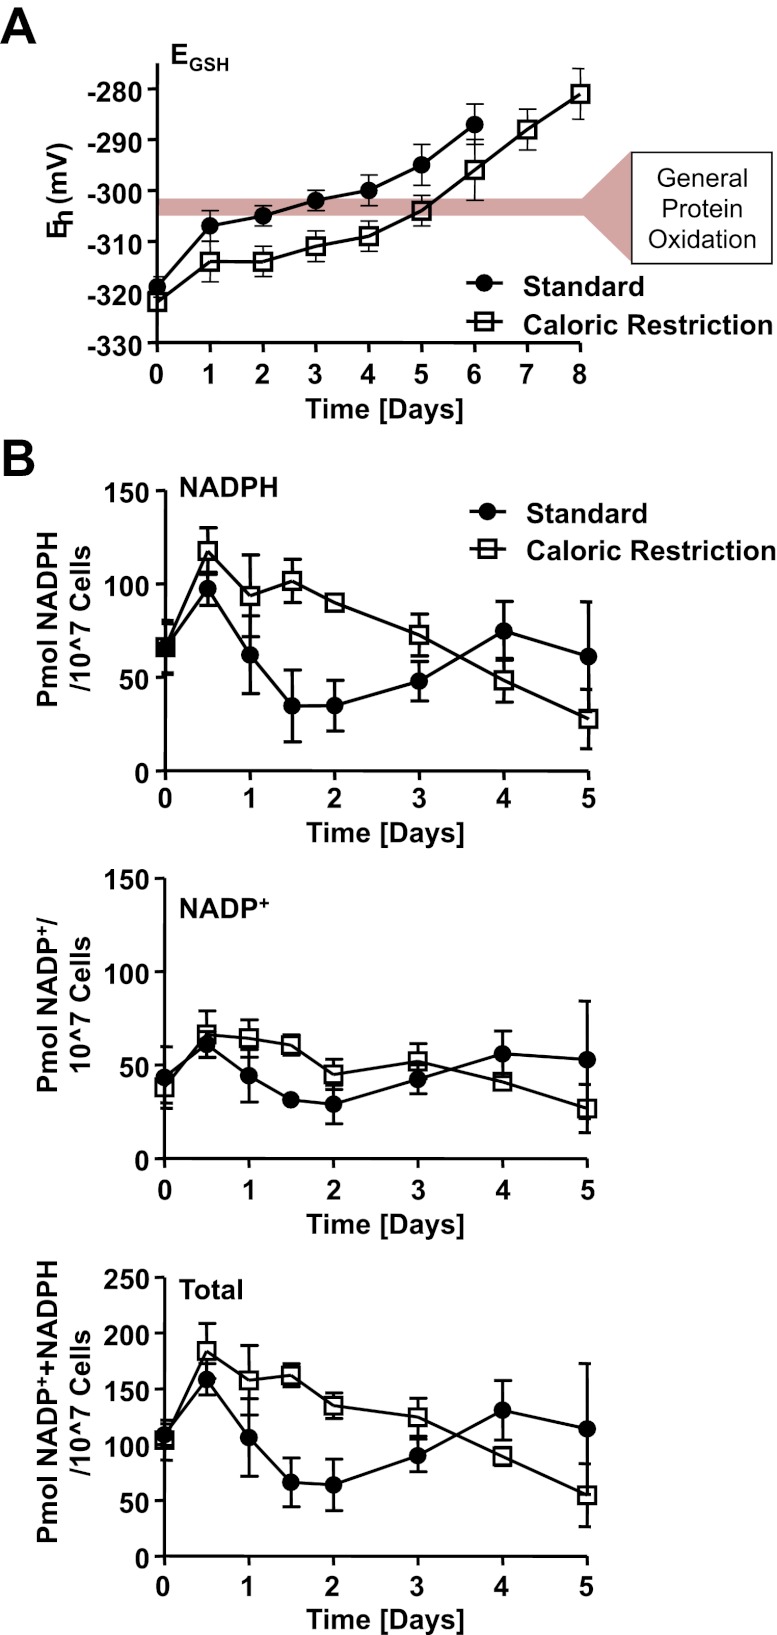
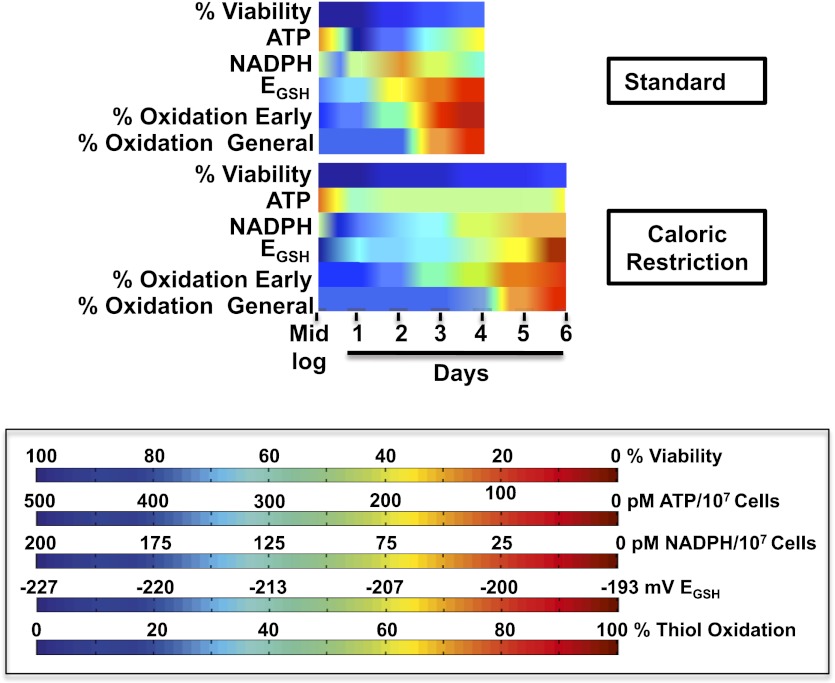
The precise roles that oxidants play in lifespan and aging are still unknown. Here, we report the discovery that chronologically aging yeast cells undergo a sudden redox collapse, which affects over 80% of identified thiol-containing proteins. We present evidence that this redox collapse is not triggered by an increase in endogenous oxidants as would have been postulated by the free radical theory of aging. Instead it appears to be instigated by a substantial drop in cellular NADPH, which normally provides the electron source for maintaining cellular redox homeostasis. This decrease in NADPH levels occurs very early during lifespan and sets into motion a cascade that is predicted to down-regulate most cellular processes. Caloric restriction, a near-universal lifespan extending measure, increases NADPH levels and delays each facet of the cascade. Our studies reveal a time line of events leading up to the system-wide oxidation of the proteome days before cell death.DOI:http://dx.doi.org/10.7554/eLife.00306.001.

Keywords: Aging; Metabolism; Oxidative Stress; Redox Proteomics; Redox Regulation; S. cerevisiae.


Conflict of interest statement

The authors have declared that no competing interests exist.

Figures

Figure 1.
Figure 1.. The active site cysteines of GAPDH become increasingly oxidized during the chronological lifespan of yeast.
Chronological lifespan of S. cerevisiae strain DBY746 was monitored under either 2% glucose standard conditions (closed circles) or 0.5% glucose caloric restriction (CR) conditions (closed squares). Alternatively, cells were cultivated under 2% glucose standard conditions for two days, washed and resuspended in water to induce hypometabolic cultivation conditions (open circles). Cell aliquots were taken at the indicated time points and (A) viability was determined using propidium iodide (PI) staining or (BD) the thiol oxidation status of Cys150/Cys154 in GapDH was quantified by differential thiol trapping using OxICAT. Representative MS spectra of the differentially ICAT-labeled GapDH144–160 peptide containing Cys150 and Cys154 are shown in panels C and D. The mass peak at m/z 2161.13 corresponds to the reduced GapDH144–160 peptide in which both cysteines are labeled with light ICAT. The 18 Da heavier mass peak at m/z 2179.13 corresponds to the oxidized GapDH144–160 peptide in which both cysteines are labeled with heavy ICAT. DOI: http://dx.doi.org/10.7554/eLife.00306.003
Figure 1—figure supplement 1.
Figure 1—figure supplement 1.. (A) Schematic overview of the OxICAT procedure.
Cells are harvested by centrifugation, incubated, and lysed with glass beads in denaturing buffer supplemented with the light version of ICAT, which modifies all reduced cysteines present in the sample. All reversibly oxidized cysteines are then reduced with Tris(2-carboxyethyl)phosphine (TCEP) and, after the removal of TCEP, modified with the heavy version of ICAT. The proteins are digested with trypsin and all ICAT-modified peptides are purified using streptavidin affinity chromatography. The purified peptides are separated by liquid chromatography (LC) and analyzed by mass spectrometry (MS). Differentially labeled heavy- and light-labeled peptides co-elute from the LC. The ratio of the light (i.e., reduced) and heavy (i.e., oxidized) mass peak is used to determine the fraction of the peptide that was originally oxidized in vivo. Individual peptides are identified by MS/MS. (B) Glucose levels (open symbols) and growth (closed symbols) of DBY746 under standard conditions (circles) or caloric restriction conditions (squares). At defined time points, samples were taken and the remaining glucose concentration in the growth media was analyzed using an enzymatic assay kit (Glucose (HK) Assay Kit; Sigma-Aldrich) following the manufacturer's protocol. In parallel, OD600 measurements were conducted to monitor the growth rate. DOI: http://dx.doi.org/10.7554/eLife.00306.005
Figure 2.
Figure 2.. The redox homeostasis collapses early in postmitotic yeast.
(A) DBY746 cells were grown with initial glucose concentrations of either 2% (standard) or 0.5% (caloric restriction). At defined time points, samples were taken for OxICAT analysis (see Figure 1, legend). To determine the thiol oxidation status of cells under hypometabolic conditions, cells were cultivated in standard media for 2 days, washed, then shifted to water prior to taking samples for OxICAT analysis. Each identified peptide is depicted as a bar colored according to its in vivo oxidation state from 0% (blue) to 100% (red) (Figure 1—Source data 1). Peptides are organized by their oxidation pattern in standard conditions. The color presentation was done by Matlab. (B) Cells were cultivated under standard (filled circles) or caloric restriction (open squares) conditions. Cell aliquots were taken at the indicated time points and total cellular ATP levels were determined as described in ‘Material and methods’. DOI: http://dx.doi.org/10.7554/eLife.00306.006
Figure 3.
Figure 3.. Cluster analysis of identified peptides reveals early oxidation targets.
All identified peptides in cultures cultivated under standard or calorically restricted conditions were clustered using the k-means (Euclidean distance) clustering algorithm. Each peptide is displayed by a black line; the red line represents the average of the cluster. Over 70% of peptides fall into clusters A–C. Cluster A: all peptides with less than 30% thiol oxidation during log phase and an increase in oxidation to more than 50% on day 3 (day 5 under caloric restriction conditions) of cultivation; Cluster B: all peptides with less than 30% thiol oxidation during log phase and an increase in oxidation more than 50% on day 4 (day 6 under caloric restriction conditions) of cultivation. Cluster C: all peptides with ∼50% thiol oxidation during log phase and a significant increase in oxidation on day 3 (day 5 under caloric restriction conditions) of cultivation. Cluster D: all peptides that show an at least 1.5-fold increase in thiol oxidation beginning on day 1 (day 3 under caloric restriction conditions) of cultivation. Cluster E: all peptides that show an at least 1.5-fold increase in thiol oxidation beginning on day 2 (day 4 under caloric restriction conditions) of cultivation. Peptides in Clusters F and G remain reduced or oxidized, respectively. The majority of peptides identified under standard or calorically restricted conditions fall into the same clusters (see Figure 1—Source data 1 for details). Peptides in cluster D or E are listed in Table 1. DOI: http://dx.doi.org/10.7554/eLife.00306.007
Figure 4.
Figure 4.. Comparison of sequence conservation between individual protein clusters.
Analysis of sequence conservation (A) and amino acid type (B) in sequence fragments spanning five amino acids up- and downstream of the thiol group whose oxidation status was determined by OxICAT. Peptide sequences from clusters A and B were combined as were sequences from clusters D and E. (A) Sequence logos of the 11-amino acid peptides were aligned at the position of the identified cysteine. The color code corresponds to the amino acid type, with Cys shown in black, negatively charged amino acids shown in red, positively charged amino acids shown in blue, non-polar amino acids shown in grey, aromatic amino acids shown in yellow, and polar amino acids shown in green. The residue order in each column corresponds to the relative occurrence of the residue in the specific position. The height of the amino acid corresponds to its relative frequency at the specific position. The logos were created using WebLogo (Crooks et al., 2004). (B) The relative amino acid occurrence, excluding the OxICAT-identified cysteine, in the sequence fragments was analyzed. As in (A), the amino acids were grouped according to their characteristics and the occurrence of the amino acid type was normalized to the distribution of the same amino acid type in the entire library of sequence fragments. A value of 1 indicates that the occurrence of a specific amino acid is identical to the occurrence of this group of amino acids in the total sequence library. DOI: http://dx.doi.org/10.7554/eLife.00306.009
Figure 5.
Figure 5.. Early oxidation of thioredoxin reductase is reversible in vivo.
Yeast strain DBY746 was cultivated under standard conditions for 2 days (lower panel). Then, the culture was split and either continued to be cultivated in standard media (upper left panel) or shifted to water (upper right panel) to induce hypometabolic cultivation conditions. Representative MS spectra of the differentially ICAT-labeled thioredoxin reductase peptides containing the two active site cysteines Cy142/Cys145 before and after the shift are shown. Within 24 hr after shifting cultures to hypometabolic cultivation conditions (day 3), the increased thiol oxidation of thioredoxin reductase's active site cysteines observed at day 2 is largely reversed. DOI: http://dx.doi.org/10.7554/eLife.00306.011
Figure 5—figure supplement 1.
Figure 5—figure supplement 1.. Role of thioredoxin reductase in the chronological lifespan of yeast.
The lifespan of S. cerevisiae strain DBY746 wild-type (circles) or DBY746 lacking either cytosolic thioredoxin reductase TRR1 (squares) or mitochondrial thioredoxin reductase TTR2 (triangles) was assessed in 2% glucose standard conditions. Aliquots were taken at the indicated time points and survival was determined as before. Data points are the average of at least 3 independent experiments. DOI: http://dx.doi.org/10.7554/eLife.00306.012
Figure 6.
Figure 6.. Loss of cellular NADPH might trigger redox collapse.
Strain DBY746 was cultivated under standard (full circles) or caloric restriction (open squares) conditions as described in Figure 1. At the time points indicated, samples were taken for (A) whole cell analysis of GSH and GSSG levels or (B) NADPH/NADP+ measurements. The glutathione redox potential EGSH was calculated using the Nernst equation. Data points are the average of at least three independent experiments: bars indicate standard deviation. DOI: http://dx.doi.org/10.7554/eLife.00306.013
Figure 7.
Figure 7.. Timeline of redox events in chronologically aging yeast cells.
The graphs shown provide a comparative assessment of cell viability (based on data shown in Figure 1A), ATP levels (Figure 2B), NADPH levels (Figure 6B), EGSH measurements (Figure 6A), and thiol oxidation states of representative early (i.e., PYC2) and general targets (e.g., GapDH/TDH) (Table 1) during the chronological lifespan of yeast strain DBY746 under standard and caloric restriction conditions. A colored scale for each assessed parameter is provided. DOI: http://dx.doi.org/10.7554/eLife.00306.014

Comment in

References

    1. Barja G. 2002. Endogenous oxidative stress: relationship to aging, longevity and caloric restriction. Ageing Res Rev 1:397–411 - PubMed
    1. Bondar RJ, Mead DC. 1974. Evaluation of glucose-6-phosphate dehydrogenase from Leuconostoc mesenteroides in the hexokinase method for determining glucose in serum. Clin Chem 20:586–90 - PubMed
    1. Brandes N, Reichmann D, Tienson H, Leichert LI, Jakob U. 2011. Using quantitative redox proteomics to dissect the yeast redoxome. J Biol Chem 286:41893–903 doi: 10.1074/jbc.M111.296236 - DOI - PMC - PubMed
    1. Burtner CR, Murakami CJ, Kennedy BK, Kaeberlein M. 2009. A molecular mechanism of chronological aging in yeast. Cell Cycle 8:1256–70 - PMC - PubMed
    1. Cho CG, Kim HJ, Chung SW, Jung KJ, Shim KH, Yu BP, et al. 2003. Modulation of glutathione and thioredoxin systems by calorie restriction during the aging process. Exp Gerontol 38:539–48 doi: 10.1016/S0531-5565(03)00005-6 - DOI - PubMed

Publication types

LinkOut - more resources