. 2013 Feb 8;9(1):5.
doi: 10.1186/1746-4811-9-5.

Accounting for variation in designing greenhouse experiments with special reference to greenhouses containing plants on conveyor systems

Affiliations

Accounting for variation in designing greenhouse experiments with special reference to greenhouses containing plants on conveyor systems

Chris J Brien et al. Plant Methods. .

Abstract

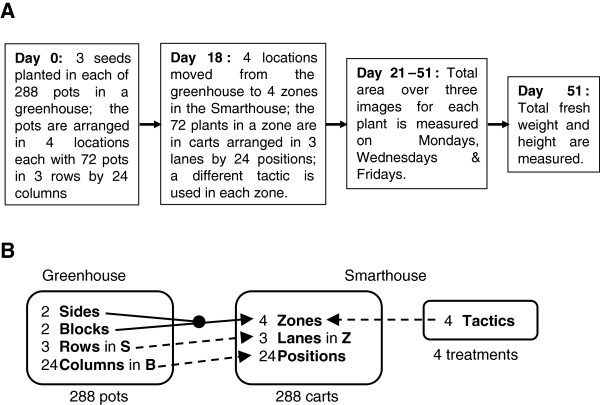
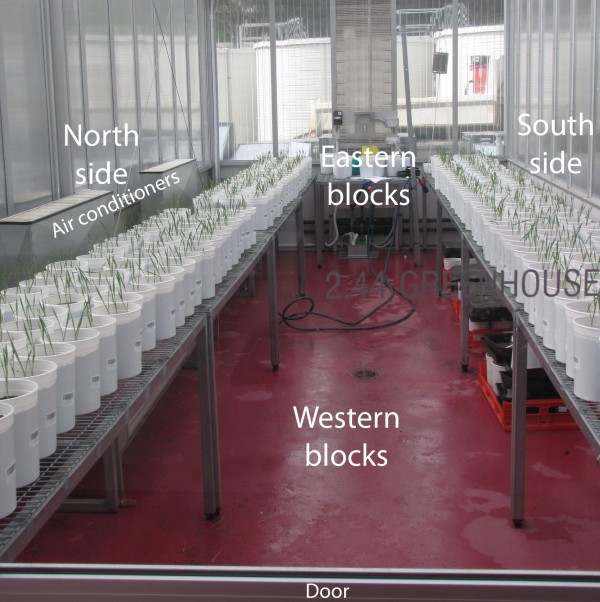
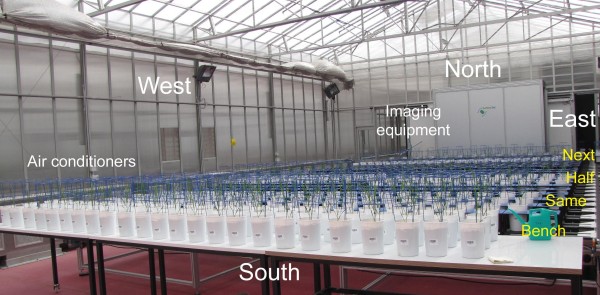
Background: There are a number of unresolved issues in the design of experiments in greenhouses. They include whether statistical designs should be used and, if so, which designs should be used. Also, are there thigmomorphogenic or other effects arising from the movement of plants on conveyor belts within a greenhouse? A two-phase, single-line wheat experiment involving four tactics was conducted in a conventional greenhouse and a fully-automated phenotyping greenhouse (Smarthouse) to investigate these issues.

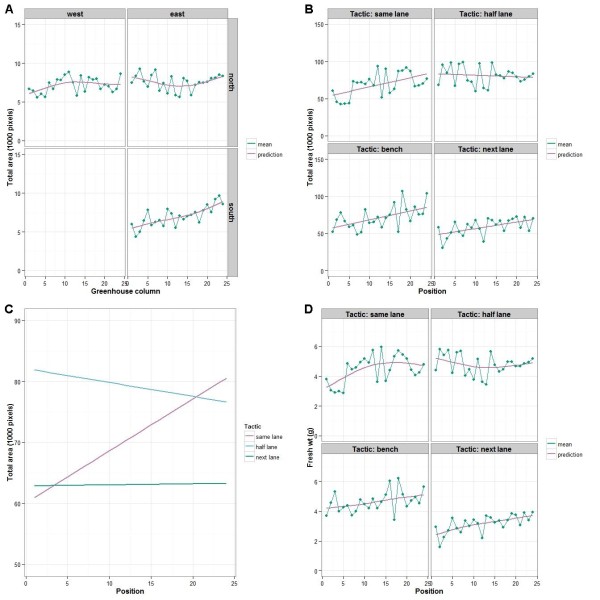
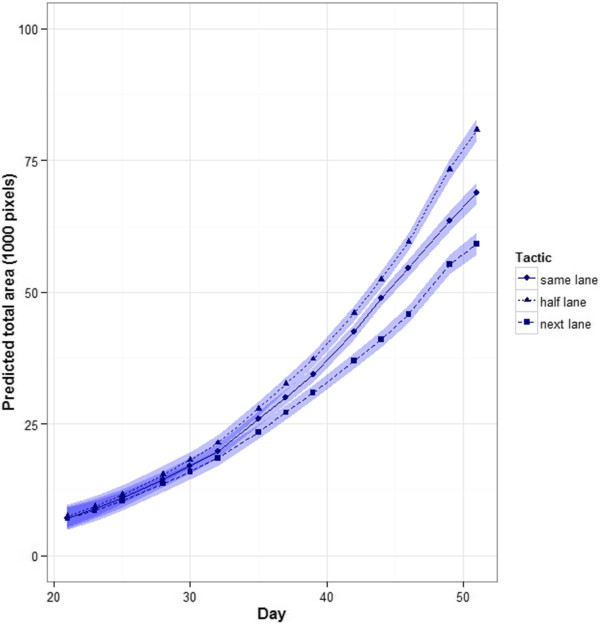
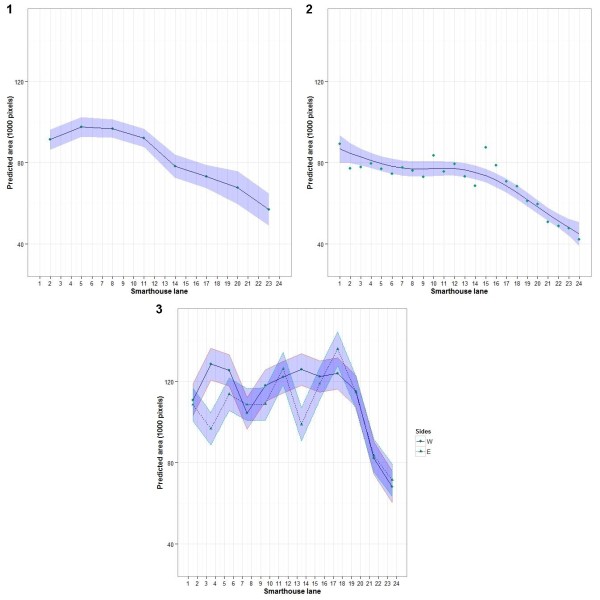
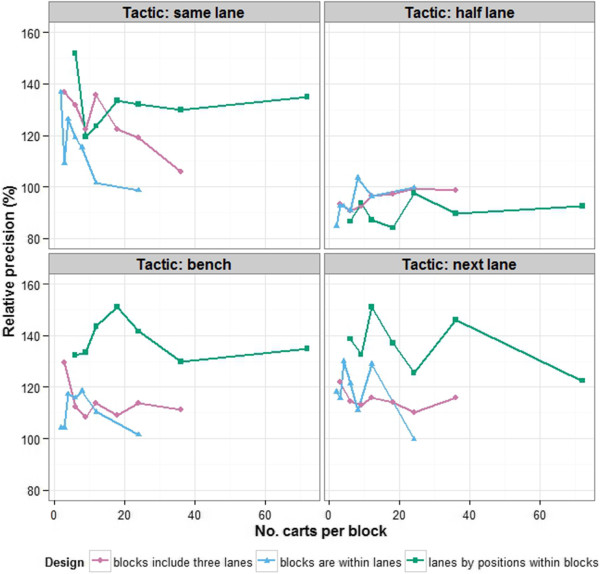
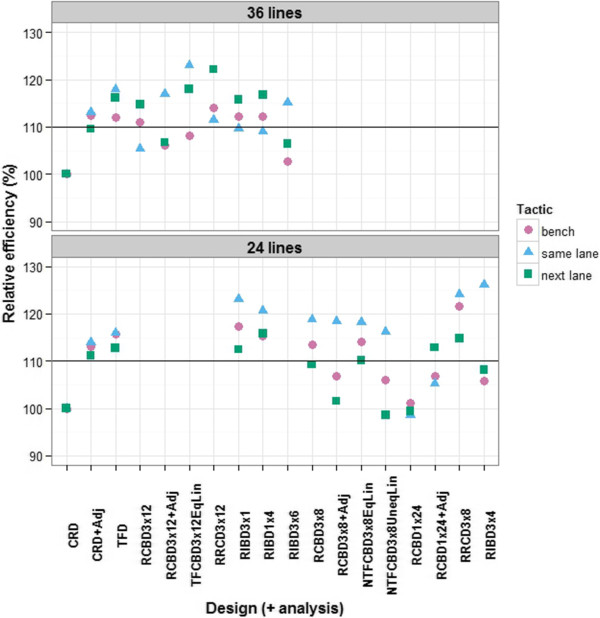
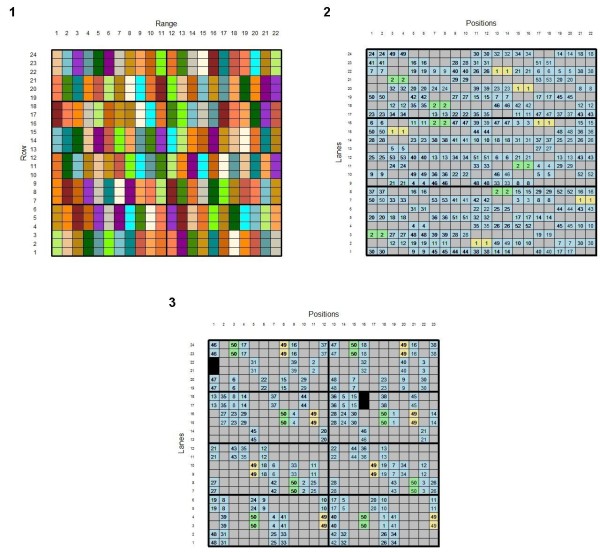
Results and discussion: Analyses of our experiment show that there was a small east-west trend in total area of the plants in the Smarthouse. Analyses of the data from three multiline experiments reveal a large north-south trend. In the single-line experiment, there was no evidence of differences between trios of lanes, nor of movement effects. Swapping plant positions during the trial was found to decrease the east-west trend, but at the cost of increased error variance. The movement of plants in a north-south direction, through a shaded area for an equal amount of time, nullified the north-south trend. An investigation of alternative experimental designs for equally-replicated experiments revealed that generally designs with smaller blocks performed best, but that (nearly) trend-free designs can be effective when blocks are larger.

Conclusions: To account for variation in microclimate in a greenhouse, using statistical design and analysis is better than rearranging the position of plants during the experiment. For the relocation of plants to be successful requires that plants spend an equal amount of time in each microclimate, preferably during comparable growth stages. Even then, there is no evidence that this will be any more precise than statistical design and analysis of the experiment, and the risk is that it will not be successful at all. As for statistical design and analysis, it is best to use either (i) smaller blocks, (ii) (nearly) trend-free arrangement of treatments with a linear trend term included in the analysis, or, as a last resort, (iii) blocks of several complete rows with trend terms in the analysis. Also, we recommend that the greenhouse arrangement parallel that in the Smarthouse, but with randomization where appropriate.


Figures

Figure 1
Figure 1
Overview (A) of and factor allocation diagram (B) for The Plant Accelerator® (PA) experiment. The factor allocation diagram shows how pots and treatments were allocated to carts. The solid arrow indicates that the allocation was done by randomization and the two lines leading to the sold black circle that it was the combinations of the factors to the left that was randomized; a dashed arrow indicates that the allocation of one factor to another was systematic. (S = Sides, B = Blocks and Z = Zones.)
Figure 2
Figure 2
Fitted trends over columns and positions. (A) with column means, for total areas on day 21; (B) with position means, for total areas on day 51; (C) for total areas on day 51, adjusted for total area on day 21; (D) with position means, for fresh weight on day 51. Each plot in (A) is for a location in the greenhouse and in (B) and (D) for a zone in the Smarthouse, with the arrangement of the plots mirroring their geographical location in the greenhouse.
Figure 3
Figure 3
Trend in total area over time for three tactics. The plots include a ribbon of width ± half the approximate LSD (5%) so that overlapping ribbons indicate that the predicted values are not significantly different.
Figure 4
Figure 4
Trend in total area across the lanes of the Smarthouse for the three multiline experiments. The trend is based on predicted values for the random effects of (1) trios of lanes, (2) single lanes, and (3) pairs of lanes, respectively; a spline fitted the trend for just experiment (2) and it is shown; the trend varied randomly between the east and west sides only in experiment (3); the plots include a ribbon of width equal to the 95% confidence intervals and so the overlapping, or not, of ribbons does not indicate whether the predicted values are significantly different.
Figure 5
Figure 5
Precision, relative to no blocking, of different blocking arrangements for each tactic. Three series of blocking arrangements are considered: (i) blocks that are confined to the same lane of the Smarthouse with 2, 3, 4, 6, 8, 12 or 24 carts within a block, (ii) blocks that are contained within 1, 2, 3, 4, 6, 8, or 12 positions of the Smarthouse and spread across the 3 lanes so that they have 3, 6, 9, 12, 18, 24 or 36 carts within a block, and (iii) rows and columns in blocks each of 3 lanes by 2, 3, 4, 6, 8, 12 or 24 positions. Values greater than 100 indicate better precision than no blocking.
Figure 6
Figure 6
Efficiencies, relative to a completely randomized design, of several designs for either 36 or 24 lines. Lines are equally-replicated in their assignment to the 72 carts arranged in a grid of 3 lanes by 24 positions, for each of 3 PA tactics. A line parallel to the X-axis has been drawn at a relative efficiency of 110% to emphasize those situations in which an increase of at least 10% in efficiency can be expected.
Figure 7
Figure 7
The layout of the plants in the greenhouse.
Figure 8
Figure 8
The layout of the plants in the Smarthouse.
Figure 9
Figure 9
The arrangements of lines in the Smarthouse for the three multiline experiments. Each cell in a diagram represents a subplot. In experiment 1, each colour corresponds to a line and adjacent subplots have the same colour. In experiments 2 and 3, blue corresponds to a line that is replicated twice, grey to a line that is unreplicated and green and yellow to the two parent lines; subplots for the same line have the same number, except for the unreplicated lines for which the subplots form main plots in the same manner as for the other lines. Blocks are indicated by thick black lines.

References

    1. Hardy EM, Blumenthal DM. An efficient and inexpensive system for greenhouse pot rotation. HortSci. 2008;43:965–966.
    1. Cox GM, Cochran WG. Designs of greenhouse experiments for statistical analysis. Soil Sci. 1946;62:87–98. doi: 10.1097/00010694-194607000-00009. - DOI
    1. Kempthorne O. 126. Query: Arrangements of pots in greenhouse experiments. Biometrics. 1957;13:235–237. doi: 10.2307/2527805. - DOI
    1. Wallihan EF, Garber MJ. Efficiency of glasshouse pot experiments on rotating versus stationary benches. Plant Physiol. 1971;48:789–791. doi: 10.1104/pp.48.6.789. - DOI - PMC - PubMed
    1. Jaffe MJ. Thigmomorphogenesis: The response of plant growth and development to mechanical stimulation. Planta. 1973;114:143–157. doi: 10.1007/BF00387472. - DOI - PubMed

LinkOut - more resources