. 2013 Feb 7:11:31.
doi: 10.1186/1479-5876-11-31.

Circulating miR-150 and miR-342 in plasma are novel potential biomarkers for acute myeloid leukemia

Affiliations

Circulating miR-150 and miR-342 in plasma are novel potential biomarkers for acute myeloid leukemia

Hussein Fayyad-Kazan et al. J Transl Med. .

Abstract

Background: MicroRNAs (miRNAs) are small (19-22-nt) single-stranded noncoding RNA molecules whose deregulation of expression can contribute to human disease including the multistep processes of carcinogenesis in human. Circulating miRNAs are emerging biomarkers in many diseases and cancers such as type 2 diabetes, pulmonary disease, colorectal cancer, and gastric cancer among others; however, defining a plasma miRNA signature in acute myeloblastic leukemia (AML) that could serve as a biomarker for diagnosis or in the follow-up has not been done yet.

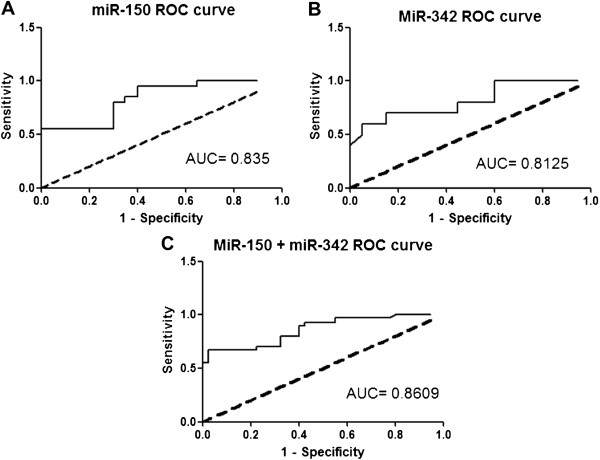
Methods: TaqMan miRNA microarray was performed to identify deregulated miRNAs in the plasma of AML patients. Quantitative real-time RT-PCR was used to validate the results. Receiver-operator characteristic (ROC) curve analysis was conducted to evaluate the diagnostic accuracy of the highly and significantly identified deregulated miRNA(s) as potential candidate biomarker(s).

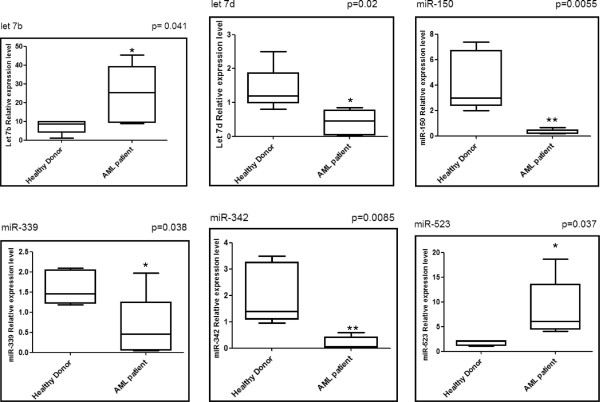
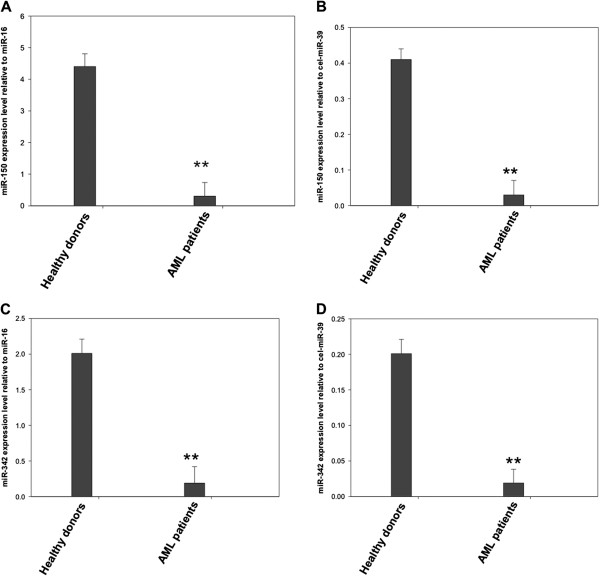
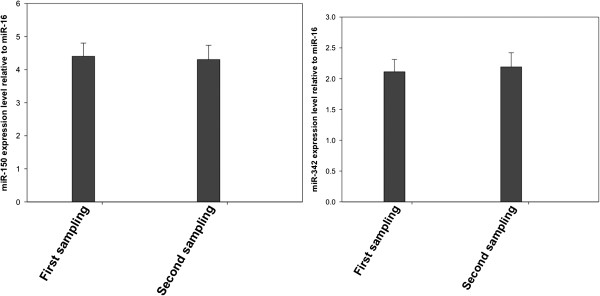
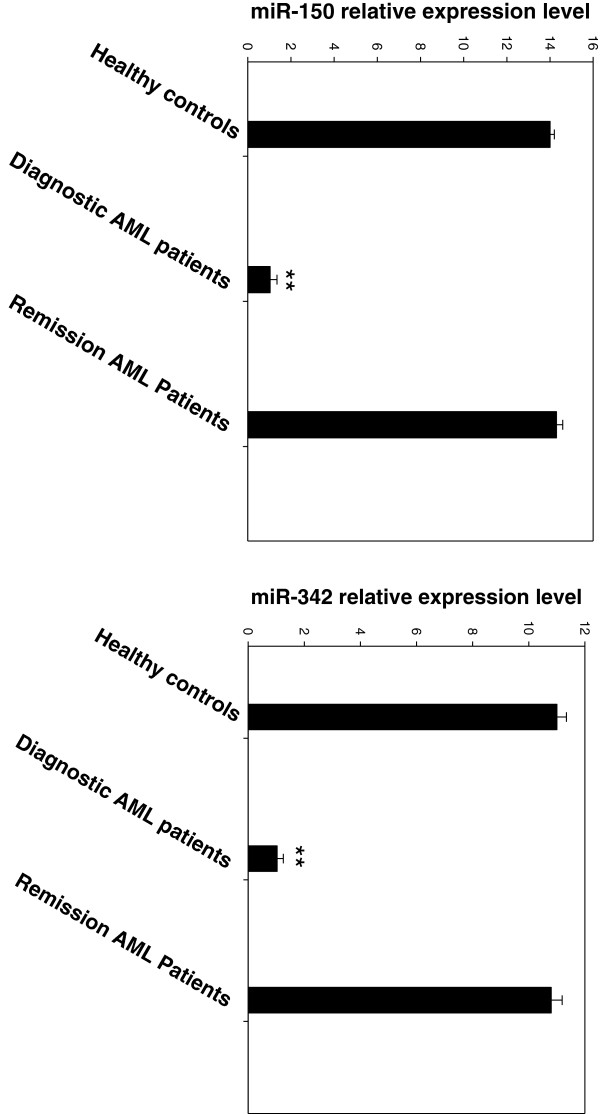
Results: The plasma expression level of let-7d, miR-150, miR-339, and miR-342 was down-regulated whilst that of let-7b, and miR-523 was up-regulated in the AML group at diagnosis compared to healthy controls. ROC curve analyses revealed an AUC (the areas under the ROC curve) of 0.835 (95% CI: 0.7119- 0.9581; P<0.0001) and 0.8125 (95% CI: 0.6796-0.9454; P=0.0005) for miR-150, and miR-342 respectively. Combined ROC analyses using these 2 miRNAs revealed an elevated AUC of 0.86 (95% CI: 0.7819-0.94; P<0.0001) indicating the additive effect in the diagnostic value of these 2 miRNAs. QRT-PCR results showed that the expression level of these two miRs in complete remission AML patients resembled that of healthy controls.

Conclusions: Our findings indicated that plasma miR-150 and miR-342 are novel important promising biomarkers in the diagnosis of AML. These novel and promising markers warrant validation in larger prospective studies.


Figures

Figure 1
Figure 1
Relative expression levels of the six differentially expressed miRs. Six miRNAs are significantly differentially expressed in the plasma of AML patients when compared to healthy controls (n=20). Data obtained by quantitative RT-PCR amplification of miRs are plotted. p-values for each miRNA are shown. Boxes represent SE. Error bars represent SD; pooled data from five independent experiments. *p<0.05, **p<0.01 AML patient versus Healthy controls (Student’s t-test).
Figure 2
Figure 2
miR-16 expression level is stable in both healthy controls and AML patients. MiR-16 expression levels were assessed by qRT-PCR and normalized by cel-miR-39. Shown are the relative levels (mean ± S.D.) of five independent experiments performed on all participants, each done in triplicate.
Figure 3
Figure 3
Relative plasma miR-150 and miR-342 expression levels normalized by cel-miR-39 and hsa-miR-16. MiR-150 (A, B) and miR-342 (C, D) expression levels were assessed by qRT-PCR and normalized by cel-miR-39 and hsa-miR-16 respectively in healthy controls and Acute Myeloid Leukemia patients. Shown are the relative levels (mean ± S.D.) of five independent experiments performed on all participants, each done in triplicate. Statistical significance was determined by Student’s t test and is denoted as follows: ** p <0.01 versus healthy donors.
Figure 4
Figure 4
miR-150 and miR-342 expression levels do not vary between the first and second sampling. Plasma miR-150 and miR-342 expression levels in the first sampling and second sampling were assessed by qRT-PCR. The expression level of these two microRNAs was normalized to miR-16. Shown are the relative levels (mean ± S.D.) of five independent experiments performed on all participants, each done in triplicate.
Figure 5
Figure 5
Receiver operating characteristics (ROC) curve analysis using plasma miR-150 and miR-342 for discriminating AML patients. Plasma miR-150 yielded an AUC (the areas under the ROC curve) of 0.835 (95% CI: 0.7119– 0.9581; P<0.0001) with 80% sensitivity and 70% specificity in discriminating AML (A), and plasma miR-342 yielded AUC of 0.8125 (95% CI: 0.6796–0.9454; P=0.0005) with 70% sensitivity and 85% specificity (B) in discriminating AML. Elevated ROC analysis revealed an elevated AUC of 0.860 (95% CI: 0.7819–0.94; P<0.0001) with 73% sensitivity and 78% specificity in discriminating AML (C).
Figure 6
Figure 6
miR-150 and miR-342 expression levels in Remission AML patients resembles that of healthy controls. Plasma miR-150 and miR-342 expression levels in remission AML patients and healthy controls were assessed by qRT-PCR. The expression level of these two microRNAs was normalized to miR-16. Shown are the relative levels (mean ± S.D.) of five independent experiments performed on all controls, each done in triplicate. Statistical significance was determined by Student’s t test and is denoted as follows: ** p <0.01 versus healthy donors.

References

    1. Estey E, Dohner H. Acute myeloid leukaemia. Lancet. 2006;368:1894–1907. doi: 10.1016/S0140-6736(06)69780-8. - DOI - PubMed
    1. Lowenberg B, Downing JR, Burnett A. Acute myeloid leukemia. N Engl J Med. 1999;341:1051–1062. doi: 10.1056/NEJM199909303411407. - DOI - PubMed
    1. Stone RM, O’Donnell MR, Sekeres MA. Acute myeloid leukemia. Hematology.Am.Soc.Hematol.Educ.Program. 2004. pp. 98–117. - PubMed
    1. Craig CM, Schiller GJ. Acute myeloid leukemia in the elderly: conventional and novel treatment approaches. Blood Rev. 2008;22:221–234. doi: 10.1016/j.blre.2008.03.002. - DOI - PubMed
    1. Pedersen-Bjergaard J, Christiansen DH, Andersen MK, Skovby F. Causality of myelodysplasia and acute myeloid leukemia and their genetic abnormalities. Leukemia. 2002;16:2177–2184. doi: 10.1038/sj.leu.2402764. - DOI - PubMed

Publication types