. 2013 Apr;161(4):1615-33.
doi: 10.1104/pp.112.208694. Epub 2013 Feb 7.

Overexpression of a BAHD acyltransferase, OsAt10, alters rice cell wall hydroxycinnamic acid content and saccharification

Affiliations

Overexpression of a BAHD acyltransferase, OsAt10, alters rice cell wall hydroxycinnamic acid content and saccharification

Laura E Bartley et al. Plant Physiol. 2013 Apr.

Abstract

Grass cell wall properties influence food, feed, and biofuel feedstock usage efficiency. The glucuronoarabinoxylan of grass cell walls is esterified with the phenylpropanoid-derived hydroxycinnamic acids ferulic acid (FA) and para-coumaric acid (p-CA). Feruloyl esters undergo oxidative coupling with neighboring phenylpropanoids on glucuronoarabinoxylan and lignin. Examination of rice (Oryza sativa) mutants in a grass-expanded and -diverged clade of BAHD acyl-coenzyme A-utilizing transferases identified four mutants with altered cell wall FA or p-CA contents. Here, we report on the effects of overexpressing one of these genes, OsAt10 (LOC_Os06g39390), in rice. An activation-tagged line, OsAT10-D1, shows a 60% reduction in matrix polysaccharide-bound FA and an approximately 300% increase in p-CA in young leaf tissue but no discernible phenotypic alterations in vegetative development, lignin content, or lignin composition. Two additional independent OsAt10 overexpression lines show similar changes in FA and p-CA content. Cell wall fractionation and liquid chromatography-mass spectrometry experiments isolate the cell wall alterations in the mutant to ester conjugates of a five-carbon sugar with p-CA and FA. These results suggest that OsAT10 is a p-coumaroyl coenzyme A transferase involved in glucuronoarabinoxylan modification. Biomass from OsAT10-D1 exhibits a 20% to 40% increase in saccharification yield depending on the assay. Thus, OsAt10 is an attractive target for improving grass cell wall quality for fuel and animal feed.


Figures

Figure 1.
Figure 1.
A, Structures of relevant hydroxycinnamic acids. B, Inferred Bayesian phylogeny of the rice Mitchell clade BAHD acyl-CoA-utilizing enzymes including the following: the rice acyltransferases (OsAT); the Arabidopsis protein AT3G62160, which allowed this clade to be identified by Mitchell et al. (2007); biochemically characterized BAHD-IV and BAHD-III proteins as an outgroup (ACT and VAAT; Burhenne et al., 2003; Beekwilder et al., 2004); Arabidopsis proteins that use hydroxycinnamoyl-CoA adducts as substrates (HCT and SFT; Hoffmann et al., 2003; Molina et al., 2009); and the rice genes that cluster with the Arabidopsis HCT (HCT-like). Proteins are identified by the locus identifier that encodes them or their GenBank identifier as well as by proposed names. Clade credibility values are 100 unless shown. The two major subclades are designated clade i and ii. The shading density of the circles on the tree branches indicates the level of RNA expression in terms of counts of Sanger ESTs and representation in massively parallel signature sequence data. [See online article for color version of this figure.]
Figure 2.
Figure 2.
Cell wall hydroxycinnamate composition of leaf blades (left column) and leaf sheaths (right column) of T-DNA mutant rice lines. Data are for homozygous wild-type segregant plants (gray bars) and homozygous mutant plants (hatched bars). Each plant line is designated by the repository identifier and the putative target gene. A and D, Average FA content from an AIR preparation. B and E, p-CA content from AIR. C and F, The ratio of FA to p-CA. Side tillers from lines 1B-00523 and 2D-40243 were harvested 10 weeks after germination. All other lines were harvested 7 weeks after germination. Averages from samples from two to three plants for each genotype were measured independently. Error bars indicate sd. *Significant difference at P < 0.05, **significant difference at P < 0.01 (Student’s t test).
Figure 3.
Figure 3.
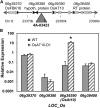
Genomic position of the T-DNA insertion and gene expression data for OsAT10-D1 activation-tagged lines. A, Representation of the rice chromosomes near the T-DNA insertion site. Exons are represented by wide bars, with the direction of transcription indicated by arrows. The insertion site is represented by the triangle, with the left border, nearest the cauliflower mosaic virus 35S transcriptional enhancer elements, represented by “L.” cDNA regions targeted for amplification in quantitative PCR are depicted as black bands. “RT” stands for retrotransposon, and “hypoth.” indicates hypothetical. OsFBK16 encodes an F-box- and Kelch domain-containing protein. B, Average relative gene expression determined via quantitative PCR shows that among genes within 20 kb of the insertion site, only OsAt10 expression is altered significantly in young leaves of homozygous plants with the T-DNA insertion (hatched bars) compared with wild-type (WT) segregants (gray bars). The observed minor variations in other nearby genes were not consistent among the three biological replicates assayed. Error bars represent the sd of three to four biological replicates. A gene with significantly higher expression (P < 0.01, Student’s t test) is marked with an asterisk.
Figure 4.
Figure 4.
OsAT10-D1 has normal vegetative development. A, OsAT10-D1 plants (4A-03423.5 progeny) compared with the wild-type (WT) segregants (4A-03423.1 progeny) at senescence, 7 months after planting. B, Average dry biomass at senescence. C, Average seed mass per plant at senescence. Gray bars indicate the wild type (WW; 4A-03423.1 progeny), and hatched bars indicate mutants (TT; 4A-03423.5 and 4A-03423.12 progeny). n = 12. Error bars represent 2 × se. *Significant difference at P < 0.05 via Student’s t test.
Figure 5.
Figure 5.
OsAT10-D1 shows alterations in cell wall hydroxycinnamic acids. Data are for wild-type segregants lacking the insert (gray bars, progeny of 4A-03423.1) and progeny of homozygous mutants (cross-hatched bars, progeny of 4A-03423.5; horizontally hatched bars, progeny of 4A-03423.12) for young leaves and a pool of mature straw. A, FA content. B, p-CA content. C, The ratio of FA to p-CA. D, Ferulate dimer amounts, the ratio of FA to dimer, and the ratio of dimer to total hydroxycinnamates (HCA) for AIR from young leaf samples in A to C. Error bars represent 2 × se of three to five biological replicates for young leaves and 2 × se of technical duplicates for mature straw. *Significance via Student’s t test at P < 0.05, **significance at P < 0.01, ***significance at P < 1 × 10⁻⁶, which applies to both mutant samples.
Figure 6.
Figure 6.
Independent OsAt10 overexpression plants (hatched bars) show altered ratios of hydroxycinnamic acids (HCA) relative to wild-type plants (gray bars). A, qRT-PCR shows that primary transgenic Ubipro:OsAt10 lines 4 and 5 have increased expression of OsAt10 relative to a developmentally matched nontransgenic “escape” plant (Kit-1 = Ubipro:OsAt10-1). Relative expression is normalized to the average wild-type amount. *Significance via Student’s t test at P < 0.05. B, Hydroxycinnamic acid content in terms of FA, p-CA, and the sum of FA dimer peaks of a young leaf from wild-type escape plants and primary transgenic plants. Hydroxycinnamic acid data are also shown for another developmentally matched escape plant (Kit-2 = Ubipro:OsAt10-2). C, FA-p-CA ratio and FA-dimer ratio.
Figure 7.
Figure 7.
The cell wall alteration in OsAT10-D1 hydroxycinnamates is predominantly in the TFA-soluble fraction. Data are for mature straw from wild-type (gray bars; 4A-03423.5 progeny) and mutant (hatched bars; 4A-03423.1 progeny) plants. The numbers indicate minutes of TFA treatment or water treatment (no TFA). A, FA content in AIR. B, p-CA content in AIR. C, The ratio of FA to p-CA. *Significance via Student’s t test at P < 0.05, **significance at P < 0.01.
Figure 8.
Figure 8.
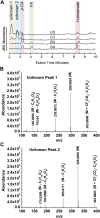
The modified hydroxycinnamates in OsAT10-D1 are esterified to a five-carbon sugar. A, LC-MS shows the total ion abundances in the ethyl acetate extracts for wild-type (a) and mutant (b) plants after 50 mm TFA and 2 m NaOH and for wild-type (c) and mutant (d) plants after 50 mm TFA treatment only. Labeled peaks were consistent both with standards, when available, and with their masses. trans-Cinnamate was added as an extraction control. B and C, Electrospray ionization mass spectra from total ion chromatograms. “M” denotes the major ion, and the other masses are as labeled. These compounds may be present in solution, such as due to reaction with TFA, or formed by interaction with the mobile phases. Although electrospray ionization is a “soft ionization” method in which compounds are typically not fragmented, sometimes fragmentation can occur during the electrospray process if weak bonds are present. B, The major ion in the mass spectrum for unknown peak 1 is consistent with a p-coumaroylated five-carbon sugar. C, The major ion in the mass spectrum for unknown peak 2 is consistent with a feruloylated five-carbon sugar. [See online article for color version of this figure.]
Figure 9.
Figure 9.
Destarched AIR from OsAT10-D1 mature straw (hatched bars; 4A-03423.5 progeny) has increased Glc content relative to that of the wild type (gray bars; 4A-03423.1 progeny). A, Mass analysis shows significant increases in Glc after TFA treatment and after additional treatment with sulfuric acid (TFA→H2SO4) as well as with the sum of the two treatments. B, Analysis of the molecular fraction (mol %) of monomeric sugars released by TFA in the mutant relative to the wild type shows an increase in Glc equal to the decrease in the sum of the decreases in Xyl, Ara, and other sugars. Error bars show 2 × se of three replicates. **Difference at P < 0.01, *difference at P < 0.05 via Student’s t test.
Figure 10.
Figure 10.
Principal component analysis of py-MBMS data for OsAT10D-1 corroborates the change in extractable phenolics but shows no difference in lignin composition. A, The first two components for technical replicates of total biomass (negative in principal component 1 [PC1]) and AIR (positive in PC1) for wild-type straw (WT; diamonds and squares; progeny of 4A-03423.5) and mutant straw (Mut; triangles and X’s; progeny of 4A-03423.1). B, Loadings plot for PC2 of A. The m/z values of the four most differentially abundant ions are shown. The ions that are overrepresented in mutant tissue are 120 (4-vinylphenol or 2,3-dihydrobenzofuran), 91 (fragment of 2,3-dihydrobenzofuran and most phenols), and 94 (phenol). The ion that is most underrepresented in the mutant is 150 (coumaroyl alcohol/coniferyl alcohol). C, Principal component analysis for mutant and wild-type residue after 2 n NaOH extraction. Samples are poorly distinguished, indicating that the principal components of variation are extractable and, therefore, are not polymeric lignin. [See online article for color version of this figure.]
Figure 11.
Figure 11.
OsAT10-D1 exhibits increased enzymatic and fungal deconstructability. A, An enzyme cocktail of cellulase and β-glucosidase releases more sugar from destarched AIR from mature straw of OsAT10-D1 (red diamonds; 4A-03423.5 progeny) than from straw of the wild type (gray circles; 4A-03423.1 progeny). AIR was pretreated at 100°C for 1 h at pH 5 prior to the addition of enzyme. Error bars show the values of two technical replicates. B, Penicillium sp. YT02 releases greater amounts of sugar from rice straw of OsAT10-D1 (diamonds; 4A-03423.5 progeny) than from wild-type straw (circles; 4A-03423.1 progeny) pretreated via acid explosion. Gray symbols indicate Glc, red symbols indicate Xyl, and white symbols indicate Ara. Error bars show 2 × se of five replicate cultures. Raw values and difference data are provided in Supplemental Table S3. C, Xylanase activity (dashed lines, red symbols) in the fungal straw slurry is enhanced in the presence of the mutant straw (diamonds) relative to that in the wild-type straw (circles), whereas carboxymethyl cellulase activity (solid lines, gray symbols) is unchanged. IU represents nmol of sugar per min per mL. Error bars show 2 × se of five replicate cultures. [See online article for color version of this figure.]

References

    1. Achnine L, Blancaflor EB, Rasmussen S, Dixon RA. (2004) Colocalization of l-phenylalanine ammonia-lyase and cinnamate 4-hydroxylase for metabolic channeling in phenylpropanoid biosynthesis. Plant Cell 16: 3098–3109 - PMC - PubMed
    1. Agblevor FA, Evans RJ, Johnson KD. (1994) Molecular-beam mass-spectrometric analysis of lignocellulosic materials. I. Herbaceous biomass. J Anal Appl Pyrolysis 30: 125–144
    1. Allerdings E, Ralph J, Schatz PF, Gniechwitz D, Steinhart H, Bunzel M. (2005) Isolation and structural identification of diarabinosyl 8-O-4-dehydrodiferulate from maize bran insoluble fibre. Phytochemistry 66: 113–124 - PubMed
    1. An G, Lee S, Kim SH, Kim SR. (2005) Molecular genetics using T-DNA in rice. Plant Cell Physiol 46: 14–22 - PubMed
    1. Banks JA, Nishiyama T, Hasebe M, Bowman JL, Gribskov M, dePamphilis C, Albert VA, Aono N, Aoyama T, Ambrose BA, et al. (2011) The Selaginella genome identifies genetic changes associated with the evolution of vascular plants. Science 332: 960–963 - PMC - PubMed

Publication types

MeSH terms