. 2013 Mar;123(3):1216-28.
doi: 10.1172/JCI65351. Epub 2013 Feb 8.

Modified Foxp3 mRNA protects against asthma through an IL-10-dependent mechanism

Affiliations

Modified Foxp3 mRNA protects against asthma through an IL-10-dependent mechanism

Lauren E Mays et al. J Clin Invest. 2013 Mar.

Abstract

Chemically modified mRNA is capable of inducing therapeutic levels of protein expression while circumventing the threat of genomic integration often associated with viral vectors. We utilized this novel therapeutic tool to express the regulatory T cell transcription factor, FOXP3, in a time- and site-specific fashion in murine lung, in order to prevent allergic asthma in vivo. We show that modified Foxp3 mRNA rebalanced pulmonary T helper cell responses and protected from allergen-induced tissue inflammation, airway hyperresponsiveness, and goblet cell metaplasia in 2 asthma models. This protection was conferred following delivery of modified mRNA either before or after the onset of allergen challenge, demonstrating its potential as both a preventive and a therapeutic agent. Mechanistically, FOXP3 induction controlled Th2 and Th17 inflammation by regulating innate immune cell recruitment through an IL-10-dependent pathway. The protective effects of FOXP3 could be reversed by depletion of IL-10 or administration of recombinant IL-17A or IL-23. Delivery of Foxp3 mRNA to sites of inflammation may offer a novel, safe therapeutic tool for the treatment of allergic asthma and other diseases driven by an imbalance in helper T cell responses.


Figures

Figure 1
Figure 1. Modified mRNA generates controlled, site-specific expression of Foxp3.
Modified Foxp3 mRNA was delivered to A549 cells or was delivered intratracheally, versus unmodified Foxp3 mRNA, modified RFP mRNA, AAV2/6.2.GFP, AAV2/6.2.FOXP3, or PBS. Twenty-four hours after administration, cells or mice were harvested for analysis. (A) In vitro transfection efficiency as reported by the percentage of FOXP3+ A549 cells (left y-axis) or MFI (right y-axis) by flow cytometry. (B) Cells cotransfected with the indicated vector or control, pNFκB-luc, and an internal Renilla reference plasmid were harvested at the indicated time points and analyzed for luciferase activity. (C) RT-PCR analysis of Foxp3 mRNA expression in lung relative to PBS controls, normalized to ß-actin. (D) Biodistribution analysis was performed to monitor organ-specific Foxp3 mRNA expression by RT-PCR. (EH) Flow cytometric analysis quantifying the percentage of FOXP3 expression in CD4+CD25+ (E) and total CD4+ cells (F). (G) Representative dot plots showing the percentage of FOXP3 expression per cell type. (H) Percent increase in FOXP3 expression per cell type relative to the starting value, calculated as: (% FOXP3 in a given cell type for Foxp3 mRNA-injected mice – % FOXP3 in that cell type for PBS-injected mice)/(% FOXP3 in that cell type for PBS-injected mice) x 100. *P ≤ 0.05, **P ≤ 0.01 and ***P ≤ 0.001 for the indicated comparisons, or relative to PBS-injected mice. Data are represented as individual mice or means ± SD. In vitro studies (A and B) were performed in triplicate and repeated in 3 independent experiments. (CH) n = 6 mice per group.
Figure 2
Figure 2. Modified mRNA generates transient upregulation of Foxp3 in CD4+ cells.
Modified Foxp3 mRNA (A) or modified Foxp3 mRNA with a 3xFLAG epitope tag (BE) was delivered to MACS-isolated CD4+ cell populations (A) or intratracheally to mice (BE), in comparison with PBS. Twenty-four hours after administration, cells or mice were harvested for analysis. (A) Suppression of CFSE-labeled Tresps in vitro, with or without transfection of modified Foxp3 mRNA, and percent increase in suppression following Foxp3 mRNA delivery. Percentage of exogenous 3xFLAG-Foxp3 in CD4+ cells (B), and percentage increase of 3xFLAG-Foxp3 in various cell types relative to the starting value (C), or percentage in total cells over time (D) were monitored by flow cytometry. Western blot analysis was performed to detect 3xFLAG-Foxp3 expression in lung (E). (C) Values were calculated as: (% FOXP3 in a given cell type for Foxp3 mRNA-injected mice – % FOXP3 in that cell type for PBS-injected mice)/(% FOXP3 in that cell type for PBS-injected mice) x 100. According to this calculation, PBS-injected mice showed a 0% increase for all cell types. *P ≤ 0.05, **P ≤ 0.01, and ***P ≤ 0.001 for the indicated comparisons between plotted groups, or relative to background levels in PBS-injected mice. Data are represented as individual mice or means ± SD. In vitro studies in (A) were performed in triplicate and repeated in 3 independent experiments. (BE) n = 5 mice per group.
Figure 3
Figure 3. Modified Foxp3 mRNA protects against allergic asthma in mice.
Mice sensitized with OVA received modified Foxp3 mRNA either before or during OVA challenge. An AAV2/6.2.Foxp3 vector was used as a positive control. Negative controls included modified RFP mRNA, AAV2/6.2.GFP, and PBS-sensitized/challenged mice. (A and B) Tissue inflammation and goblet cell metaplasia analyzed on H&E- and PAS-stained lung sections. Representative micrographs of H&E staining (original magnification, ×200) and PAS staining (original magnification, ×400) are shown in A; scoring for inflammation and PAS+ cells/mm basement membrane (BM) are shown in B. *P ≤ 0.05 and **P ≤ 0.01 in comparison with OVA-treated, AAV.GFP, or RFP mRNA controls. Data shown as box-and-whisker plots (minimum to maximum, with median line). (C) Differential cell counts after cytospin preparation: the absolute numbers of neutrophils, lymphocytes, or eosinophils in 1 ml of BAL are shown. **P ≤ 0.001 relative to OVA-treated, AAV.GFP, or RFP mRNA controls. Data are mean ± SEM. (D) Airway resistance values in response to MCh. *P ≤ 0.05, **P ≤ 0.01, and ***P ≤ 0.001 versus OVA-treated controls. Data are presented as mean ± SEM. (AC) n = 8 mice per group; (D) n = 5 mice per group.
Figure 4
Figure 4. Modified Foxp3 mRNA rebalances T helper responses.
Mice sensitized with OVA received modified Foxp3 mRNA either before or during OVA challenge. An AAV2/6.2.Foxp3 vector was used as a positive control. Negative controls included modified RFP mRNA, AAV2/6.2.GFP, and PBS-sensitized/challenged mice. (A) Fold change increase in Foxp3, Gata3, and Rorγt mRNA levels relative to PBS controls as detected by RT-PCR and normalized to ß-actin. (B) Expression of Th2 cytokines (IL-4, IL-5, and IL-13), Th17 cytokines (IL-17A and IL-23), and IL-10 in BAL by ELISA. (A and B) *P ≤ 0.05 and **P ≤ 0.001 versus OVA-treated, AAV.GFP, or RFP mRNA controls. (C) Levels of OVA-specific IgE in serum by ELISA. *P ≤ 0.05 and **P ≤ 0.01 versus OVA- and reporter-treated controls. Data are mean ± SD. (AC) n = 8 mice per group.
Figure 5
Figure 5. Modified Foxp3 mRNA lowers total IgE and airway remodeling, even when delivered after antigen challenge.
OVA-sensitized mice received modified Foxp3 mRNA either during or after the OVA challenge phase. (A) Tissue inflammation and goblet cell metaplasia analyzed on H&E- and PAS-stained lung sections. Representative micrographs of H&E staining (original magnification, ×200) and PAS staining (original magnification, ×400) are shown. (B) Differential cell counts after cytospin preparation: the absolute number of neutrophils, lymphocytes, or eosinophils in 1 ml of BAL are shown. (C) Expression of Th2 cytokines (IL-4, IL-5, and IL-13), Th17 cytokines (IL-17A and IL-23), and Treg cytokine (IL-10) in BAL by ELISA. Levels of total IgE in serum (D) and airway remodeling markers in BAL (E) by ELISA. (BE) *P ≤ 0.05, **P ≤ 0.01, and ***P ≤ 0.001 relative to OVA-treated controls. Data are mean ± SD. (AE) n = 8 mice per group. “PBS,” “OVA,” and “OVA + Foxp3 during” groups were repeated in a total of 3 independent studies. NS, not significant.
Figure 6
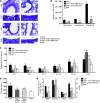
Figure 6. Modified Foxp3 mRNA demonstrates protection from allergic airway disease in the HDM model.
Mice sensitized with HDM received modified Foxp3 mRNA during HDM challenge. Negative controls included modified RFP mRNA and PBS-sensitized mice. (A) Differential cell counts showing the absolute number of neutrophils, lymphocytes, or eosinophils in 1 ml of BAL. (B) ELISAs for expression of IL-4, IL-5, IL-13, IL-17A, and IL-23 in BAL. (A and B) #P ≤ 0.05 relative to PBS control, and *P ≤ 0.05 relative to HDM alone or HDM plus RFP mRNA. (C) Tissue inflammation analyzed on H&E-stained lung sections. Representative micrographs are shown (original magnification, ×200). (D) Airway resistance values in response to MCh. *P ≤ 0.05 and **P ≤ 0.01 versus HDM-treated controls. Data are presented as mean ± SEM. (E) Injection schedule for the HDM-induced model. (AE) n = 5 mice per group. Data for AD were acquired in 2 independent studies.
Figure 7
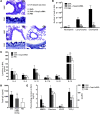
Figure 7. Recombinant IL-17A/IL-23 or depletion of IL-10 ablates the protective effects of modified Foxp3 mRNA.
Mice were sensitized and challenged with OVA or PBS. During challenge, mice received modified Foxp3 mRNA either alone or in combination with recombinant IL-17A or IL-23. Some groups received an IL-10–depleting antibody before the onset of OVA challenge. (A and B) Tissue inflammation and goblet cell metaplasia analyzed on H&E- and PAS-stained lung sections. Representative sections of H&E staining (original magnification, ×200) and PAS staining (original magnification, ×400) are shown in A; scoring for inflammation and PAS+ cells is shown in B. Data are shown as box-and-whisker plots (minimum to maximum, with median line). (C) Differential cell counts showing absolute numbers of neutrophils, lymphocytes, or eosinophils in 1 ml of BAL. *P ≤ 0.05; **P ≤ 0.01; ***P ≤ 0.001 (mean ± SD). (AC) n = 8 mice per group. “PBS,” “OVA,” and “OVA + Foxp3” groups were also repeated in a total of 3 independent studies. r, Recombinant.
Figure 8
Figure 8. Helper T cell responses are no longer rebalanced in the presence of recombinant IL-17A/IL-23 or depletion of IL-10.
Mice were sensitized and challenged with OVA or PBS. During challenge, mice received modified Foxp3 mRNA either alone or in combination with recombinant IL-17A or IL-23. Some groups received an IL-10–depleting antibody before the onset of OVA challenge. (A) Fold change increase in Foxp3, Gata3, and Rorγt mRNA levels relative to PBS controls as detected by RT-PCR and normalized to ß-actin. (B) Expression of Th2 cytokines (IL-4, IL-5, and IL-13), Th17 cytokines (IL-17A and IL-23), and Treg cytokine (IL-10) in BAL by ELISA. *P ≤ 0.05, **P ≤ 0.01, and ***P ≤ 0.001 (mean ± SD). (A and B), n = 8 mice per group. “PBS,” “OVA,” and “OVA + Foxp3” groups were also repeated in a total of 3 independent studies.
Figure 9
Figure 9. Effects of modified Foxp3 mRNA in IL-17A knock-out mice.
IL-17A–/– mice were sensitized and challenged with OVA in the presence or absence of modified Foxp3 mRNA during the challenge phase (n = 5 mice per group). (A) Tissue inflammation and goblet cell metaplasia analyzed on H&E- and PAS-stained lung sections. Representative micrographs of H&E staining (original magnification, ×200) and PAS staining (original magnification, ×400) are shown. (B) Differential cell counts after cytospin preparation: the absolute numbers of neutrophils, lymphocytes, or eosinophils in 1 ml of BAL are shown. (C) Expression of Th2 cytokines (IL-4, IL-5, and IL-13), Th17 cytokines (IL-17A and IL-23), and IL-10 in BAL by ELISA. Levels of total IgE in serum (D) and airway remodeling markers in BAL (E) by ELISA. (BE) *P ≤ 0.05, **P ≤ 0.01, and ***P ≤ 0.001 for OVA + Foxp3 relative to OVA-treated controls. Data are mean ± SD.

References

    1. Elias JA, Lee CG, Zheng T, Ma B, Homer RJ, Zhu Z. New insights into the pathogenesis of asthma. J Clin Invest. 2003;111(3):291–297. - PMC - PubMed
    1. Locksley RM. Asthma and allergic inflammation. Cell. 2010;140(6):777–783. doi: 10.1016/j.cell.2010.03.004. - DOI - PMC - PubMed
    1. Hellings PW, et al. Interleukin-17 orchestrates the granulocyte influx into airways after allergen inhalation in a mouse model of allergic asthma. Am J Respir Cell Mol Biol. 2003;28(1):42–50. doi: 10.1165/rcmb.4832. - DOI - PubMed
    1. Wilson RH, Whitehead GS, Nakano H, Free ME, Kolls JK, Cook DN. Allergic sensitization through the airway primes Th17-dependent neutrophilia and airway hyperresponsiveness. Am J Respir Crit Care Med. 2009;180(8):720–730. doi: 10.1164/rccm.200904-0573OC. - DOI - PMC - PubMed
    1. Molet S, et al. IL-17 is increased in asthmatic airways and induces human bronchial fibroblasts to produce cytokines. J Allergy Clin Immunol. 2001;108(3):430–438. doi: 10.1067/mai.2001.117929. - DOI - PubMed

Publication types

MeSH terms