. 2013 Mar;123(3):1310-22.
doi: 10.1172/JCI66125. Epub 2013 Feb 8.

PAR-1 contributes to the innate immune response during viral infection

Affiliations

PAR-1 contributes to the innate immune response during viral infection

Silvio Antoniak et al. J Clin Invest. 2013 Mar.

Abstract

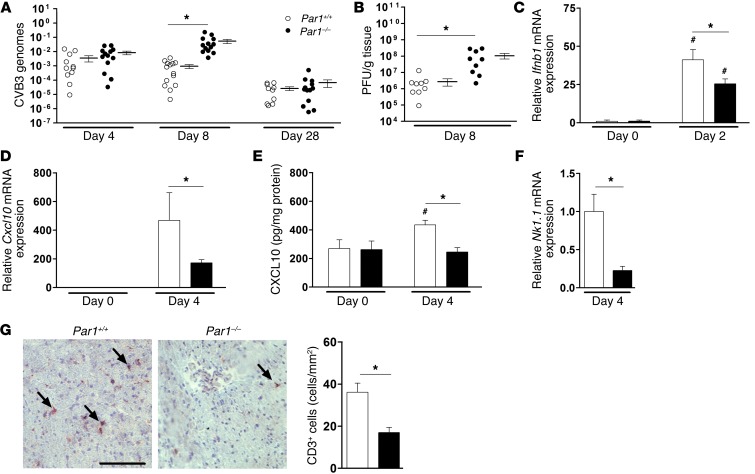
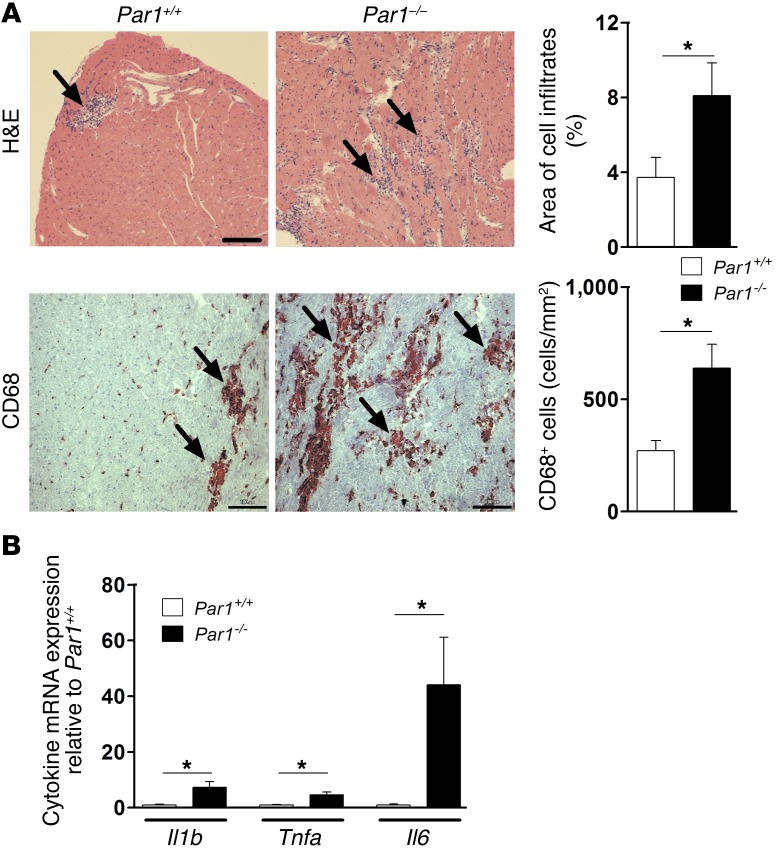
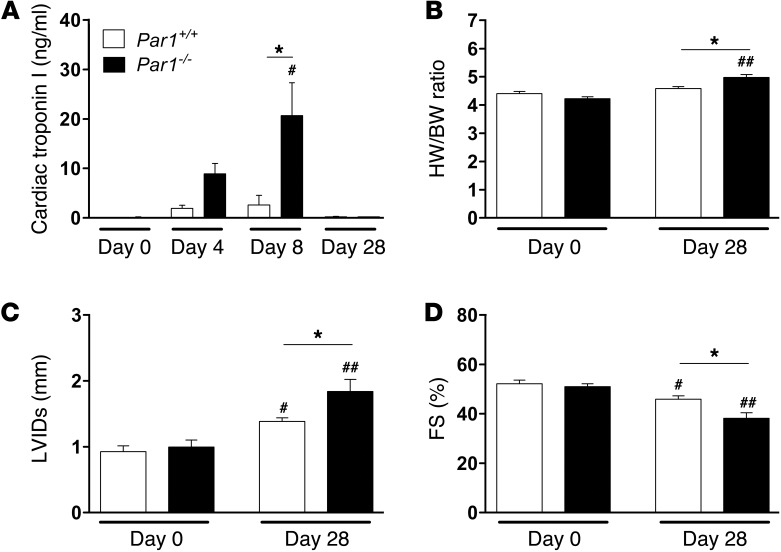
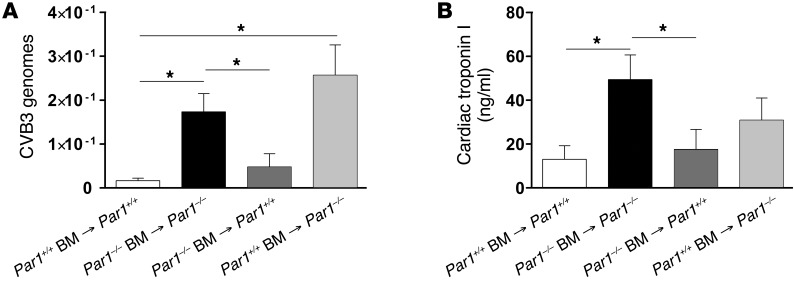
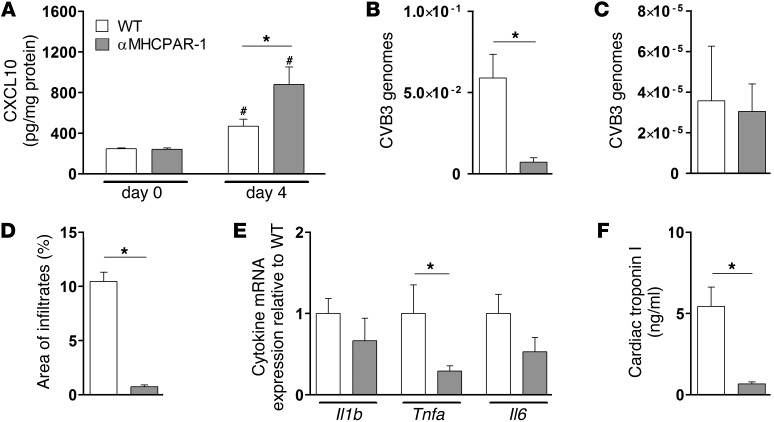
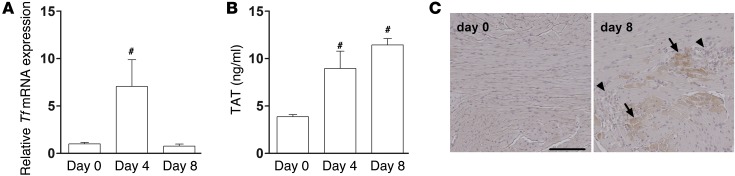
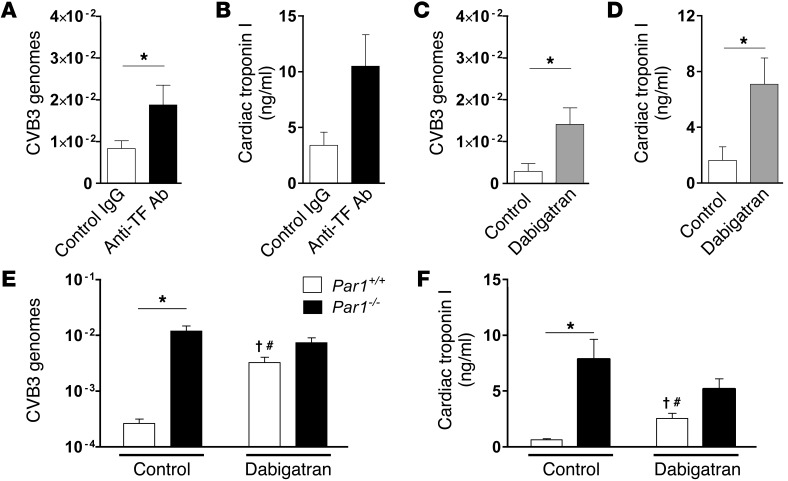
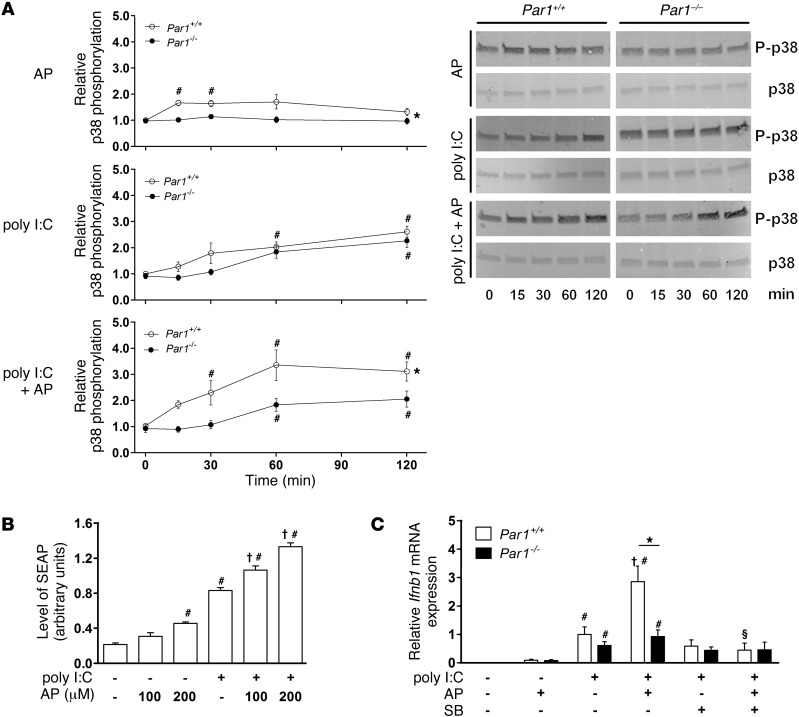
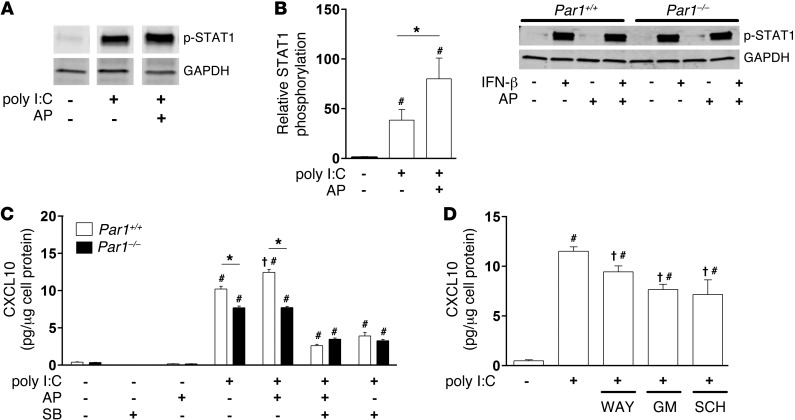
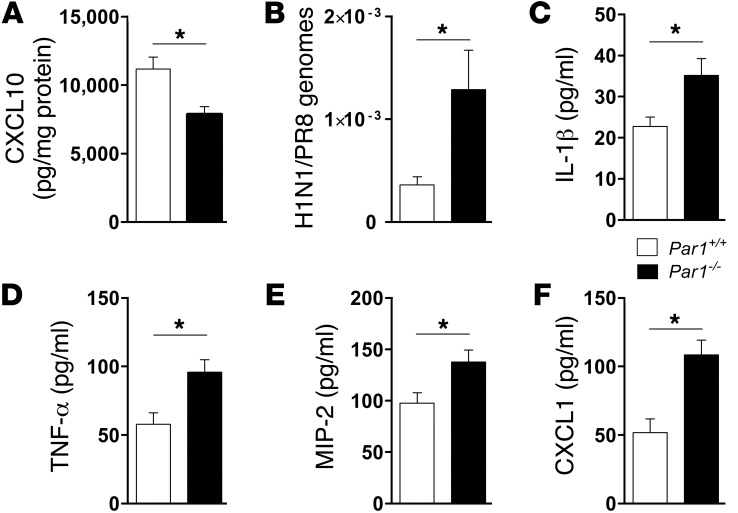
Coagulation is a host defense system that limits the spread of pathogens. Coagulation proteases, such as thrombin, also activate cells by cleaving PARs. In this study, we analyzed the role of PAR-1 in coxsackievirus B3-induced (CVB3-induced) myocarditis and influenza A infection. CVB3-infected Par1(-/-) mice expressed reduced levels of IFN-β and CXCL10 during the early phase of infection compared with Par1(+/+) mice that resulted in higher viral loads and cardiac injury at day 8 after infection. Inhibition of either tissue factor or thrombin in WT mice also significantly increased CVB3 levels in the heart and cardiac injury compared with controls. BM transplantation experiments demonstrated that PAR-1 in nonhematopoietic cells protected mice from CVB3 infection. Transgenic mice overexpressing PAR-1 in cardiomyocytes had reduced CVB3-induced myocarditis. We found that cooperative signaling between PAR-1 and TLR3 in mouse cardiac fibroblasts enhanced activation of p38 and induction of IFN-β and CXCL10 expression. Par1(-/-) mice also had decreased CXCL10 expression and increased viral levels in the lung after influenza A infection compared with Par1(+/+) mice. Our results indicate that the tissue factor/thrombin/PAR-1 pathway enhances IFN-β expression and contributes to the innate immune response during single-stranded RNA viral infection.


Figures

Figure 1
Figure 1. CVB3 levels and the early innate immune response in hearts of Par1+/+ (white symbols and bars) and Par1–/– (black symbols and bars) mice.
(A) Levels of CVB3 genomes at different times after CVB3 infection. (B) CVB3 virus titers at 8 dpi. (CE) Levels of Ifnb1 mRNA (C), Cxcl10 mRNA (D), and CXCL10 protein (E) expression before infection and at 2 or 4 dpi. (F and G) Levels of the NK cell–specific mRNA Nk1.1 (F) and number of CD3+ cells (G) at 4 dpi. Nk1.1 mRNA expression is shown relative to the level in infected Par1+/+ hearts. Representative images are shown. Arrows indicate staining of CD3+ cells. Scale bar: 100 μm. Data (mean ± SEM; n = 4–10 per group) were analyzed by 2-way ANOVA (AE) or 2-tailed Student’s t test (F and G). *P < 0.05; #P < 0.05 vs. respective genotype at day 0.
Figure 2
Figure 2. Inflammation in the hearts of CVB3-infected Par1+/+ and Par1–/– mice.
(A) Levels of cellular infiltrates and CD68+ cells in Par1+/+ (white bars) and Par1–/– (black bars) hearts at 8 dpi. Representative images are shown. Arrows indicate areas of inflammatory cells (top) and CD68+ cells (bottom). Scale bars: 100 μm. (B) Inflammatory mediators in Par1+/+ and Par1–/– hearts at 8 dpi. Results are shown relative to mRNA expression level in infected Par1+/+ hearts. Data (mean ± SEM; n = 4–10 per group) were analyzed by 2-tailed Student’s t test. *P < 0.05.
Figure 3
Figure 3. Cardiac injury and function in Par1+/+ and Par1–/– mice after CVB3 infection.
(A) Cardiac troponin I levels in plasma of Par1+/+ (white bars) and Par1–/– (black bars) mice before and at different time points after CVB3 infection. (B) HW/BW ratios before infection and at 28 dpi. (C) Echocardiographic analysis of systolic LV internal diameter (LVID-s) and (D) FS before infection and at 28 dpi. Data (mean ± SEM; n = 5–9 per group) were analyzed by 2-way ANOVA. *P < 0.05; #P < 0.05, ##P < 0.01 vs. respective genotype at day 0.
Figure 4
Figure 4. Cellular sources of PAR-1 that contribute to protection from CVB3-induced myocarditis.
CVB3 genomes in the heart (A) and cardiac injury (B) in CVB3-infected control Par1+/+ BM→Par1+/+ and Par1–/– BM→Par1–/– chimeric mice, Par1–/– BM→Par1+/+ mice (PAR-1 deficiency in hematopoietic cells), and Par1+/+ BM→Par1–/– mice (PAR-1 deficiency in nonhematopoietic cells) at 8 dpi. Data (mean ± SEM; n = 4–10 per group) were analyzed by 2-way ANOVA. *P < 0.05.
Figure 5
Figure 5. Overexpression of PAR-1 reduces CVB3-induced myocarditis.
WT (white) and αMHCPAR-1 (gray) animals were infected with CVB3. (A) CXCL10 protein levels in heart at 4 dpi. (B and C) Number of CVB3 genomes in heart (B) and liver (C) at 8 dpi. (D) Levels of inflammatory cell infiltrates in heart at 8 dpi. (E) Il1b, Tnfa, and Il6 mRNA expression in heart at 8 dpi. mRNA expression for each gene is shown relative to WT. (F) Circulating cardiac troponin I at 8 dpi. Data (mean ± SEM; n = 4–9 per group) were analyzed by 2-way ANOVA (A) or 2-tailed Student’s t test (BF). *P < 0.05; #P < 0.05 vs. respective genotype at day 0.
Figure 6
Figure 6. TF expression, TAT levels, and fibrin deposition in the hearts of infected WT mice.
Tf mRNA expression (A), plasma TAT levels (B), and fibrin(ogen) staining (C) in control and CVB3-infected WT hearts. Arrows indicate fibrin staining (brown); arrowheads indicate inflammatory cell infiltrates. Scale bar: 100 μm. Data (mean ± SEM; n = 4–14 per group) were analyzed by 1-way ANOVA. #P < 0.05 vs. day 0.
Figure 7
Figure 7. Effect of inhibition of TF or thrombin on CVB3-induced myocarditis.
(AD) TF inhibition (A and B) and thrombin inhibition (C and D) both increased levels of CVB3 genomes (A and C) and cardiac injury (B and D) in WT mice at 8 dpi. Data (mean ± SEM; n = 4–10 per group) were analyzed by 2-tailed Student’s t test. (E and F) Thrombin inhibition increased CVB3 genomes and cardiac injury in Par1+/+ mice (white bars), but reduced CVB3 genomes and cardiac injury in Par1–/– mice (black bars). Data (mean ± SEM; n = 10–23 per group) were analyzed by 2-way ANOVA. *P < 0.05; #P < 0.05 vs. Par1+/+ control; P < 0.05 vs. Par1–/– control.
Figure 8
Figure 8. Effect of PAR-1 activation on poly I:C activation of p38 and induction of Ifnb1 mRNA expression.
(A) Levels of phosphorylated p38 in Par1+/+ and Par1–/– CFs before and after stimulation with 200 μM agonist peptide (AP) and/or 25 μg/ml poly I:C for the indicated times. Phosphorylated p38 levels (normalized to GAPDH) are shown relative to unstimulated Par1+/+ cells. Representative Western blots are also shown. (B) Levels of SEAP in the culture media of HEK-293 cells stimulated with 25 μg/ml poly I:C and/or 100 or 200 μM agonist peptide for 24 hours. Data are shown from 12 independent samples per group. (C) Ifnb1 mRNA expression in Par1+/+ (white bars) and Par1–/– (black bars) CFs before and after stimulation with 25 μg/ml poly I:C and/or 200 μM agonist peptide for 2 hours. Results are shown relative to poly I:C–stimulated Par1+/+ CFs. The p38 inhibitor SB203580 (SB; 10 μM) was added 30 minutes prior to poly I:C stimulation. Data (mean ± SEM; n = 5–9 independent experiments) were analyzed by linear mixed models with a random intercept (A) or by 1-way (B) or 2-way (C) ANOVA. *P < 0.05, Par1+/+ vs. Par1–/–; #P < 0.05 vs. unstimulated control within the same genotype; P < 0.05 versus poly I:C alone within the same genotype; §P < 0.05 vs. poly I:C and agonist peptide.
Figure 9
Figure 9. Effect of PAR-1 activation on poly I:C activation of STAT1 and CXCL10 expression.
(A) Levels of phosphorylated STAT1 in unstimulated or stimulated (25 μg/ml poly I:C with or without 200 μM agonist peptide for 2 hours) Par1+/+ CFs. STAT1 phosphorylation levels (normalized to GAPDH) are shown relative to unstimulated Par1+/+. (B) STAT1 phosphorylation in Par1+/+ and Par1–/– CFs treated with 125 ng/ml recombinant IFN-β with or without 200 μM agonist peptide for 30 minutes. (C) CXCL10 expression in Par1+/+ (white bars) and Par1–/– (black bars) CFs stimulated with 25 μg/ml poly I:C with or without 200 μM agonist peptide for 8 hours. 10 μM SB203580 was added 30 minutes prior to poly I:C stimulation. (D) Effect of MMP or PAR-1 inhibition during poly I:C stimulation of Par1+/+ CFs. The pan-MMP inhibitor GM6001 (GM; 1 μM), the MMP13 inhibitor WAY170523 (WAY; 1 μM), or the PAR-1 antagonist SCH79797 (SCH; 250 nM) were added 30 minutes prior to poly I:C stimulation. Data (mean ± SEM; n = 3–9 independent experiments) were analyzed by 1-way (A and D) or 2-way (C) ANOVA. *P < 0.05; #P < 0.05 vs. unstimulated control within the same genotype; P < 0.05 versus poly I:C alone within the same genotype.
Figure 10
Figure 10. Role of PAR-1 in influenza A infection.
Levels of CXCL10 protein (A) and H1N1/PR8 genomes (B) in the lungs and of inflammatory mediators in BAL (CF) of H1N1/PR8 influenza A–infected Par1+/+ (white bars) and Par1–/– (black bars) mice at 3 dpi. Data are mean ± SEM (n = 5–6). *P < 0.05, 2-tailed Student’s t test.

References

    1. Loof TG, et al. Coagulation, an ancestral serine protease cascade, exerts a novel function in early immune defense. Blood. 2011;118(9):2589–2598. doi: 10.1182/blood-2011-02-337568. - DOI - PubMed
    1. Sun H. The interaction between pathogens and the host coagulation system. Physiology (Bethesda). 2006;21:281–288. doi: 10.1152/physiol.00059.2005. - DOI - PubMed
    1. Sun H, et al. Plasminogen is a critical host pathogenicity factor for group A streptococcal infection. Science. 2004;305(5688):1283–1286. doi: 10.1126/science.1101245. - DOI - PubMed
    1. Iwanaga S, Kawabata S. Evolution and phylogeny of defense molecules associated with innate immunity in horseshoe crab. Front Biosci. 1998;3:D973–D984. - PubMed
    1. Degen JL, Bugge TH, Goguen JD. Fibrin and fibrinolysis in infection and host defense. J Thromb Haemost. 2007;5(suppl 1):24–31. doi: 10.1111/j.1538-7836.2007.02519.x. - DOI - PubMed

Publication types

MeSH terms