. 2013 Apr;44(4):1135-43.
doi: 10.1161/STROKEAHA.111.000633. Epub 2013 Feb 7.

Simvastatin attenuates stroke-induced splenic atrophy and lung susceptibility to spontaneous bacterial infection in mice

Affiliations

Simvastatin attenuates stroke-induced splenic atrophy and lung susceptibility to spontaneous bacterial infection in mice

Rong Jin et al. Stroke. 2013 Apr.

Abstract

Background and purpose: Statins are widely used in the primary and secondary prevention of ischemic stroke, but their effects on stroke-induced immunodepression and poststroke infections are elusive. We investigated the effects of simvastatin treatment on stroke-induced splenic atrophy and lung susceptibility to bacterial infection in acute experimental stroke in mice.

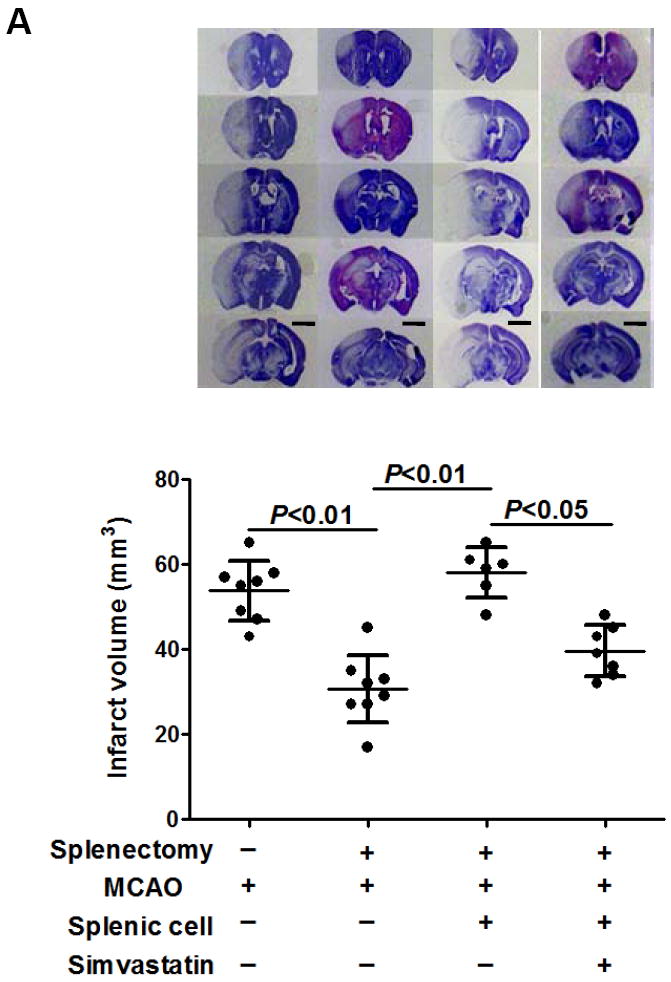
Methods: Ischemic stroke was induced by transient middle cerebral artery occlusion, followed by reperfusion. In some experiments, splenectomies were performed 2 weeks before middle cerebral artery occlusion. Animals were randomly assigned to sham and middle cerebral artery occlusion groups treated subcutaneously with vehicle or simvastatin (20 mg/kg per day). Brain infarction, neurological function, brain interferon-γ expression, splenic atrophy and apoptosis, and lung infection were examined.

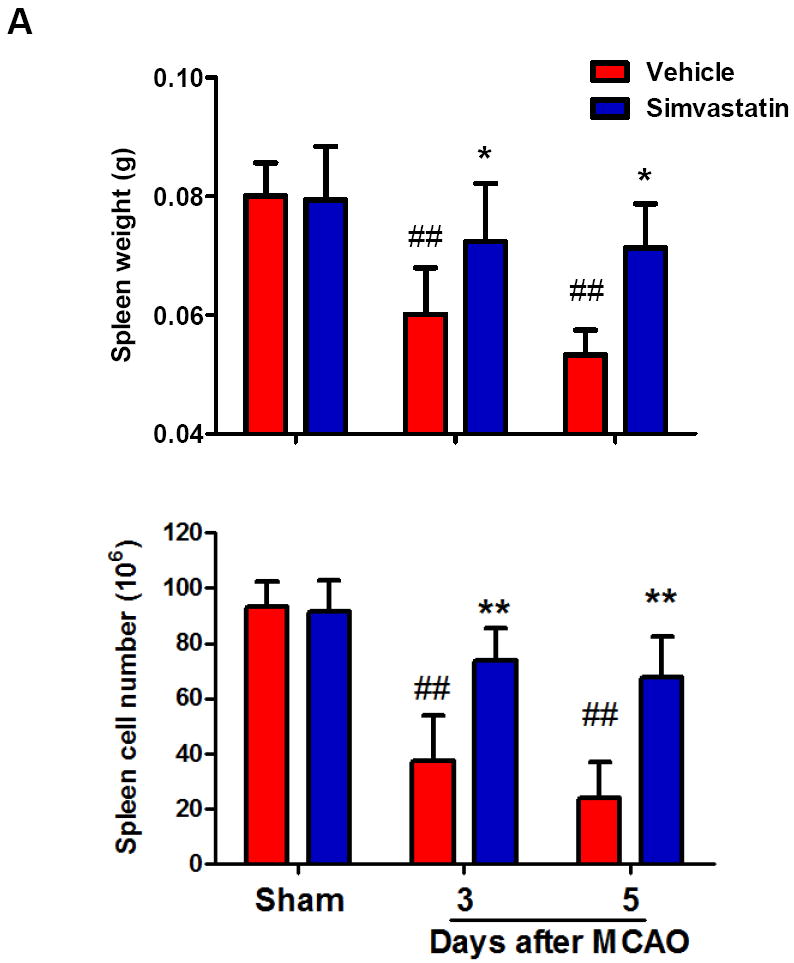
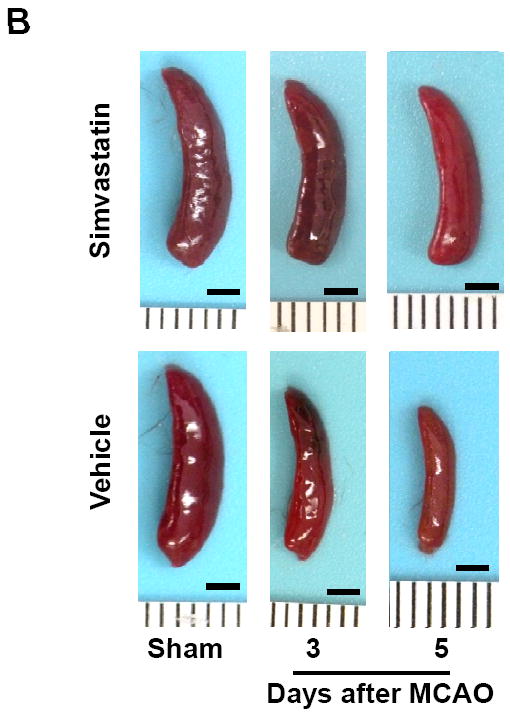
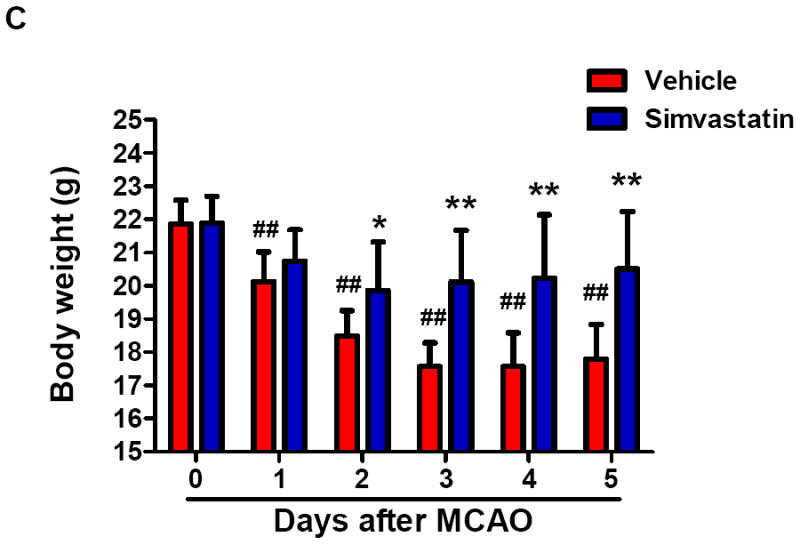
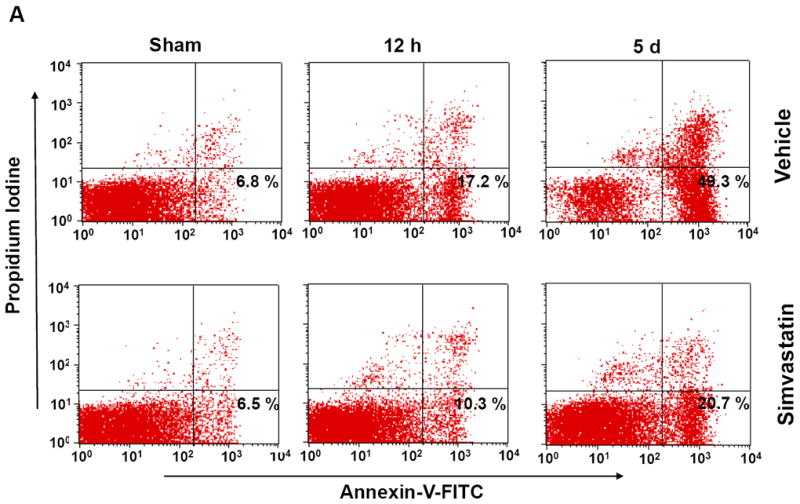
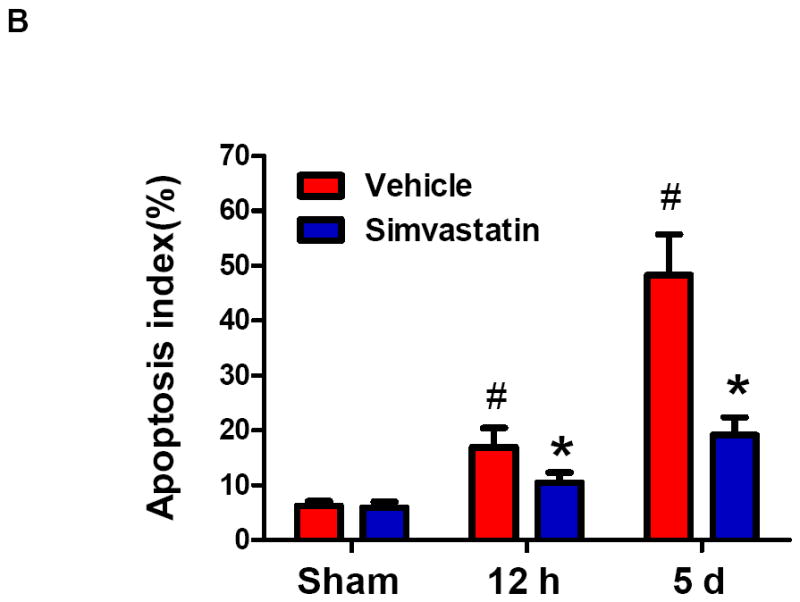
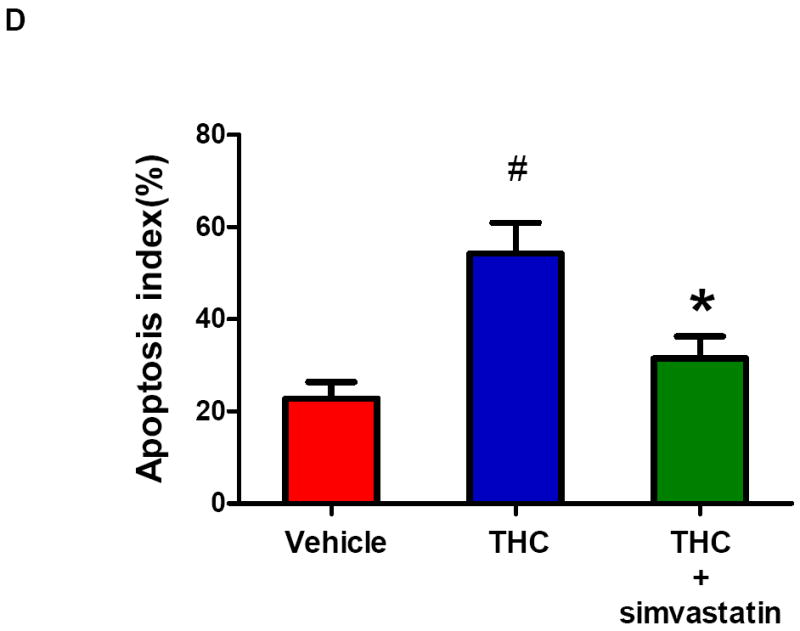
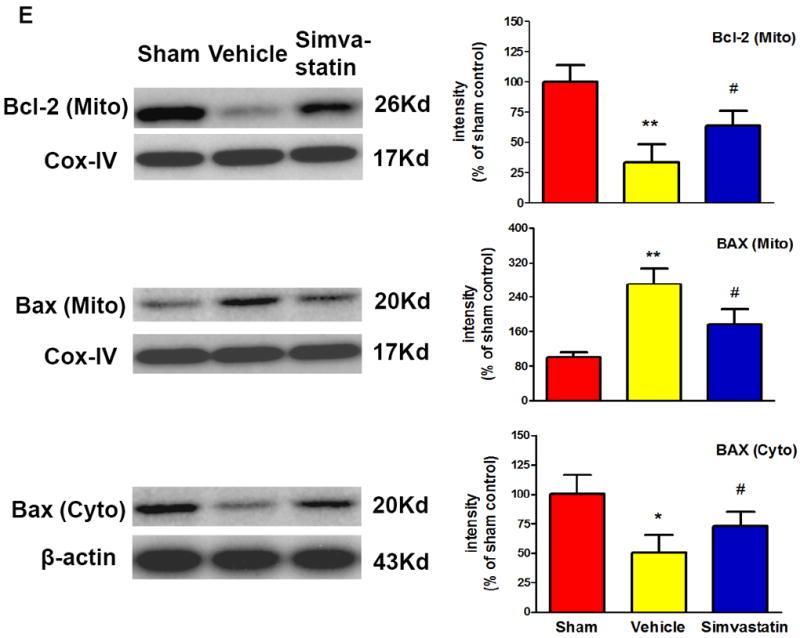
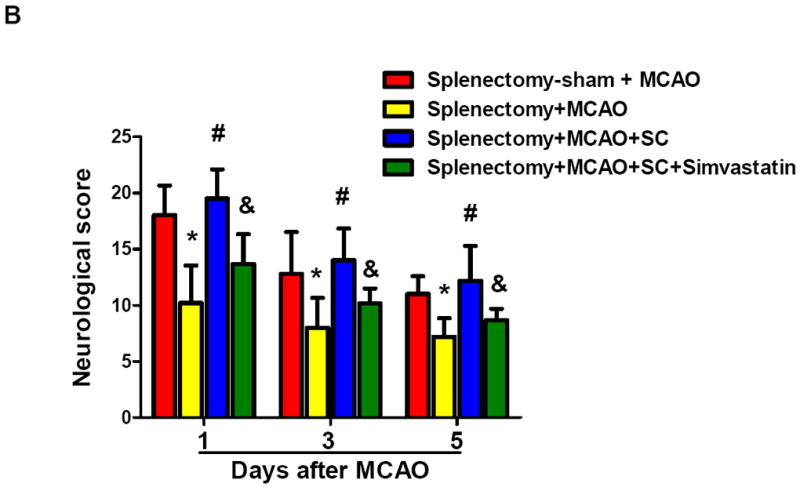
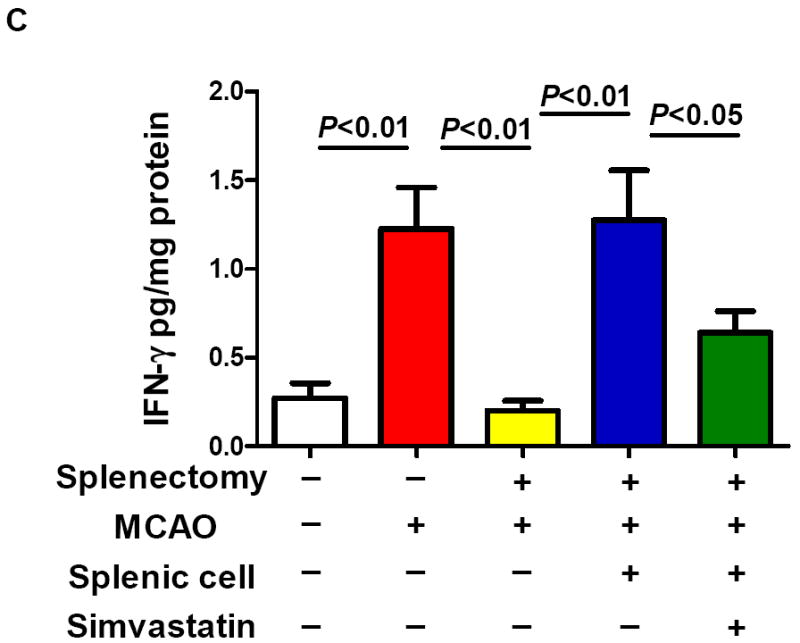
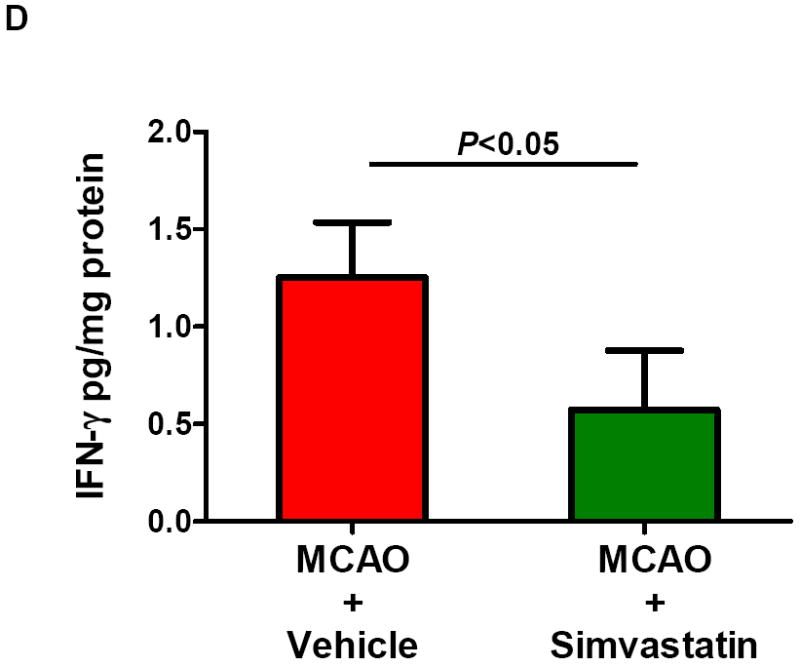
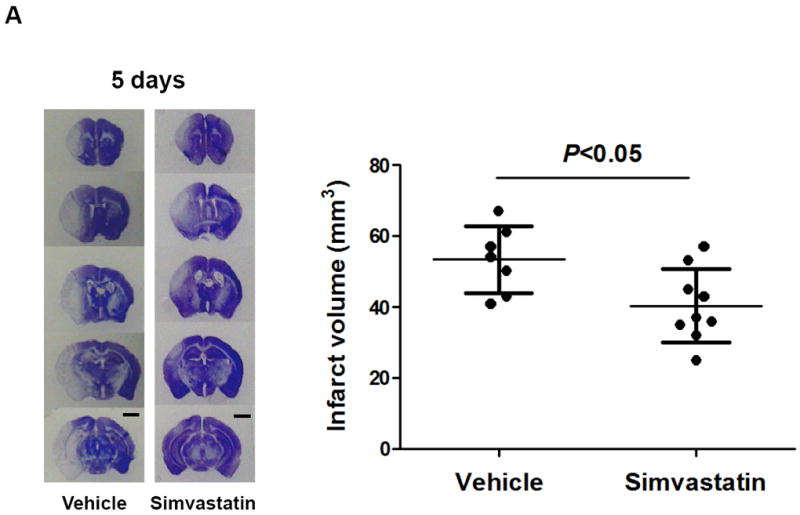
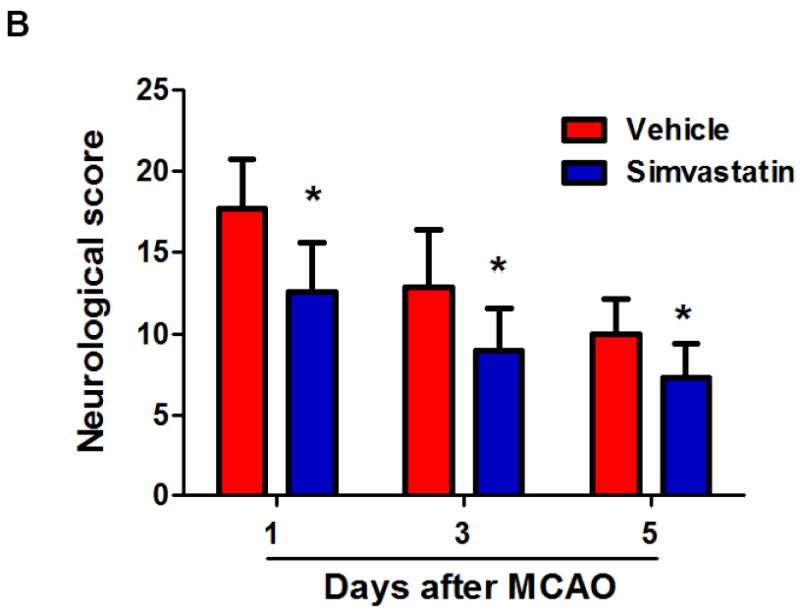
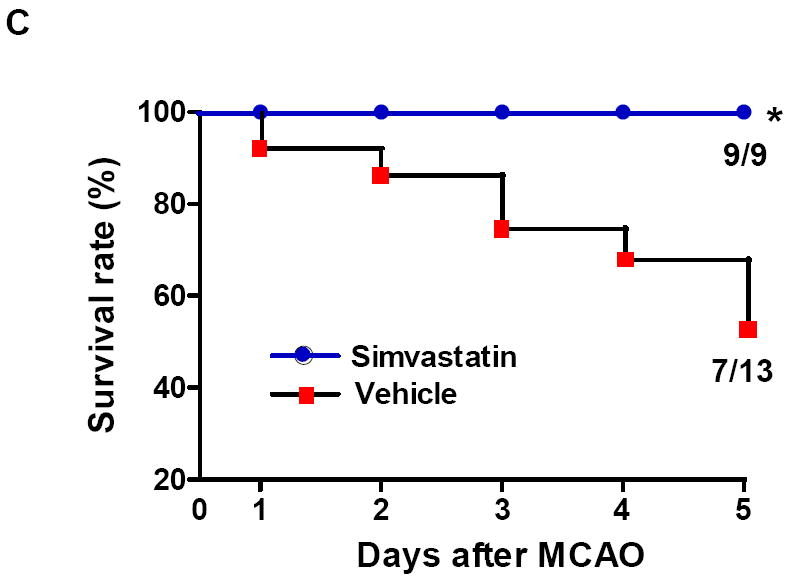
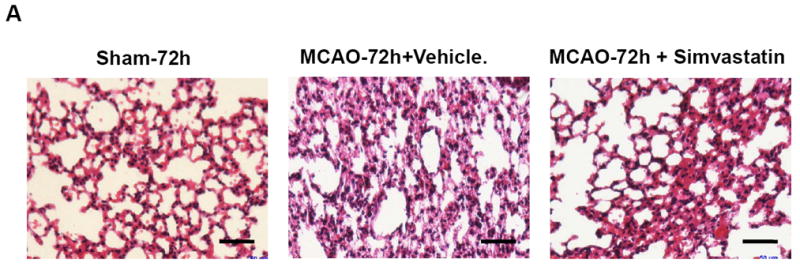
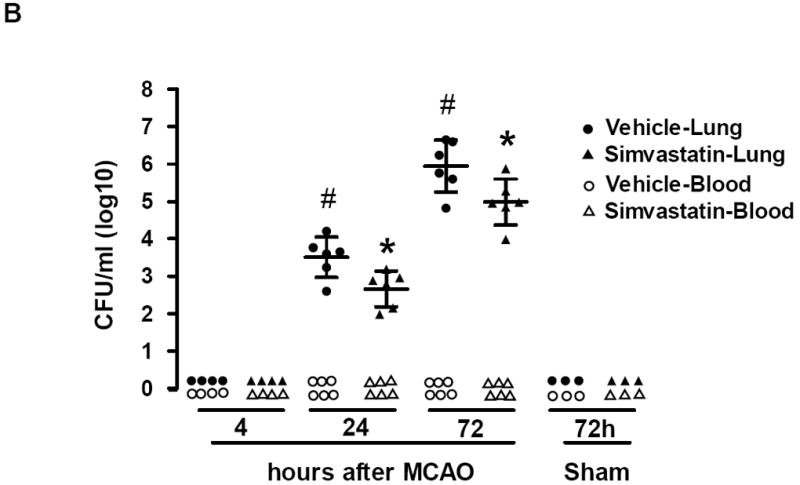
Results: Simvastatin reduced stroke-induced spleen atrophy and splenic apoptosis via increased mitochrondrial antiapoptotic Bcl-2 expression and decreased proapoptotic Bax translocation from cytosol into mitochondria. Splenectomy reduced brain interferon-γ (3 days) and infarct size (5 days) after stroke, and these effects were reversed by adoptive transfer of splenocytes. Simvastatin inhibited brain interferon-γ (3 days) and reduced infarct volume and neurological deficits (5 days) after stroke, and these protective effects were observed not only in naive stroke mice but also in splenectomied stroke mice adoptively transferred with splenocytes. Simvastatin also decreased the stroke-associated lung susceptibility to spontaneous bacterial infection.

Conclusions: Results provide the first direct experimental evidence that simvastatin ameliorates stroke-induced peripheral immunodepression by attenuating spleen atrophy and lung bacterial infection. These findings contribute to a better understanding of the beneficial effects of statins in the treatment of stroke.


Figures

Figure 1
Figure 1. Simvastatin attenuates stroke-induced splenic atrophy and body weight loss
A, Quantification of spleen weights and cell numbers in sham control mice and MCAO mice treated with vehicle or simvastatin. B, Representative pictures of spleens in sham and MCAO mice at the indicated time points of MCAO. Scale bar = 2 mm. C, Quantification of body weight loss in the indicated groups. A & C: n=7-9 mice per group per time point; ## P<0.01 vs. respective sham control; * P<0.05, **P<0.01 vs. respective vehicle control at the same time point.
Figure. 2
Figure. 2. Simvastatin attenuates splenocyte apoptosis through mitochondrial pathway
A, B Mice were euthanized 12 hours or 5 days after MCAO for splenic analysis. A, Representative flow cytometric dot plots for FITC-Annexin V and propidium iodine (PI) labeling in freshly isolated splenocytes from sham control mice and MCAO mice treated with vehicle or simvastatin. Annexin V+ and PI- cells were considered early apoptotic cells (lower right quadrant). B, Flow cytometric analysis of stroke-induced splenocyte apoptosis in the simvastatin- and vehicle- treated mice at the indicated time points after MCAO. The percentage of apoptotic cells was calculated from the ratio of apoptotic cells to total cells counted. Data represent the mean ± SD of four independent experiments. # P<0.05 vs. sham control; * P<0.05 vs. vehicle control. C, Representative flow cytometric dot plots showing THC-induced splenocyte apoptosis in vitro. D, Flow cytometric analysis of THC-induced splenocyte apoptosis in vitro. Data represent the mean ± SD of five independent experiments. #P<0.05 vs. Vehicle; *P<0.05 vs. the THC only group. E, Western blot analysis of the protein levels of mitochondrial Bcl-2, mitochondrial and cytosolic Bax in the splenic cells from sham control mice and MCAO mice treated with vehicle or simvastatin. β-actin and COX IV were used as loading controls for cytosolic and mitochondrial fractions, respectively. Data are presented as mean ± SD of four independent experiments (n=4 mice/group for each experiment). * P<0.05, ** P<0.01 vs. sham control; # P<0.05 vs. vehicle control.
Figure 3
Figure 3. Simvastatin reduces brain IFNγ protein expression and brain damage contributed by splenic cells
Splenectomy and adoptive transfer of splenocytes were performed as described in the Method. Stroke analysis was performed 5 days after MCAO. A, Representative images of cresyl violet-stained coronal brain sections (upper) and Quantitative analysis of infarct volumes (lower). Scale bar = 2 mm. B, The 28-point neurological scoring at indicated time points (n= 6-8 survived mice/group). *P<0.05 vs. sham-splenectomized MCAO mice; #P<0.05 vs. splenectomized MCAO mice, and &P<0.05 vs. splenectomized MCAO mice with adoptive transfer of splenic cells (SC) at the same time point. C and D, ELISA measurement of IFN-γ protein concentrations in the ipsilateral hemispheres from the indicated groups at 72h after MCAO. n=5 mice/group.
Figure 4
Figure 4. Simvastatin reduces ischemic brain injury and animal mortality 5 days after MCAO
A, Representative images of cresyl violet-stained coronal brain sections (left panels) and Quantitative analysis of infarct volumes (right panels). Scale bar = 2 mm. B, The 28-point neurological scoring at indicated time points in the vehicle-treated and simvastatin-treated mice. n = 7-9 per group. *P<0.05 vs. vehicle-treated group at the same time point. C, Animal survival rate from the same experiments was recorded daily for 5 days after MCAO. n=9 for simvastatin- and n=13 for vehicle-treated mice. *p<0.05, log-rank test compared with vehicle-treated mice.
Figure 5
Figure 5. Simvastatin attenuates stroke-induced lung susceptibility to spontaneous bacterial infection
A, Representative images of HE-stained lung sections (6-μm thick) showing typical signs (thickening of alveolar walls and neutrophilic infiltrates) of pneumonia from MCAO (72h) but not from sham animals. Scale bar = 50 μm. B, Lungs and blood samples from sham and MCAO mice treated with vehicle or simvastatin were prepared for bacteriological analysis at the indicated time points after surgery. Data are expressed as CFU/ml (log 10) in blood or lung tissue homogenate. N=3-6 per group. # P<0.05 vs. vehicle control at 4h after MCAO; * P<0.05 vs. vehicle control at same time point.

References

    1. Dirnagl U, Klehmet J, Braun JS, Harms H, Meisel C, Ziemssen T, et al. Stroke-induced immunodepression: experimental evidence and clinical relevance. Stroke. 2007;38(2 Suppl):770–773. - PubMed
    1. Iadecola C, Anrather J. The immunology of stroke: from mechanisms to translation. Nat Med. 2011;17:796–808. - PMC - PubMed
    1. Brait VH, Arumugam TV, Drummond GR, Sobey CG. Importance of T lymphocytes in brain injury, immunodeficiency, and recovery after cerebral ischemia. J Cereb Blood Flow Metab. 2012;32:598–611. - PMC - PubMed
    1. Westendorp WF, Nederkoorn PJ, Vermeij JD, Dijkgraaf MG, van de Beek D. Post-stroke infection: a systematic review and meta-analysis. BMC Neurol. 2011;11:110. - PMC - PubMed
    1. Katzan IL, Cebul RD, Husak SH, Dawson NV, Baker DW. The effect of pneumonia on mortality among patients hospitalized for acute stroke. Neurology. 2003;60:620–625. - PubMed

Publication types

MeSH terms