. 2013 Feb 6;33(6):2254-67.
doi: 10.1523/JNEUROSCI.2984-12.2013.

Signal multiplexing and single-neuron computations in lateral intraparietal area during decision-making

Affiliations

Signal multiplexing and single-neuron computations in lateral intraparietal area during decision-making

Miriam L R Meister et al. J Neurosci. .

Abstract

Previous work has revealed a remarkably direct neural correlate of decisions in the lateral intraparietal area (LIP). Specifically, firing rate has been observed to ramp up or down in a manner resembling the accumulation of evidence for a perceptual decision reported by making a saccade into (or away from) the neuron's response field (RF). However, this link between LIP response and decision formation emerged from studies where a saccadic target was always stimulating the RF during decisions, and where the neural correlate was the averaged activity of a restricted sample of neurons. Because LIP cells are (1) highly responsive to the presence of a visual stimulus in the RF, (2) heterogeneous, and (3) not clearly anatomically segregated from large numbers of neurons that fail selection criteria, the underlying neuronal computations are potentially obscured. To address this, we recorded single neuron spiking activity in LIP during a well-studied moving-dot direction-discrimination task and manipulated whether a saccade target was present in the RF during decision-making. We also recorded from a broad sample of LIP neurons, including ones conventionally excluded in prior studies. Our results show that cells multiplex decision signals with decision-irrelevant visual signals. We also observed disparate, repeating response "motifs" across neurons that, when averaged together, resemble traditional ramping decision signals. In sum, neural responses in LIP simultaneously carry decision signals and decision-irrelevant sensory signals while exhibiting diverse dynamics that reveal a broader range of neural computations than previously entertained.


Figures

Figure 1.
Figure 1.
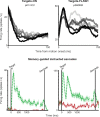
Visual stimulation of the response field (RF) changes neural response during decision-making for the LIP neurons in our sample with persistent activity (n = 47). A, Visually guided (top) and memory-guided (bottom) instructed saccade tasks. In both tasks, the monkey began by fixating a central spot. A saccadic target then appeared either in the RF of the neuron or in the location diametrically opposite. In the memory-guided saccade task, the target disappeared 100 ms after its onset, whereas it remained on in the visually guided saccade trial for the whole trial. After a variable delay period, the fixation point disappeared, cuing the monkey to make a saccade to the target location for reward. B, Targets-ON (top) and Targets-FLASH (bottom) decision tasks. Monkeys performed a 2AFC dot motion direction–discrimination task. On half the trials (interleaved), the choice targets remained on throughout the trial (Targets-ON); in the other half of trials, the targets were only flashed at the start of the trial (Targets-FLASH). One choice target was placed in the RF of the neuron, and the other was placed in the location diametrically opposite. In the Targets-FLASH task, the targets disappeared before dot motion onset, whereas the targets remained on in the Targets-ON condition for the whole trial. Strength of motion (% coherence) varied from trial to trial. Duration of the dot motion was controlled by the experimenter (500–1000 ms during physiology, uniform distribution). C, Population response is similar during visually guided and memory-guided saccade tasks. Firing rate of 47 LIP neurons with persistent activity (normalized to the dynamic range of each neuron) is shown during both visually and memory-guided saccade tasks (solid and dashed line, respectively). Left, Responses aligned to target appearance (“Target on”). Right, Aligned to saccade (“Saccade”). Dashed vertical line marked “Target off” indicates time at which the target was extinguished during memory-guided trials. Green indicates trials when the target appeared in the RF of the neuron (“In-RF”); and red, when it appeared in a location opposite (“Out-RF”). Shaded regions indicate variability produced by the middle 68% of 100 bootstrapped values of firing rate. D, Population response during decision-making depends on visual stimulation of the RF. Firing rate (normalized same as Fig. 1) of 47 cells with persistent activity is shown during both Targets-ON and Targets-FLASH decision trials (solid line and dashed line, respectively). Firing rate is aligned to trial events marked by vertical lines. Dashed vertical line indicates when the targets disappeared in the Targets-FLASH condition (“Targets off”). Green indicates trials in which the choice saccade was made to the In-RF location; and red, to the Out-RF location (both curves are collapsed over all coherences). Only correct trials are included in this analysis, except for 0% coherence trials, which are segregated by choice. Shaded regions indicate variability middle 68% of 1000 bootstrapped firing rate values. See Figures 7 and 2, respectively, for plots of behavioral performance and neural response for each coherence.
Figure 2.
Figure 2.
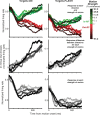
The main effect of Targets-FLASH on LIP response is similar across all conditions (each motion coherence) that were summed together in Figure 1D. Population firing rate during Targets-ON and Targets-FLASH trials for each coherence. Each panel shows the firing rate of the n = 47 neurons during Targets-ON and Targets-FLASH trials for a different coherence value. Green indicates In-RF choice; red, an Out-RF choice. Solid line indicates Targets-ON trials; dashed line, indicates Targets-FLASH trials. Darker color indicates higher motion coherence. Firing rate was computed as a 100 ms running mean.
Figure 3.
Figure 3.
LIP population response during decisions depends on motion strength in two ways: conventional (directional coherence dependence) and unexpected (nondirectional coherence dependence). Normalized firing rate of n = 47 cells is aligned to the start of dot motion. Only correct trials are plotted, as well as all trials of 0% motion coherence, where there is no correct choice. Firing rate computed as a 100-ms running mean. Stronger motion strengths are indicated by darker shades. Top, Firing rate during decision epoch for each direction (green and red indicate motion toward and away from RF, respectively) and motion strength (darker colors indicate higher motion strength) shows two simultaneous forms of motion strength dependence: steeper ramping for higher motion strengths simultaneously occurs with overall lower firing rate for higher motion strengths. Middle, The conventional form of firing rate dependence on motion strength is isolated. The firing rate of In-RF target choices minus Out-RF choices is plotted across the decision epoch. Higher motion strength trials show bigger response differences between In-RF and Out-RF choices. Bottom, The unexpected inverse dependence of firing rate on motion strength is isolated. Firing rate is plotted across the decision epoch for each motion strength. The firing rate vector for each motion strength was calculated by first computing the firing rate vectors for the two separate directions of a motion strength (shown in the standard PSTH in the top row), and then averaging those two vectors together. This analysis reveals that higher motion strength trials have lower firing rates.
Figure 4.
Figure 4.
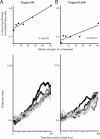
The putative neural correlate of evidence accumulation can be derived from LIP population response. Top, The response difference between In-RF and Out-RF choices for n = 47 cells during motion viewing (first 700 ms) is plotted for each coherence for A (Targets-ON) and B (Targets-FLASH) trials, illustrating larger response differences for higher coherences. Bottom, ROC analysis of the same data again illustrates putative evidence accumulation signals because during trials of stronger motion strengths, the distributions of spike counts between In-RF and Out-RF choices were less overlapping, so an ideal observer could more correctly predict the monkey's behavior across time for both A (Targets-ON) and B (Targets-FLASH) trials.
Figure 5.
Figure 5.
Single-neuron responses show inverse, nondirectional dependence on motion strength. Each column shows one neuron's response (letter and numbers above the plots indicate unique recording session codes). Top: The firing rate of individual neurons can be strongly, inversely related to the strength of motion in both Targets-ON (left) and Targets-FLASH (right) decision tasks. Firing rate vectors for In-RF and Out-RF choices (correct trials only except for 0% coherence trials) are computed separately and then averaged together, producing the neural response to each motion strength plotted here. Darker lines represent firing rate for higher motion strengths. Bottom: Each neuron is a “conventional” LIP cell in that it exhibits robust persistent activity in the memory-guided saccade task. Plotting format same as in Figure 1C.
Figure 6.
Figure 6.
Targets-NONE decision task reveals that a total lack of visual stimulation of the RF reduces the inverse coherence dependence. A, Targets-NONE decision task schematic. This task is the same as Targets-ON (Fig. 1B, top), except that choice targets never appear. Targets-NONE trials were interleaved with Targets-ON trials in a recording session. B, Neural population response during decision tasks. Firing rate of n = 10 cells with persistent activity is shown during both Targets-ON and Targets-NONE decision tasks (solid and dashed line, respectively). Same format as Figure 1D. C, Population response of n = 10 cells during decision, separated by motion strength is aligned to the start of dot motion. Same format as Figure 3.
Figure 7.
Figure 7.
The effect in Figures 1D and 3B is likely not the result of a difference in behavioral performance between conditions because behavioral performance was similar between Targets-ON, Targets-FLASH, and Targets-NONE decision tasks. Proportion correct is plotted as a function of motion viewing duration, separated by task and motion strength. Transparent shading indicates ±1 SEM by bootstrapping trials (see Data analysis). Data in this figure are taken from the electrophysiological recording sessions and from additional sessions (some coherences not shown for visual clarity; similar effects were observed). Behavioral performance for Monkey P in A, and Monkey J in B during the Targets-ON and Targets-FLASH decision tasks. Monkey P, 68 sessions (57,222 trials); Monkey J, 16 (11,172 trials). C, Performance during Targets-ON and Targets-NONE decision trials. Only Monkey P; 7978 trials. D, Performance during Targets-ON and Targets-FLASH decision task in which motion viewing on a trial was 100–900 ms. Only Monkey P; 11,251 trials.
Figure 8.
Figure 8.
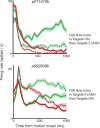
Single neurons demonstrate the main effects and also reveal idiosyncrasies. Effects of RF stimulation in 2 different neurons during decision tasks. Each plot shows a single neuron. Top, Higher firing rate in Targets-ON trials than in Targets-FLASH trials (i.e., confirming the main effect shown in the population responses in Fig. 1D). Bottom, Higher firing rate for Targets-FLASH trials (i.e., an inverted effect relative to the population average). Same color key as Figure 1D.
Figure 9.
Figure 9.
Weak relation between persistent activity and decision-related signals. A, Single neuron example where persistent activity during the memory delay of instructed saccade task is clearly dissociated from decision signals during decision-making. This neuron shows weak persistent activity during the memory-guided saccade task (left), yet strong decision signals during the decision task (right). B, Scatterplot shows weak relationship between persistent activity and selectivity in the decision epoch for the entire population of 80 cells. Spatial selectivity of each cell (n = 80) is plotted in units of d′. d′ during motion discrimination of the decision task is plotted as a function of d′ during the memory delay period of the memory-guided saccade task. r2 = 0.12, p = 0.0014 (type II regression, gray line). In the decision task, decision epoch was 200–700 ms after dot motion onset.
Figure 10.
Figure 10.
Diverse responses of individual LIP neurons combine to show conventional ramping activity of the population response. A, The responses of 6 different example neurons are shown. Left, The firing rate of each example neuron is shown for the first 700 ms of dot motion. Right, Directional coherence dependence of each neuron is shown by plotting the difference between average response for In-RF and Out-RF choices during motion discrimination (first 700 ms of dot motion) as a function of coherence. The slopes of the fit lines are reported on the plots in units of spikes per 100% coherence ±SEM. B, Combination of the diverse responses of the 6 cells in A yields an average response with conventional decision signals. C, The population response of the entire population of cells (n = 80). Slopes of the fit lines are reported in the same units as A, except that normalized firing rate units are used instead of spikes.
Figure 11.
Figure 11.
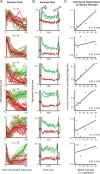
Eighty cell responses are segregated into 6 diverse groups based on their response dynamic during dot motion. Each row displays the responses of one group. A, The response of each neuron in a group is plotted during decision formation (thin lines), along with the group average response (thicker lines). Firing rate is normalized and plotted as a running mean (100 ms bins) for In-RF and Out-RF choices. These response vectors were used originally to assign the cells to groups with an automated k-means algorithm (see Data analysis). B, The average response of each cell group exhibits persistent activity in the memory-guided saccade task. Average response is plotted during the instructed saccade tasks for each cell group. C, The directional coherence dependence of each cell group is shown by plotting the average response difference between In-RF and Out-RF choices (during first 700 ms of dot motion) as a function of coherence. Slopes are reported in units of normalized firing rate per 100% coherence ± SEM.
Figure 12.
Figure 12.
Dramatic heterogeneity of LIP can be observed outside of the conventionally focused upon epochs of the memory delay period in the instructed saccade task and the decision formation period of the decision task. The individual responses of two example neurons illustrate that, although a neuron may exhibit persistent activity and even directional coherence dependence during decision formation, neural responses are categorically distinct from “conventional” cells because these neurons switch spatial selectivity after dot motion viewing. Each row shows the response of one cell. A, PSTH of each cell during the memory-guided saccade task (dashed line) shows that both cells exhibited conventional persistent activity. Solid lines indicate activity during visually guided saccades. B, PSTH of each cell during the dot motion decision task shows that both cells exhibit choice-predictive activity during decision formation. However, both cells switch their spatial selectivity after the dot motion epoch in Targets-ON trials (the bottom cell does not switch selectivity during Targets-FLASH trials). Solid and dashed lines indicate, respectively, Targets-ON and Targets-FLASH trials. C, Each cell appears to have some directional coherence dependence, as illustrated by plotting the average response difference between In-RF and Out-RF choices (during first 700 ms of dot motion) as a function of coherence. Slopes are reported in units of spikes/s per 100% coherence ±SEM.

References

    1. Basso MA, Wurtz RH. Modulation of neuronal activity in superior colliculus by changes in target probability. J Neurosci. 1998;18:7519–7534. - PMC - PubMed
    1. Beck JM, Ma WJ, Kiani R, Hanks T, Churchland AK, Roitman J, Shadlen MN, Latham PE, Pouget A. Probabilistic population codes for Bayesian decision making. Neuron. 2008;60:1142–1152. - PMC - PubMed
    1. Ben Hamed S, Duhamel JR. Ocular fixation and visual activity in the monkey lateral intraparietal area. Exp Brain Res. 2002;142:512–528. - PubMed
    1. Bennur S, Gold JI. Distinct representations of a perceptual decision and the associated oculomotor plan in the monkey lateral intraparietal area. J Neurosci. 2011;31:913–921. - PMC - PubMed
    1. Bernacchia A, Seo H, Lee D, Wang XJ. A reservoir of time constants for memory traces in cortical neurons. Nat Neurosci. 2011;14:366–372. - PMC - PubMed

Publication types

LinkOut - more resources