. 2013 Feb 6;33(6):2639-49.
doi: 10.1523/JNEUROSCI.4377-12.2013.

Receptive-field subfields of V2 neurons in macaque monkeys are adult-like near birth

Affiliations

Receptive-field subfields of V2 neurons in macaque monkeys are adult-like near birth

Bin Zhang et al. J Neurosci. .

Abstract

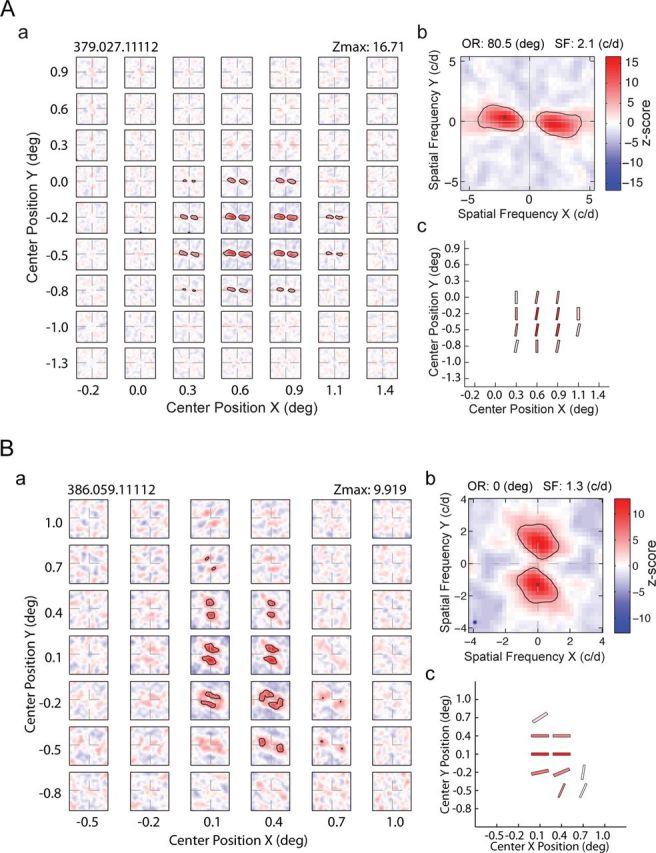
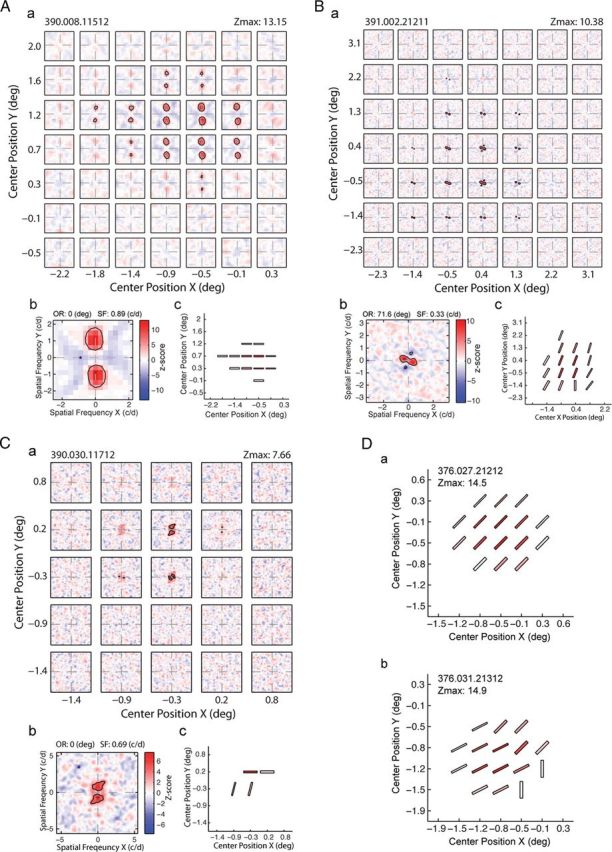
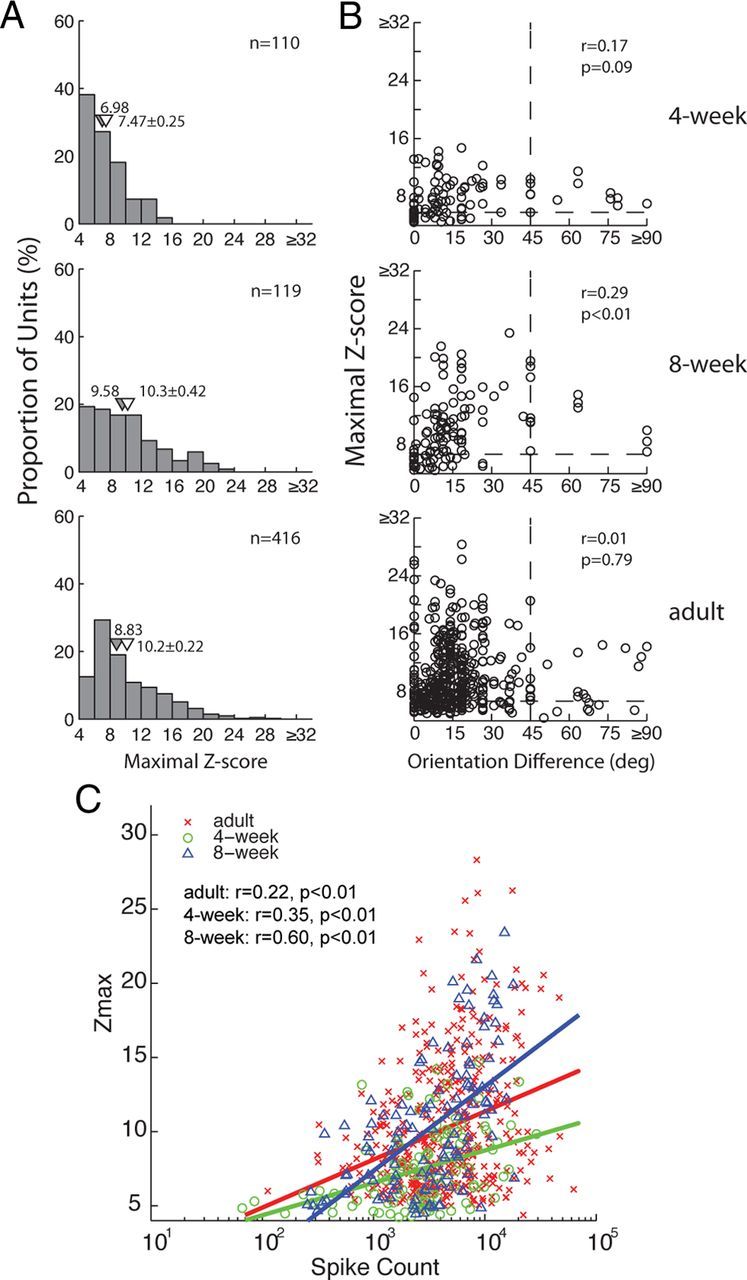
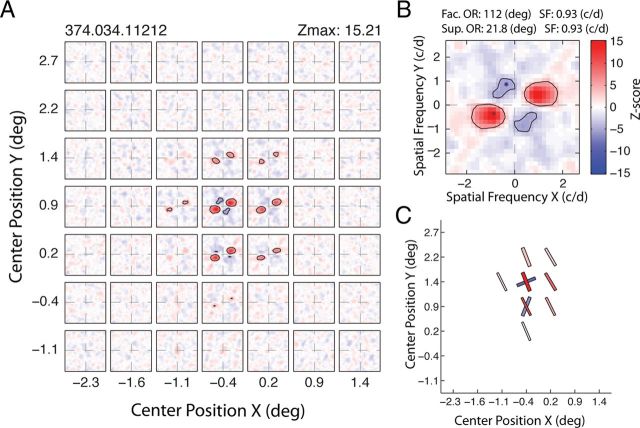
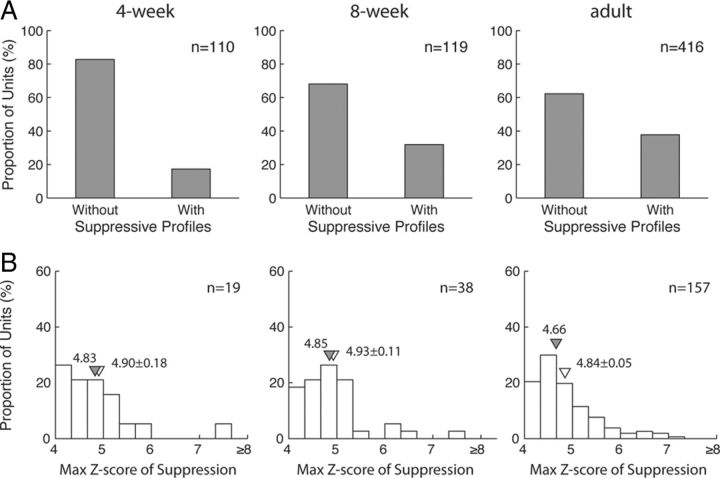
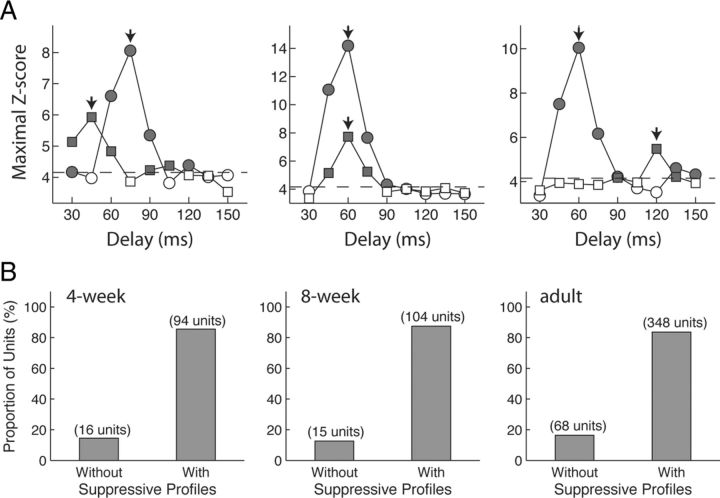
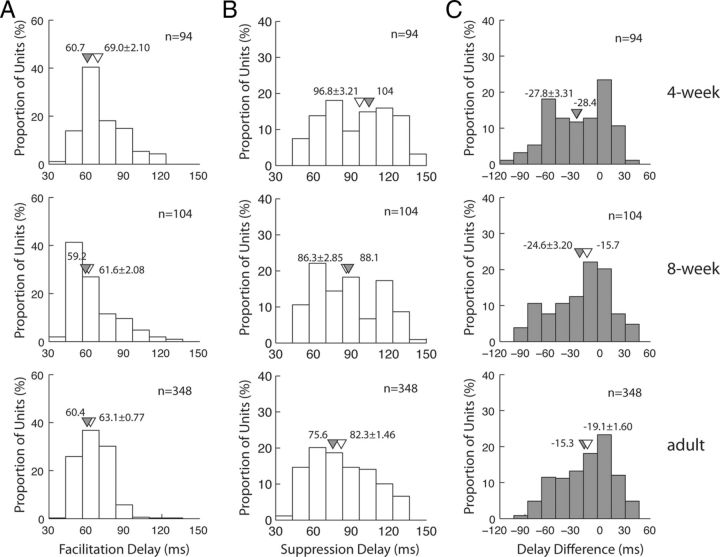
Infant primates can discriminate texture-defined form despite their relatively low visual acuity. The neuronal mechanisms underlying this remarkable visual capacity of infants have not been studied in nonhuman primates. Since many V2 neurons in adult monkeys can extract the local features in complex stimuli that are required for form vision, we used two-dimensional dynamic noise stimuli and local spectral reverse correlation to measure whether the spatial map of receptive-field subfields in individual V2 neurons is sufficiently mature near birth to capture local features. As in adults, most V2 neurons in 4-week-old monkeys showed a relatively high degree of homogeneity in the spatial matrix of facilitatory subfields. However, ∼25% of V2 neurons had the subfield map where the neighboring facilitatory subfields substantially differed in their preferred orientations and spatial frequencies. Over 80% of V2 neurons in both infants and adults had "tuned" suppressive profiles in their subfield maps that could alter the tuning properties of facilitatory profiles. The differences in the preferred orientations between facilitatory and suppressive profiles were relatively large but extended over a broad range. Response immaturities in infants were mild; the overall strength of facilitatory subfield responses was lower than that in adults, and the optimal correlation delay ("latency") was longer in 4-week-old infants. These results suggest that as early as 4 weeks of age, the spatial receptive-field structure of V2 neurons is as complex as in adults and the ability of V2 neurons to compare local features of neighboring stimulus elements is nearly adult like.


Figures

Figure 1.
Figure 1.
Schematic diagram of the LSRC analysis (see Materials and Methods for details). A, The visual stimuli and analysis procedure used to derive LSRC maps. We calculated a cross-correlation between the spike train and the amplitude spectra of Gaussian-windowed stimuli to obtain a two-dimensional frequency tuning function for the given subfield. B, An example of the spike-triggered average of local spectra (local spectral selectivity map or subfield). The x- and y-axes show vertical and horizontal spatial frequency in cycle/degree (c/d). The facilitations and suppressions are indicated by red and blue, respectively. Asterisks show the location of the highest and lowest z-scores that correspond to the frequency of the maximum facilitation and suppression, respectively. The scale bar with z-scores is illustrated on the right. The distance from the origin to the peak of the excitation indicated the optimal spatial frequency for the local subfield of the receptive field. The angle perpendicular to the line connecting the origin and the excitation peak (with the horizontal axis) depicted the optimal orientation for the local subfield (curved arrow).
Figure 2.
Figure 2.
Aa, Ba, A spatial matrix of subfields with facilitatory profiles in a V2 neuron from an adult monkey that exhibited spatial homogeneity of orientation and spatial frequency within its receptive field (Aa) and an adult V2 neuron with highly heterogeneous subfield matrix (Ba). Ab, Bb, Detail profile of the subfield with the maximum z-score. Ac, Bc, Schematic diagram showing the preferred orientation (bar angle) and spatial frequencies (width), and the maximum z-scores (saturation) of the subfields. c/d, Cycles per degree; deg, degree.
Figure 3.
Figure 3.
Aa, Ba, Ca, A spatial matrix of subfields with facilitatory profiles in a V2 neuron from a 4-week-old monkey that exhibited spatial homogeneity of orientation and spatial frequency within its receptive field (Aa) and V2 neurons with heterogeneous subfield matrix from 4-week-old infants (Ba, Ca). Ab, Bb, Cb, Detail profiles of the subfields with the maximum z-score. Ac, Bc, Cc, Schematic diagrams showing the preferred orientations (bar angle) and spatial frequencies (width), and the maximum z-scores (saturation) of the subfields. Da,Db, Schematic diagrams showing the preferred orientation (bar angle) and spatial frequencies (width), and the maximum z-scores (saturation) of the subfields in a V2 neuron from an 8-week-old infant with highly homogeneous subfield matrix (Da) and a neuron with a heterogeneous subfield matrix (Db). c/d, Cycles per degree; deg, degree.
Figure 4.
Figure 4.
Spatial homogeneity of local spectral selectivity maps with facilitatory profiles across the receptive fields in infants and adults. A, Histogram illustrating the distribution of the maximum orientation differences between neighboring pairs of subfields. B, Distribution of the maximum spatial frequency differences between neighboring pairs of subfields. C, The maximum orientation differences between a pair of neighboring subfields within each neuron are on the x-axis, and SF differences are on the y-axis. Filled triangles indicate median values, and open triangles indicate means (±SE). Note that several units in each age group contained just one subfield, hence lowering the total number of units for this analysis.
Figure 5.
Figure 5.
Comparisons of response strength and reliability (z-max) of V2 neurons in infants and adults. A, Histograms illustrating the distribution of z-max scores in adults (bottom), 4-week-old (top) and 8-week-old infants (middle). B, Scatter plots relating z-max scores of individual neurons with their maximum orientation differences between neighboring subfields. C, The z-max scores of individual neurons as a function of their total spike counts.
Figure 6.
Figure 6.
A V2 neuron from a 4-week-old infant having subfields with both facilitatory and suppressive profiles. A, Spatial matrix of subfields with both profiles. B, Detailed profile of the subfield with the maximum z-scores. Location of the highest and lowest z-scores is indicated with asterisks. C, Schematic diagram of the preferred orientations (bar angles) and spatial frequencies (widths) of subfields with the faicilitatory (red) and suppressive (blue) profiles.
Figure 7.
Figure 7.
Development of suppressive subfield profiles. A, Proportion of V2 neurons having subfields with facilitatory profiles alone (left) or with both facilitatory and suppressive profiles (right) in infants and adults. B, Comparisons of z-max scores of suppressive subfield profiles. Filled triangles indicate median values and open triangles indicate means (±SE).
Figure 8.
Figure 8.
Relationships between the suppressive profiles and the facilitatory profiles of subfields for individual V2 neurons in infants and adults. A, Distribution of differences in the preferred orientation of subfields between facilitatory and suppressive profiles. B, Distributions of the preferred spatial frequency differences of subfields between facilitatory and suppressive profiles. C, Distribution of the ratios of maximum suppressive z-scores over maximum facilitatory z-scores. Filled triangles indicate median values, and open triangles indicate means (±SE).
Figure 9.
Figure 9.
Differences in correlation delays (latency) between the facilitatory and suppressive subfields in infants and adults. A, Examples of correlation delays. The z-max values at different delays for facilitatory (circles) and suppressive (squares) profiles. Filled data points signify z-max values that are significant. Arrows indicate the latency at which the peak response occurred for facilitatory and suppressive profile, respectively. B, The proportion of V2 neurons with and without suppressive subfield profiles in 4-week-old (left), 8-week-old infants (middle), and adults (right).
Figure 10.
Figure 10.
Differences in correlation delays (latency) between the facilitatory and suppressive subfields in infants and adults. A, Distribution of the correlation delays (latency) for facilitatory subfields in infants and adults. B, Distribution of the correlation delays (latency) for suppressive subfields in infants and adults. C, Differences in correlation delays between facilitatory and suppressive profiles in infants and adults. Triangle signifies median value, and circle signifies the mean. Filled triangles indicate median values, and open triangles indicate means (±SE).

References

    1. Amir Y, Harel M, Malach R. Cortical hierarchy reflected in the organization of intrinsic connections in macaque monkey visual-cortex. J Comp Neurol. 1993;334:19–46. - PubMed
    1. Anzai A, Peng X, Van Essen DC. Neurons in monkey visual area V2 encode combinations of orientations. Nat Neurosci. 2007;10:1313–1321. - PubMed
    1. Atkinson J, Hood B, Wattam-Bell J, Anker S, Tricklebank J. Development of orientation discrimination in infancy. Perception. 1988;17:587–595. - PubMed
    1. Baldwin MK, Kaskan PM, Zhang B, Chino YM, Kaas JH. Cortical and subcortical connections of V1 and V2 in early postnatal macaque monkeys. J Comp Neurol. 2012;520:544–569. - PMC - PubMed
    1. Barone P, Dehay C, Berland M, Kennedy H. Role of directed growth and target selection in the formation of cortical pathways: prenatal development of the projection of area V2 to area V4 in the monkey. J Comp Neurol. 1996;374:1–20. - PubMed

Publication types

LinkOut - more resources