

Using susceptibility-weighted imaging to determine response to combined anti-angiogenic, cytotoxic, and radiation therapy in patients with glioblastoma multiforme
- PMID: 23393208
- PMCID: PMC3607266
- DOI: 10.1093/neuonc/nos325
Using susceptibility-weighted imaging to determine response to combined anti-angiogenic, cytotoxic, and radiation therapy in patients with glioblastoma multiforme
Abstract
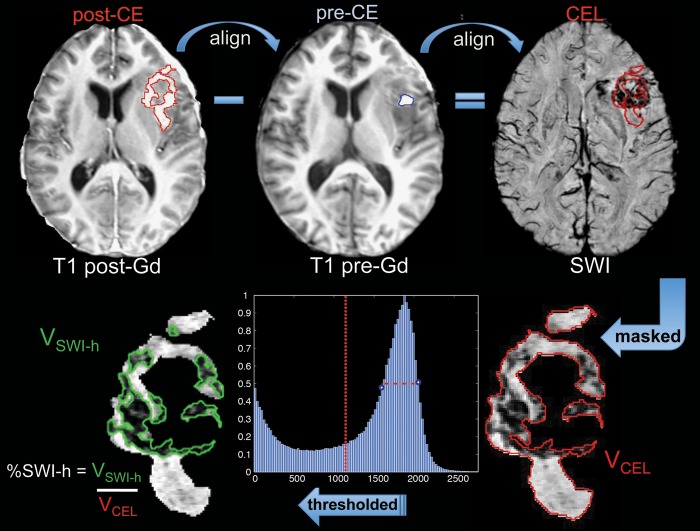
Background: The goal of this study was to investigate whether the amount of hypointense signal on susceptibility-weighted imaging within the contrast-enhancing lesion (%SWI-h) on the pretreatment scan could determine response in patients with newly diagnosed glioblastoma multiforme who received external beam radiation therapy with concomitant anti-angiogenic therapy (enzastaurin) and cytotoxic chemotherapy (temozolomide).
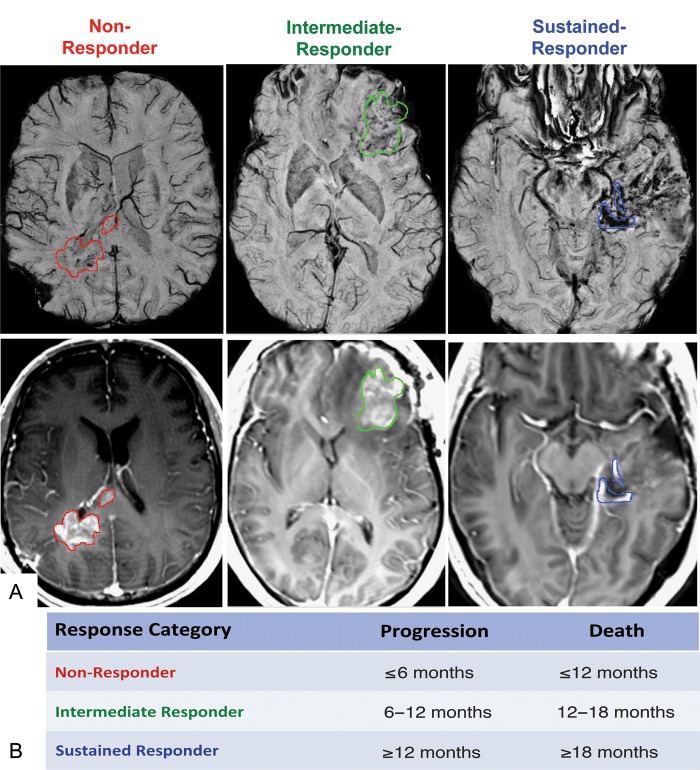
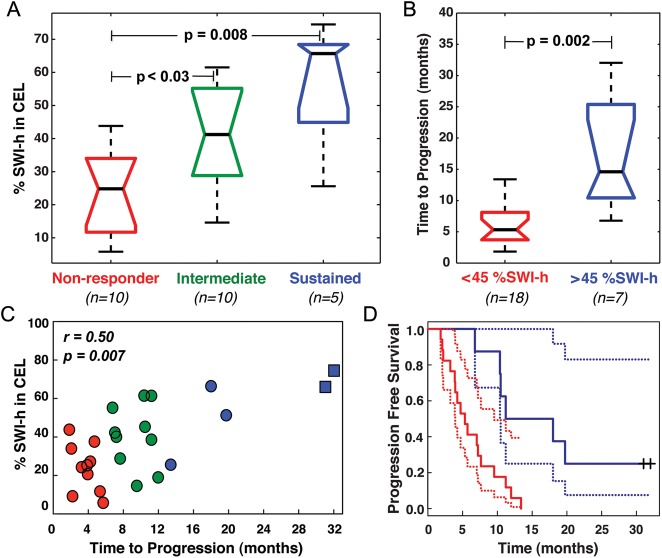
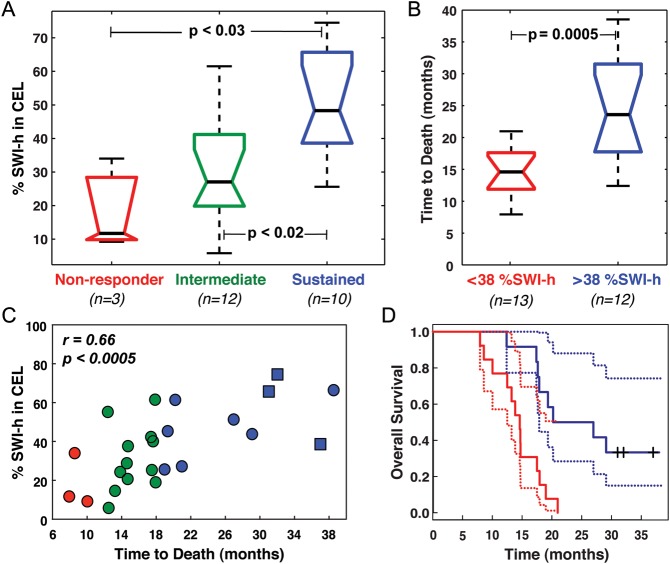
Methods: Twenty-five patients were imaged before therapy (postsurgical resection) and scanned serially every 2 months until progression. Standard clinical MR imaging and SWI were performed on a 3T scanner. %SWI-h was quantified for each patient's pretreatment scan. Time to progression and death were used to characterize patients into non-, immediate-, and sustained-response groups for both events. Cox proportional hazards models were used to assess the association between %SWI-h and both progression-free survival (PFS) and overall survival (OS). Classification and regression tree analysis were used to determine optimal cutoffs on which to split %SWI-h.
Results: For both death- and progression-based response categories, %SWI-h was significantly higher in sustained responders than in nonresponders. Cox model coefficients showed an association between %SWI-h and PFS and OS, both in univariate analysis (PFS: hazard ratio [HR] = 0.966, 95% confidence interval [CI] = 0.942-0.988; and OS: HR = 0.945, 95% CI = 0.915-0.976) and when adjusting for baseline KPS, age, sex, and resection extent (PFS: HR = 0.968, 95% CI = 0.940 -0.994; and OS: HR = 0.943, 95% CI = 0.908 -0.976). A cutoff value of 38.1% significantly differentiated patients into 2 groups based on censored OS and into non- and intermediate-response categories based on time to progression.
Conclusions: These early differences suggest that SWI may be able to predict which patients would benefit most from similar combination therapies and may assist clinicians in making important decisions about patient care.
Figures
References
-
- Folkman J. The role of angiogenesis in tumor growth. Semin Cancer Biol. 1992;3(2):65–71. - PubMed
-
- Amoroso A, Del Porto F, Di Monaco C, Manfredini P, Afeltra A. Vascular endothelial growth factor: a key mediator of neoangiogenesis. A review. Eur Rev Med Pharmacol Sci. 1997;1(1–3):17–25. - PubMed
-
- Damert A, Machein M, Breier G, et al. Up-regulation of vascular endothelial growth factor expression in a rat glioma is conferred by two distinct hypoxia-driven mechanisms. Cancer Res. 1997;57(17):3860–3864. - PubMed
-
- Wesseling P, Ruiter DJ, Burger PC. Angiogenesis in brain tumors; pathobiological and clinical aspects. J Neurooncol. 1997;32(3):253–265. - PubMed
Publication types
MeSH terms
Substances
Grants and funding
LinkOut - more resources
Full Text Sources
Other Literature Sources
Medical
