. 2013 Feb;24(3):407-18.
doi: 10.1681/ASN.2012040404. Epub 2013 Feb 7.

SPAK differentially mediates vasopressin effects on sodium cotransporters

Affiliations

SPAK differentially mediates vasopressin effects on sodium cotransporters

Turgay Saritas et al. J Am Soc Nephrol. 2013 Feb.

Abstract

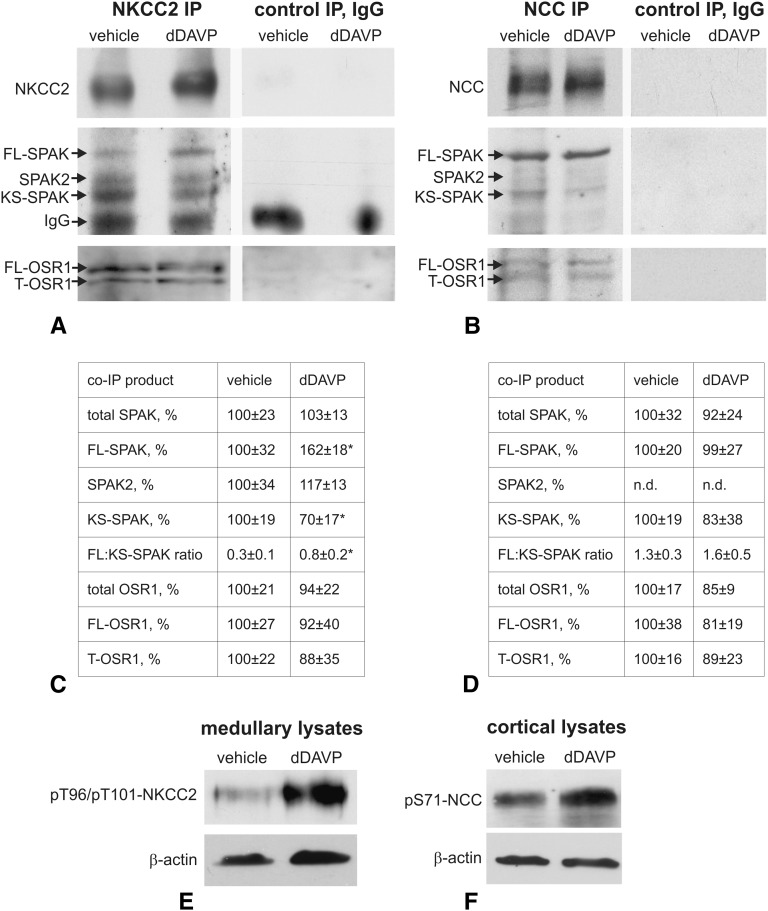
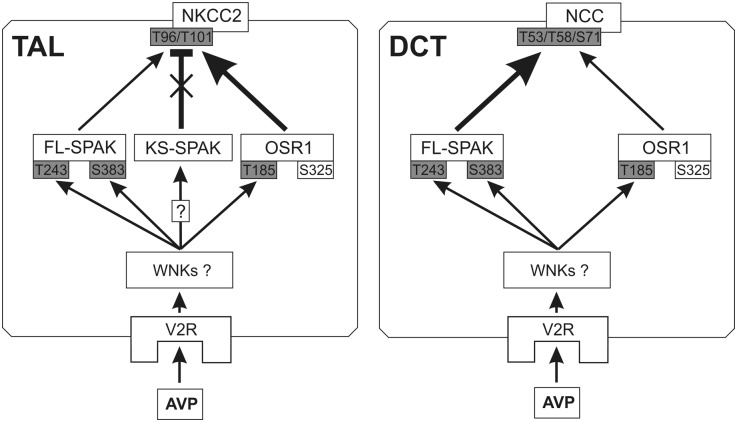
Activation of the Na(+)-K(+)-2Cl(-)-cotransporter (NKCC2) and the Na(+)-Cl(-)-cotransporter (NCC) by vasopressin includes their phosphorylation at defined, conserved N-terminal threonine and serine residues, but the kinase pathways that mediate this action of vasopressin are not well understood. Two homologous Ste20-like kinases, SPS-related proline/alanine-rich kinase (SPAK) and oxidative stress responsive kinase (OSR1), can phosphorylate the cotransporters directly. In this process, a full-length SPAK variant and OSR1 interact with a truncated SPAK variant, which has inhibitory effects. Here, we tested whether SPAK is an essential component of the vasopressin stimulatory pathway. We administered desmopressin, a V2 receptor-specific agonist, to wild-type mice, SPAK-deficient mice, and vasopressin-deficient rats. Desmopressin induced regulatory changes in SPAK variants, but not in OSR1 to the same degree, and activated NKCC2 and NCC. Furthermore, desmopressin modulated both the full-length and truncated SPAK variants to interact with and phosphorylate NKCC2, whereas only full-length SPAK promoted the activation of NCC. In summary, these results suggest that SPAK mediates the effect of vasopressin on sodium reabsorption along the distal nephron.


Figures

Figure 1.
Figure 1.
SPAK deficiency is associated with compensatory adaptation of OSR1. (A–L) SPAK and OSR1 immunostaining in TAL and DCT and double-staining with segment-specific antibodies to NKCC2 for TAL or NCC for DCT. (A–H) In WT kidneys, SPAK signal in TAL is concentrated apically (A and B). (E and F) DCT shows also cytoplasmic SPAK signal. (C, D, G, and H) Note the complete absence of SPAK signal in TAL and DCT in SPAK-deficient (SPAK−/−) kidney. (I–L) OSR1 signal is concentrated apically in TAL and DCT of WT kidneys, whereas DCT shows additional cytoplasmic signal in SPAK−/− kidneys. Note that OSR1 signal is stronger in TAL than in DCT in WT, whereas SPAK −/− shows the inverse. Bars show TAL/DCT transitions. (M) The distribution patterns of SPAK and OSR1 are schematized. Original magnification, ×400.
Figure 2.
Figure 2.
Short-term dDAVP induces differential phosphorylation of SPAK and OSR catalytic domains; confocal microscopy. (A–P) Immunolabeling of pT243-SPAK/pT185-OSR1 (pT243/pT185) and double-staining for NKCC2 in renal medulla (A–H) and cortex (I–P) of vehicle- and dDAVP-treated (30 minutes) WT and SPAK−/− kidneys. Bars indicate TAL/DCT transitions. (Q) Signal intensities (units) obtained after confocal evaluation of pT243-SPAK/pT185-OSR1 signals in medullary (mTAL) and cortical segments (cTAL, DCT) using ZEN software. Data are the mean ± SD. *P<0.05 for intrastrain differences (vehicle versus dDAVP). Note the more pronounced response to dDAVP in WT compared with SPAK−/− mice.
Figure 3.
Figure 3.
Short-term dDAVP induces phosphorylation of the regulatory domain of SPAK but not of OSR1; confocal microscopy. (A–P) Immunolabeling of pS383-SPAK/pS325-OSR1 (pS383/pS325) and double-staining for NKCC2 in renal medulla (A–H) and cortex (I–P) of vehicle- and dDAVP-treated (30 minutes) WT and SPAK−/− kidneys. Bars indicate TAL/DCT transitions. Note that dDAVP induces increases in both early and late DCT as identified by the absence or presence of intercalated cells (arrows). (Q) Signal intensities (units) obtained after confocal evaluation of pS383-SPAK/pS325-OSR1 signals in mTAL, cTAL, and DCT. Data are the mean ± SD. *P<0.05 for intrastrain differences (vehicle versus dDAVP). Note nearly absent pS325-OSR1 signal in SPAK−/− kidneys.
Figure 4.
Figure 4.
Short-term dDAVP induces phosphorylation of the regulatory domain of SPAK but not of OSR1; immunoblotting. (A–C) Representative immunoblots from WT and SPAK−/− kidneys at steady state (A) and after 30 minutes of vehicle or dDAVP treatment (B and C) show two pS383-SPAK/pS325-OSR1 (pS383/pS325)–immunoreactive bands between 50 and 75 kD in WT, whereas only the smaller product is clearly detectable in SPAK−/−. The larger product probably corresponds to pSPAK and the smaller, at least in part, to pOSR1. β-actin signals serve as the respective loading controls. (D and E) Densitometric evaluation of the immunoreactive signals normalized to loading controls shows increased signals in WT (+89% for the larger and +85% for the smaller products) but not in SPAK−/− kidneys upon dDAVP. Data are the mean ± SD. *P<0.05 for intrastrain differences.
Figure 5.
Figure 5.
Short-term dDAVP stimulates luminal trafficking of NKCC2 in WT and SPAK−/− but has no effect on NCC in either genotype. (A–F) Immunogold staining of NKCC2 in cortical TAL (A, B, E, and F) and NCC in DCT (C, D, G, and H) from WT and SPAK−/− mice after vehicle or dDAVP treatment (30 minutes). Transporters are distributed in the luminal plasma membrane (PM, arrows) and in cytoplasmic vesicles (arrowheads); a change is visualized for NKCC2 but not NCC (I and J). Numerical evaluations of PM NKCC2 signals (I) and NCC signals (J) per total of signals. Data are the mean ± SD. *P<0.05 for intrastrain differences.
Figure 6.
Figure 6.
SPAK disruption facilitates short-term dDAVP-induced NKCC2 phosphorylation but attenuates NCC phosphorylation. Taking into account the dramatic differences in steady state phosphorylation of NKCC2 and NCC between genotypes, immunoblots from WT and SPAK−/− kidney extracts are run in parallel and the detection conditions are adapted to obtain a linear range for adequate signal generation. (A and B) Representative immunoblots from WT (A) and SPAK−/− kidneys (B) after 30 minutes of vehicle or dDAVP treatment showing NKCC2, pT96/pT101-NKCC2, NCC, pS71-NCC, and pT58-NCC immunoreactive bands (all approximately 160 kD). β-actin signals serve as the respective loading controls (approximately 40 kD). (C and D) Densitometric evaluation of immunoreactive signals normalized for the loading controls. Data are the mean ± SD. *P<0.05 for intrastrain differences.
Figure 7.
Figure 7.
Short-term dDAVP selectively modulates interactions of SPAK variants with NKCC2 but has no effects on OSR1. (A and B) Representative immunoblots of precipitates obtained after immunoprecipitation of NKCC2 from medullary (A) or NCC from cortical kidney homogenates (B) of DI rats treated with vehicle or dDAVP (30 minutes). NKCC2-, NCC-, C-SPAK- (full-length SPAK, translationally truncated SPAK2, and kidney-specific truncated splice SPAK variant), and OSR1-immunoreactive bands (full-length and truncated OSR1 forms) are depicted. IgG bands are recognized owing to the identical host species for antibodies to NKCC2 and SPAK. Control immunoprecipitation with IgG is performed to exclude nonspecific binding of co-immunoprecipitates. (C and D) Results of densitometric quantification of single SPAK- and OSR1 isoforms normalized to NKCC2- (C) or NCC signals (D) and evaluation of FL-SPAK/KS-SPAK ratios. Data are the mean ± SD. *P<0.05 for intrastrain differences. (E and F) Effects of dDAVP stimulation were verified by parallel increases of pNKCC2 or pNCC signals in kidney extracts obtained before immunoprecipitation. IP, immunoprecipitation; FL, full-length; KS, kidney specific; T, truncated; n.d., not detectable, indicates no significant signal.
Figure 8.
Figure 8.
SPAK disruption attenuates dDAVP-induced water and electrolyte retention at long term. (A) Water-enriched diet (food mixed with a water-containing agar) during 3 days before dDAVP or vehicle administration strongly decreases endogenous plasma AVP levels in both genotypes compared with normal AVP levels in WT mice on a regular diet. (B–E) Urine volume and FENa, FECl, and FEK are shown. The two-tailed t test is utilized to analyze the intrastrain differences between vehicle and dDAVP treatments (*P<0.05), whereas the differences in strength of dDAVP effects between WT and SPAK−/− mice are evaluated by two-way ANOVA (**P<0.05). Data are the mean ± SD. WD, water-enriched diet; RD, regular diet.
Figure 9.
Figure 9.
SPAK disruption selectively attenuates activation of NCC upon long-term dDAVP. (A) Representative immunoblots from WT and SPAK−/− kidneys after 3 days of vehicle or dDAVP treatment showing NKCC2, pT96/pT101-NKCC2, NCC, pS71-NCC, and pT58-NCC immunoreactive bands (all approximately 160 kD). GAPDH signals serve as the respective loading controls (approximately 40 kD). (B) Densitometric evaluation of immunoreactive signals normalized to loading controls and calculation of pNCC/NCC ratios. Values obtained in WT after vehicle application are set at 100%. Data are the mean ± SD. *P<0.05 for intrastrain differences (vehicle versus dDAVP); §P<0.05 for baseline interstrain differences (WT versus SPAK−/− upon vehicle); $P<0.05 for different responses to dDAVP in WT versus SPAK−/− genotypes as analyzed by two-way ANOVA. GAPDH, glyceraldehyde-3-phosphate dehydrogenase.
Figure 10.
Figure 10.
Long-term dDAVP increases abundances of SPAK but not OSR1 variants. (A) Representative immunoblots showing SPAK and OSR1 immunoreactive bands in kidneys from WT and SPAK−/− mice after 3 days of vehicle or dDAVP treatment. GAPDH bands below the corresponding immunoblots serve as loading controls. (B) Densitometric evaluation of single immunoreactive bands normalized to loading controls. Values obtained in WT after vehicle application set as 100%. Data are the mean ± SD. *P<0.05 for intrastrain differences (vehicle versus dDAVP). GAPDH, glyceraldehyde-3-phosphate dehydrogenase; n.d., not detectable, indicates no significant signal.
Figure 11.
Figure 11.
Proposed model of AVP-WNK-SPAK/OSR1-NKCC2/NCC signaling in the distal nephron. Arrows indicate the downstream effects of V2R activation, and the T bar indicates inhibition. The thickness of the arrows indicates the significance of the respective kinases and their actions in AVP-induced phosphorylation of NKCC2 or NCC. Boxes shaded in gray indicate phosphoacceptor sites activated by AVP signaling. In TAL, AVP attenuates the inhibitory action of KS-SPAK (cross) and facilitates the actions of FL-SPAK and OSR1. In DCT, expression of KS-SPAK is nearly absent and FL-SPAK plays the dominant role in AVP signaling. It is presently unclear which WNK isoforms mediate AVP signaling upstream of SPAK/OSR1.

References

    1. Gamba G: Molecular physiology and pathophysiology of electroneutral cation-chloride cotransporters. Physiol Rev 85: 423–493, 2005 - PubMed
    1. Simon DB, Karet FE, Hamdan JM, DiPietro A, Sanjad SA, Lifton RP: Bartter’s syndrome, hypokalaemic alkalosis with hypercalciuria, is caused by mutations in the Na-K-2Cl cotransporter NKCC2. Nat Genet 13: 183–188, 1996 - PubMed
    1. Simon DB, Nelson-Williams C, Bia MJ, Ellison D, Karet FE, Molina AM, Vaara I, Iwata F, Cushner HM, Koolen M, Gainza FJ, Gitleman HJ, Lifton RP: Gitelman’s variant of Bartter’s syndrome, inherited hypokalaemic alkalosis, is caused by mutations in the thiazide-sensitive Na-Cl cotransporter. Nat Genet 12: 24–30, 1996 - PubMed
    1. Vitari AC, Deak M, Morrice NA, Alessi DR: The WNK1 and WNK4 protein kinases that are mutated in Gordon’s hypertension syndrome phosphorylate and activate SPAK and OSR1 protein kinases. Biochem J 391: 17–24, 2005 - PMC - PubMed
    1. Uchida S: Pathophysiological roles of WNK kinases in the kidney. Pflugers Arch 460: 695–702, 2010 - PubMed

Publication types

MeSH terms

LinkOut - more resources