. 2013;8(2):e54201.
doi: 10.1371/journal.pone.0054201. Epub 2013 Feb 5.

A method for comparing multivariate time series with different dimensions

Affiliations

A method for comparing multivariate time series with different dimensions

Avraam Tapinos et al. PLoS One. 2013.

Abstract

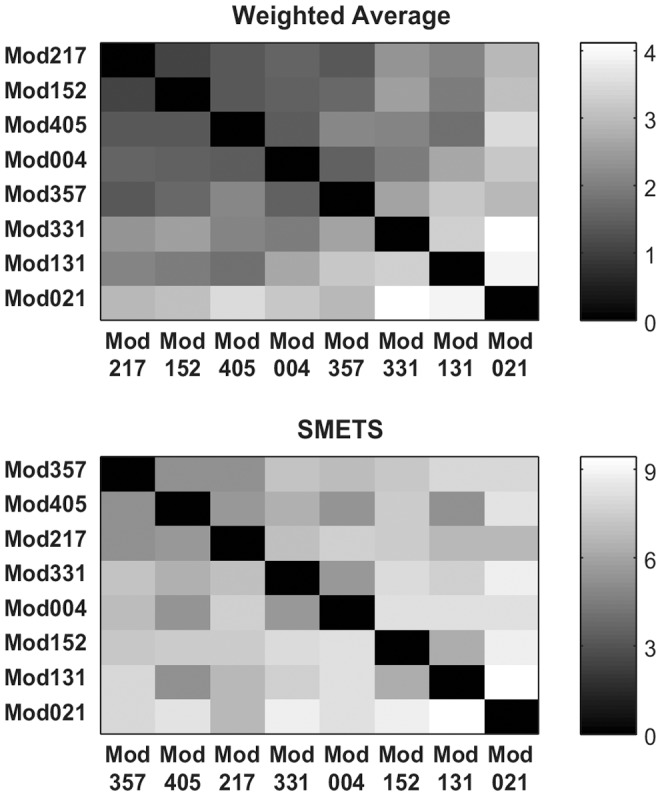
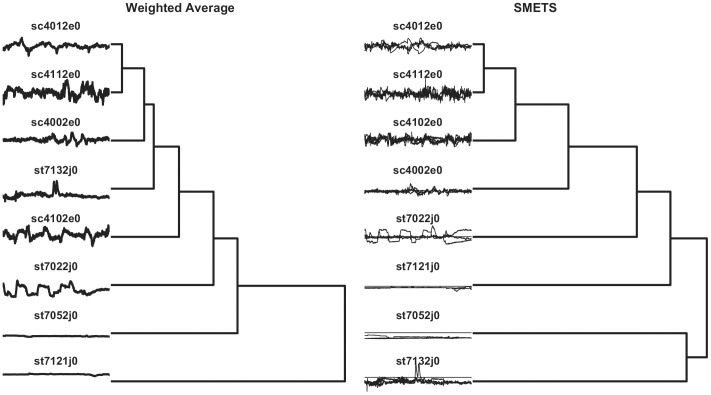
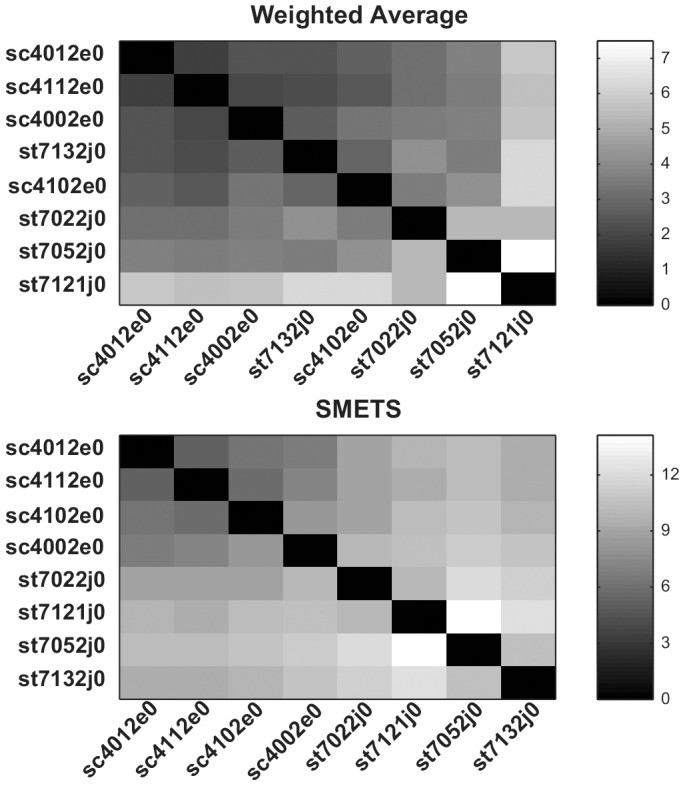
In many situations it is desirable to compare dynamical systems based on their behavior. Similarity of behavior often implies similarity of internal mechanisms or dependency on common extrinsic factors. While there are widely used methods for comparing univariate time series, most dynamical systems are characterized by multivariate time series. Yet, comparison of multivariate time series has been limited to cases where they share a common dimensionality. A semi-metric is a distance function that has the properties of non-negativity, symmetry and reflexivity, but not sub-additivity. Here we develop a semi-metric--SMETS--that can be used for comparing groups of time series that may have different dimensions. To demonstrate its utility, the method is applied to dynamic models of biochemical networks and to portfolios of shares. The former is an example of a case where the dependencies between system variables are known, while in the latter the system is treated (and behaves) as a black box.


Conflict of interest statement

Competing Interests: The authors have declared that no competing interests exist.

Figures

Figure 1
Figure 1. Three dynamic models with different dimensionality.
A model with 4 variables, B model with 2 variables and C model with 3 variables. A has similarities with both B and C, however the distance between B and C is large. The question that SMETS addresses is which of B and C is closest to A?
Figure 2
Figure 2. Three similar models.
Models A, B and C are very similar; all three models contain an oscillating variable which behaves exactly the same and a different number of variables that are constant (zero entropy). Because SMETS also takes into account the difference of dimensions it can distinguish between these models: the distance A–B is the smallest (0.25), followed by the distance B–C (0.33) and then the distance A–C (0.54).
Figure 3
Figure 3. Hierarchical clustering of five stock indices.
Indices were clustered based on the traditional weighted average method and on SMETS. The dendrogram reveals the relative distances between each entity. The time series considered by each method are represented to the left.
Figure 4
Figure 4. Distance matrices for the five stock indices.
Distance values were measured using the weighted average and SMETS and are encoded in grayscale.
Figure 5
Figure 5. Hierarchical clustering of eight systems biology models.
Models were obtained from the BioModels database using average versus SMETS. The dendrogram reveals the relative distances between each entity. The time series considered by each method are represented to the left.
Figure 6
Figure 6. Distance matrices for the systems biology models.
Distance values were measured using the average and SMETS distances and are encoded in grayscale.
Figure 7
Figure 7. Hierarchical clustering of primary commodity prices.
Distances were measured using the weighted average method versus SMETS. The dendrogram reveals the relative distances between each entity. The time series considered by each method are represented to the left.
Figure 8
Figure 8. Distance matrices for the primary commodity prices.
Distance values were measured using the average and SMETS distances and are encoded in grayscale.
Figure 9
Figure 9. Hierarchical clustering of unmodified electrophysiological sleep data.
Distances were measured using the weighted average method versus SMETS. The dendrogram reveals the relative distances between each entity. The time series considered by each method are represented to the left. Note that series sc4102e0, st7022j0 st7121j0 contain only 5 dimensions, while the other four contain 7 dimensions (see Results section for details).
Figure 10
Figure 10. Hierarchical clustering of modified electrophysiological sleep data.
Distances were measured using the weighted average method versus SMETS. The dendrogram reveals the relative distances between each entity. The time series considered by each method are represented to the left. All time series have only 5 dimensions, by removing the two extra dimensions from series sc4012e0, sc4112e0, sc4102e0 and sc4002e0 (see Results section for details).
Figure 11
Figure 11. Distance matrices unmodified electrophysiological sleep data.
Distance values were measured using the average and SMETS distances and are encoded in grayscale.
Figure 12
Figure 12. Distance matrices modified electrophysiological sleep data.
Distance values were measured using the average and SMETS distances and are encoded in grayscale. Here all time series contain 5 dimensions (see Results section for details).

References

    1. Shumway RH, Stoffer DS (2000) Time series analysis and its applications. New York: Springer Verlag.
    1. Wei L, Keogh E (2006) Semi-supervised time series classification. In Proceedings of the 12th ACM SIGKDD International Conference on Knowledge Discovery and Data Mining (KDD ‘06). New York, NY:ACM. 748–753.
    1. Alon J, Sclaroff S, Kollios G, Pavlovic V (2003) Discovering clusters in motion time-series data. In Proceedings of IEEE Computer Society Conference on Computer Vision and Pattern Recognition. vol.1 I375–I381.
    1. Warren Liao T (2005) Clustering of time series data: a survey. Pattern Recognition 38: 1857–1874.
    1. Chin SC, Ray A, Rajagopalan V (2005) Symbolic time series analysis for anomaly detection: a comparative evaluation. Signal Proc 85: 1859–1868.

Publication types

LinkOut - more resources