

Review
doi: 10.1021/cr3004295.
Epub 2013 Feb 11.
Analysis of tissue specimens by matrix-assisted laser desorption/ionization imaging mass spectrometry in biological and clinical research
Affiliations
- PMID: 23394164
- PMCID: PMC3624074
- DOI: 10.1021/cr3004295
Item in Clipboard
Review
Analysis of tissue specimens by matrix-assisted laser desorption/ionization imaging mass spectrometry in biological and clinical research
Chem Rev.
.
No abstract available
Figures
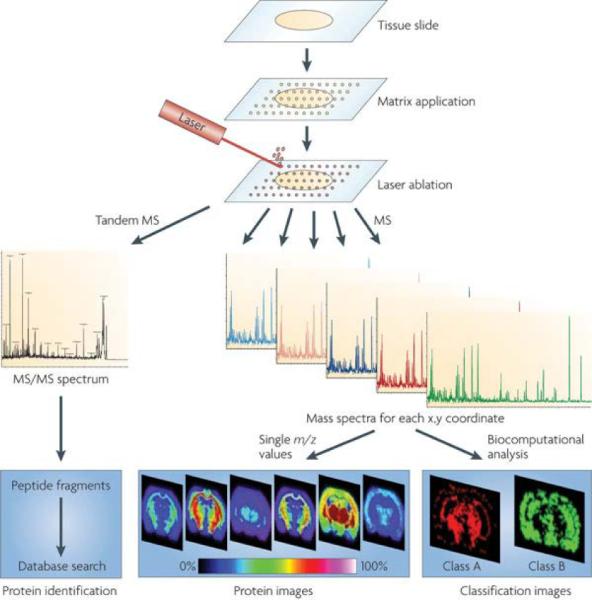
Schematic of a typical workflow for fresh frozen tissue samples. Sample pretreatment steps include cutting and mounting the tissue section on a conductive target. Matrix is applied to the tissue section and mass spectra are generated at each x,y coordinate for protein analysis or tandem MS spectra for protein identification. Further analytical steps include the visualization of the distribution of a single molecule within the tissue (image) or statistical analysis to visualize classification images as well as database searching to identify the protein. Reprinted with permission from Reference 21. Copyright 2010 Macmillan Publishers Limited.
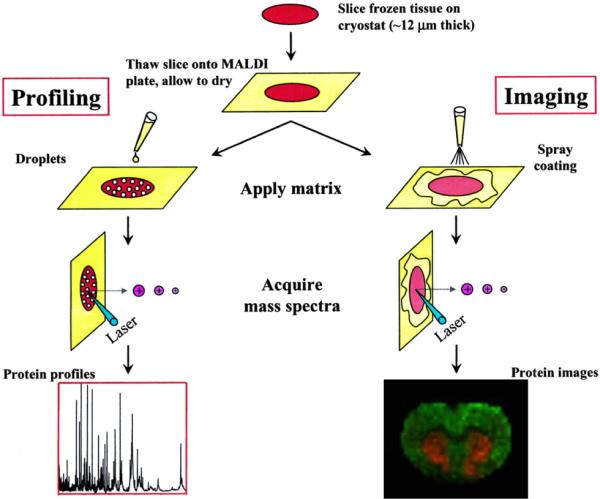
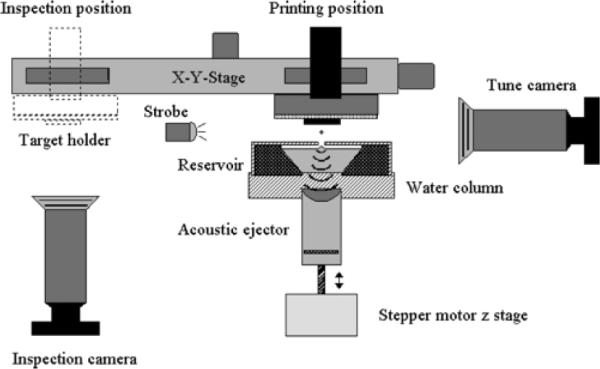
The schematic represents the two most common data acquisition strategies of MALDI MS used for the analysis of clinical specimens. In a profiling mode, data are collected from regions of interest defined by tissue pathology, while in imaging mode, the entire sample surface is raster sampled to reproduce an image of the specimen based ion specific ion intensities. Reprinted with permission from Reference 243. Copyright 2004 American Chemical Society.
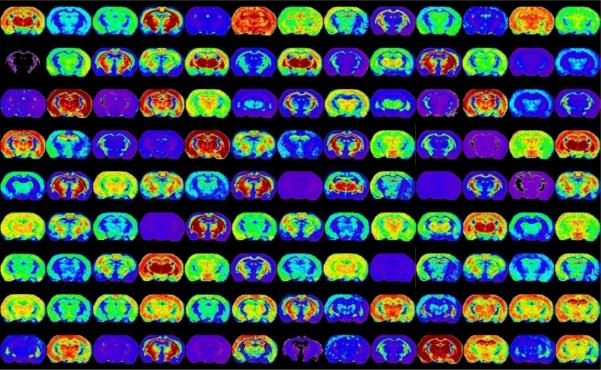
Ion images displayed above originate from a single raster of one section of a mouse brain section. Each image represents a single m/z ion that has a unique distribution in the brain. This figure represents less than 10% of the images collected.
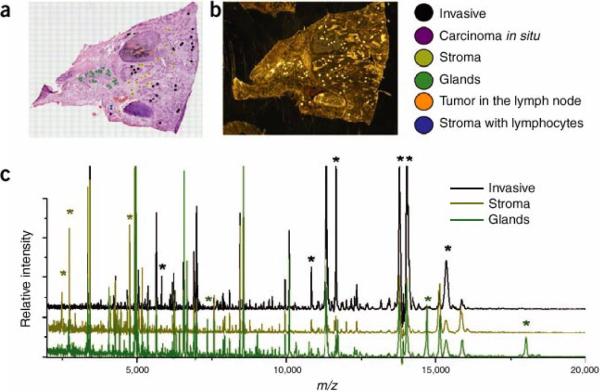
Two adjacent sections of the sample tissue are required, one for staining and one for MALDI analysis. (a) A pathologist selects cells of interest using the histology image. (As shown here, the cells are colored according to type.) (b) The locations of the selected cells are registered to the matrix spotter that holds the section for MALDI analysis. After spotting with matrix, the coordinates of the matrix spots are registered to the mass spectrometer and spectra are automatically acquired from each location. (c) Spectra demonstrating the cell-specific differences (peaks marked with asterisks) that can be detected. Reproduced with permission from Reference 14. Copyright 2007 Nature Publishing Group.

In order to ensure that high quality MALDI IMS data is generated, sample custody is ideally controlled as much as possible through the entire experiment to avoid problems with tissue degradation and contamination. Common considerations for each sample preparation step are listed under each category.
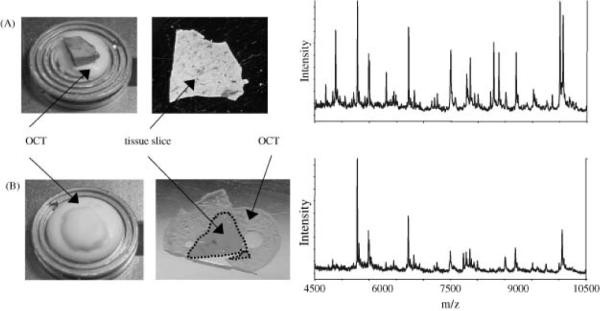
(A) Optimal procedure where OCT is used to adhere the tissue to the sample stage but does not come into contact with the sliced tissue. The resulting spectrum shows many intense signals between m/z 4500 and 10 500. (B) The tissue was embedded in OCT and attached to the sample stage. The resulting tissue slice is surrounded by OCT on the MALDI plate, and the resulting spectrum contains only about half of the signals as that in (A). Reproduced with permission from Reference 45. Copyright 2003 John Wiley & Sons, Ltd.
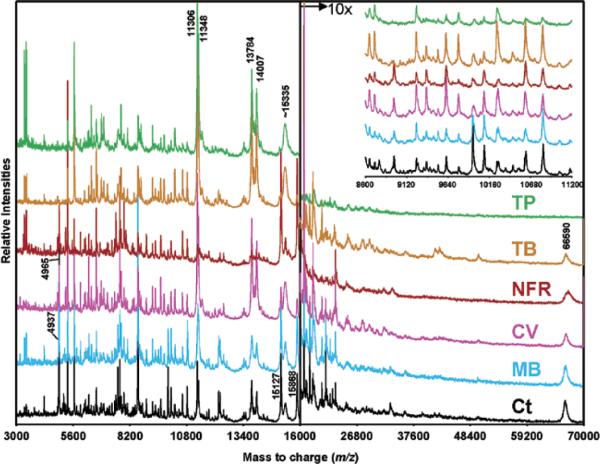
MALDI-MS protein profiles acquired from unstained (Ct: control section rinsed in 70 and 100% ethanol) and stained grade 4 human glioma tissue sections. TP, Terry's Polychrome; TB, Toluidine Blue; NFR, Nuclear Fast Red; CV, Cresyl Violet; MB, Methylene Blue. Reprinted with permission from Reference 61. Copyright 2004 American Chemical Society.
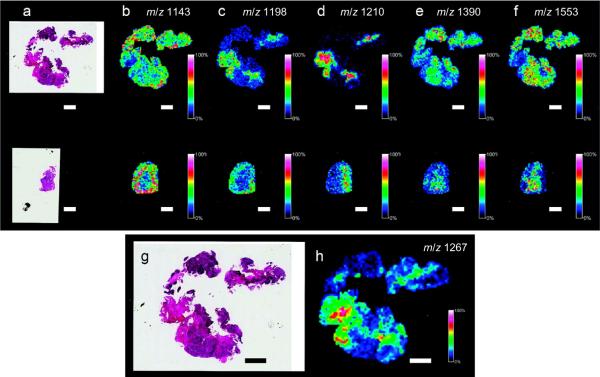
Ion intensity maps generated for peptides observed on citric acid antigen retrieval (CAAR)-treated FFPE tissue. An archived FFPE section of human ovarian cancer (a–f, top row) was mounted onto a slide and treated with CAAR. A fresh-frozen section of ovarian cancer tissue (a–f, bottom row) from the same patient was mounted onto a separate slide. H&E stains of the FFPE section and fresh-frozen section (a) are included as well as ion maps (b–f). An (g) enlarged H/E stain and (h) ion intensity map for m/z 1267 are also included. Scale bars = 2 mm. Reprinted with permission from Reference 79. Copyright 2010 American Chemical Society.
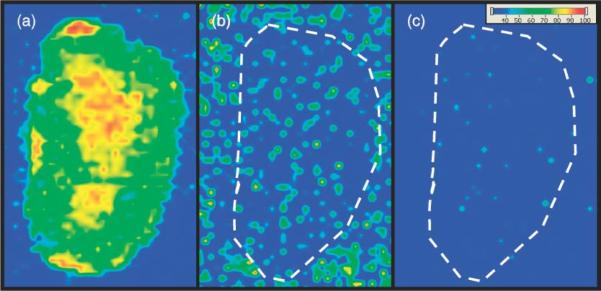
Serial kidney sections from mouse dosed with 3-MoSA at 300 mg/kg and sacrificed at 30 min post-dose. (a) TCDI-treated tissue, plotting m/z 196 → 137 for 3-MoSA-TCDI. (b) Tissue not treated with TCDI, plotting 154 → 137 (underivatized 3-MoSA). (c) Tissue not treated with TCDI, plotting 196 → 137. Images are plotted as m/z 137 TIC. Reproduced with permission from Reference 84. Copyright 2011 John Wiley & Sons, Ltd.
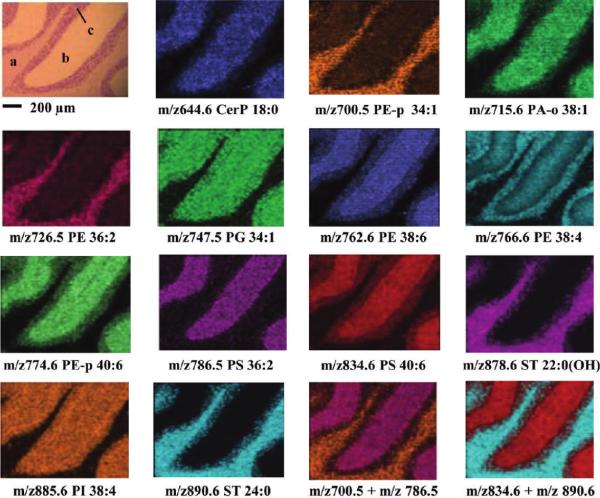
IMS of lipids in the negative ionization mode from a transversal mouse cerebellum region coated with DAN by sublimation and acquired with a lateral resolution of 10 μm. In the H&E staining, a, b, and c represent white matter and the molecular and granular layers, respectively. Reprinted with permission from Reference 104. Copyright 2012 American Chemical Society.
Reprinted with permission from Reference 69. Copyright 2006 American Chemical Society.
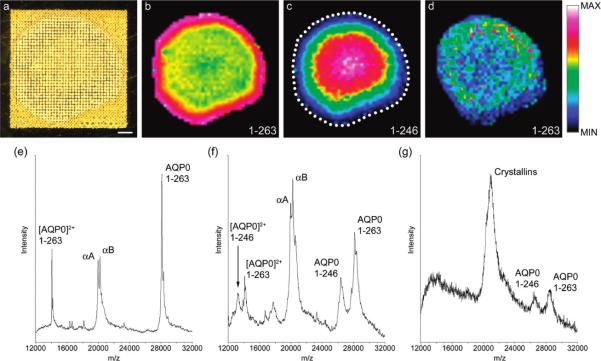
(a) Optical scan of an equatorial section from an 11 year-old human lens prepared for integral membrane protein imaging with high-density matrix microdroplet array applied at 200 μm spot spacing. (b) Signal for full-length AQP0 (1–263) (plotted m/z 28 129) is most intense around the edge of the lens, and persists in the lens core. (c) The major truncation product in the human lens AQP0 (1–246) (plotted m/z 26 378) increases in intensity in the core of the lens. (d) Signal for full-length AQP0 (1–263) in unwashed tissue sections, indicating the importance of the washing step. (e) Extracted spectrum from the lens periphery showing singly- and doubly charged AQP0 signals and signals for the abundant soluble proteins αA- and αB-Crystallin. (f) Extracted spectrum from the lens core, showing singly- and doubly charged full-length AQP0 and AQP0 (1–246). Signals for Crystallin proteins are also abundant. (g) Extracted spectrum from the lens cortex of unwashed tissue, showing noisy, poorly resolved mass spectral signals for AQP0 1–263 and 1–246, and abundant Crystallin signal. Scale bar = 1 mm. The dotted line indicates the edge of the tissue. Reprinted with permission from Reference 72. Copyright 2009 American Chemical Society.
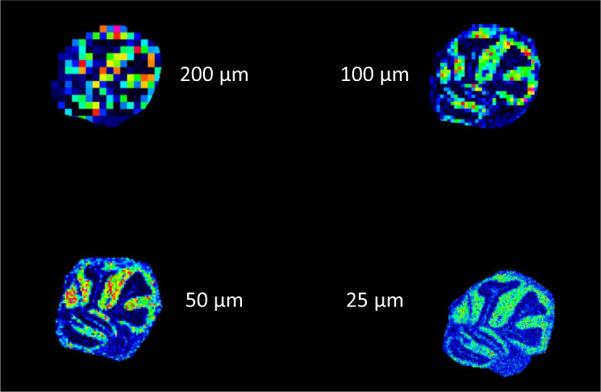
Ion images (m/z 6765) of mouse cerebellum imaged by MALDI IMS at spatial resolutions of 200, 100, 50, and 25 μm.
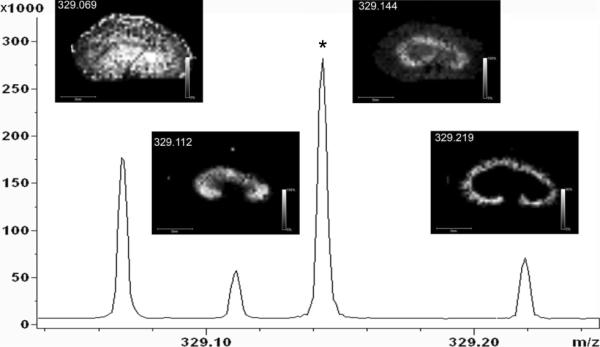
FTICR images of the drug metabolite, 2-hydroxymethyl olanzapine ([M+H]+ = 329.1431) shows distinct localization when compared to three nominally isobaric ions. The asterisk indicates the peak corresponding to the drug metabolite. Reprinted with permission from Reference 128. Copyright 2008 American Chemical Society.
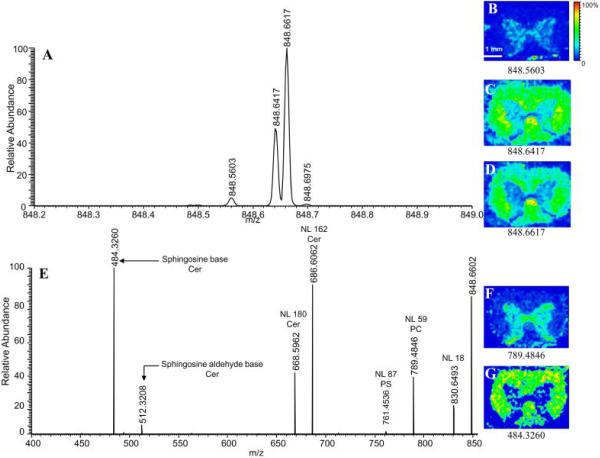
(A) Mass spectrum of m/z region 848–849 acquired on an Orbitrap analyzer. Mass spectrometric images B–D correspond to major ions detected in A. Fragmentation of nominal m/z 848 in the linear ion trap produces the MS/MS spectrum seen in E. Images observed in F and G corresponds to the two major isobars found at 848. Matching images produced by the full scan and MS/MS spectra and exact mass calculations identify the ions in the full scan mass spectrum as: 848.5603 [PC(18:0,20:4)+K]+; 848.6417 [Cer(d18:1,24:1)+K]+; 848.6617 [Cer(d18:1,24:1h)+Na]+; 848.6975 [Cer(d18:1,25:0)+Na]+. NL: neutral loss; PC: phosphatidylcholine; PS: phosphatidylserine; Cer: cerebroside. Reprinted with permission from Reference 134. Copyright 2009 American Chemical Society.
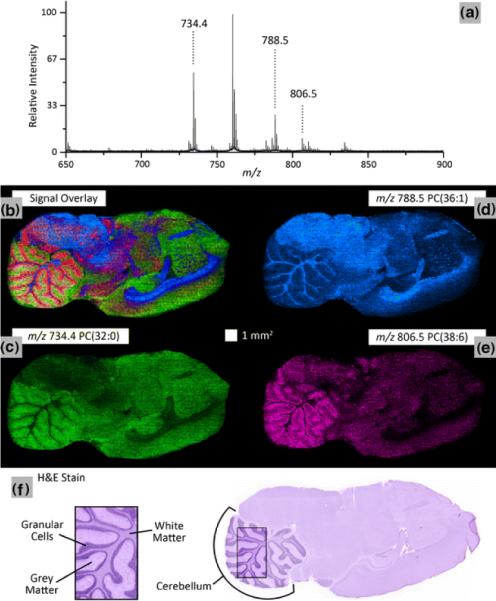
A 100 μm spatial resolution lipid ion image of a sagittal rat brain tissue section using continuous laser raster sampling acquired in 10 min. (a) Representative spectrum is shown. The ion image overlay (b) of signal from m/z 734.4 PC(32:0) (c), m/z788.5 PC(36:1) (d), and m/z 806.5 PC(38:6) (e) highlights the differentiation of the spatial distributions for the selected ions. These results correlate to the H and E stained serial tissue section highlighting structural difference between grey matter, white matter and granular cells in the cerebellum (f). Important instrumental parameters: 3 kHz laser repetition rate, 5 mm/s sample stage velocity, and 60 laser shots/spectrum hardware average. Reprinted with permission from Reference 30. Copyright 2011 Springer.
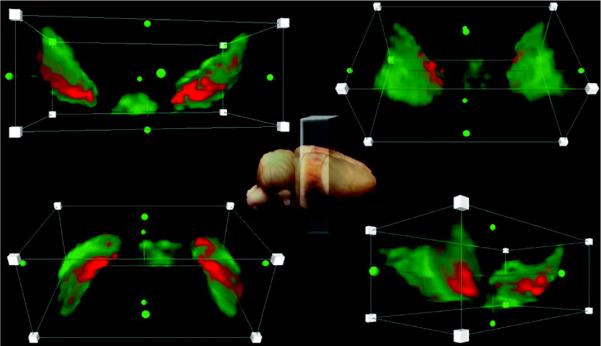
Four different views of the 3D construction of the substantia nigra and interperduncular nucleus. PEP-19 is shown in green, and a protein with m/z 7416 is shown in red. The brightest colors correspond to highest intensity. Reprinted with permission from Reference 169. Copyright 2012 American Chemical Society.
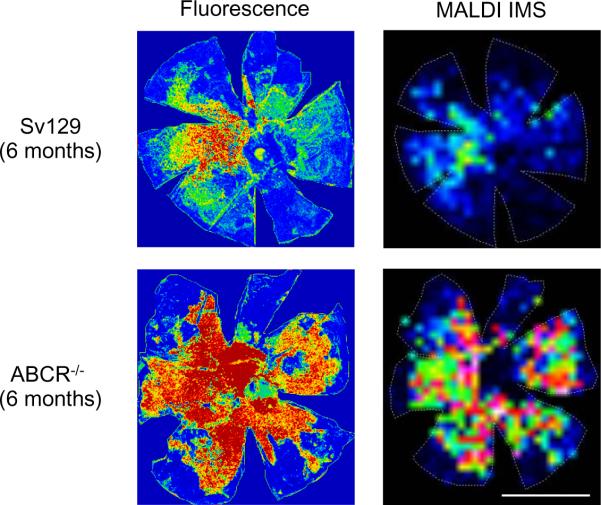
RPE tissue images from 6-month-old Sv129 and Abca4−/− mice. Left panels: fluorescence intensity images; right panels: MALDI images of A2E in the same tissue. Fluorescence images were acquired as micrographs (λexc = 488 nm, λem = 565–725 nm, 10× objective, NA = 0.3) of individual fields and joined by overlapping areas. Images are shown at the same intensity scaling. The MALDI images were acquired after the tissue was spotted with MALDI matrix at 150 m resolution. The pixel intensity is proportional to A2E quantity, with the scale normalized to total ion current. All images are oriented as follows: dorsal (top); ventral (bottom); nasal (left, Sv129; right, Abca4−/−); temporal (right, Sv129; left, Abca4−/−). Scale bar, 1 mm.
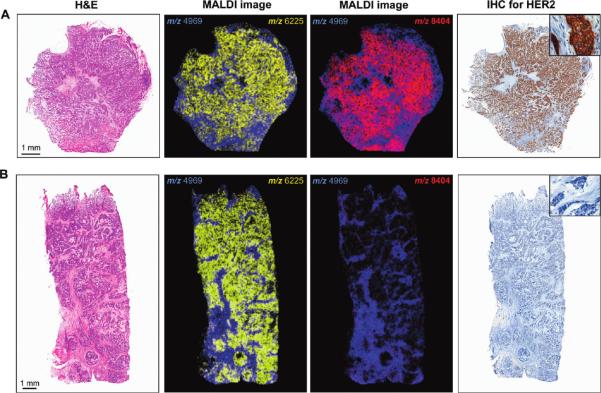
m/z 8404 (shown in red) is up-regulated in HER2-positive breast cancer tissues: optical microscopic images of the MALDI-IMS measured and subsequently H&E stained original tissue sections of a HER2-positive (A) and a HER2-negative (B) case. Immunohistochemistry for HER2 of the respective case on a consecutive serial section is shown on the very right side. Note the strong immunoreactivity (score 3+) of the positive case (A), while the reaction in the negative case indicates a score 0 (B). The visualization of m/z 8404 by MALDI-IMS (shown in red) shows up-regulation in HER2-positive tissues (A) and clearly shows that this spectral feature is specific for cancer cells in this HER2-positive case but absent in cancer cells of the HER2-negative case (B). The spectral feature of m/z 6225 (shown in yellow) is an example specific for cancer cells but not distinguishing between HER2-positive and HER2-negative tissues and is therefore present in both cases (A and B); m/z 4969 (shown in blue) is a m/z species specific for tumor stroma and thus also present in both cases (A and B). Scale bars ) 1 mm. Reprinted with permission from Reference 199. Copyright 2010 American Chemical Society.
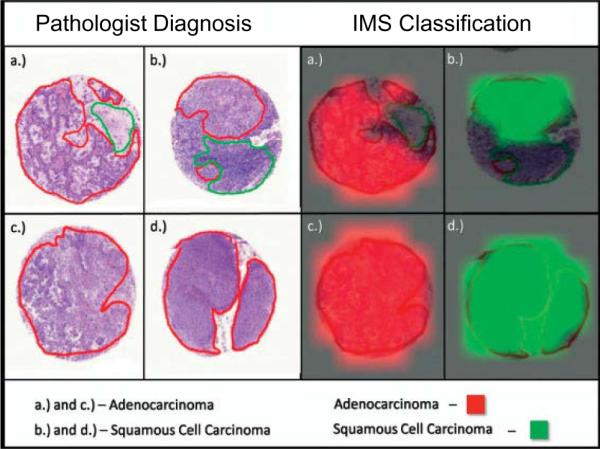
Visual representation of the statistical classification of four biopsies compared to the marking and diagnosis based on histology. Cancerous regions are outlined in red in the histological sections, whereas normal tissue is outlined in green. Reprinted with permission from Reference 38. Copyright 2008 WILEY-VCH Verlag GmbH & Co. KGaA, Weinheim.
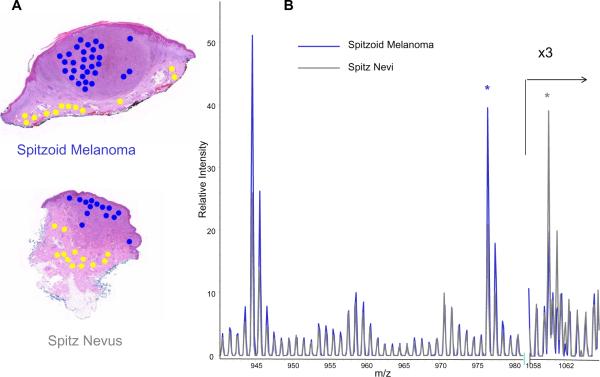
A) Spitzoid melanoma (Top) and Spitz nevi (Bottom) were annotated for areas of tumor (blue) and dermis (yellow) and targeted for on-tissue tryptic digestion and mass spectrometry. B) Average spectra from tumor regions from Spitzoid melanoma (red) and Spitz nevi (green). Two of the 5 peptides that are part of the classifier are marked with an asterisk. Adapted from Reference 33.
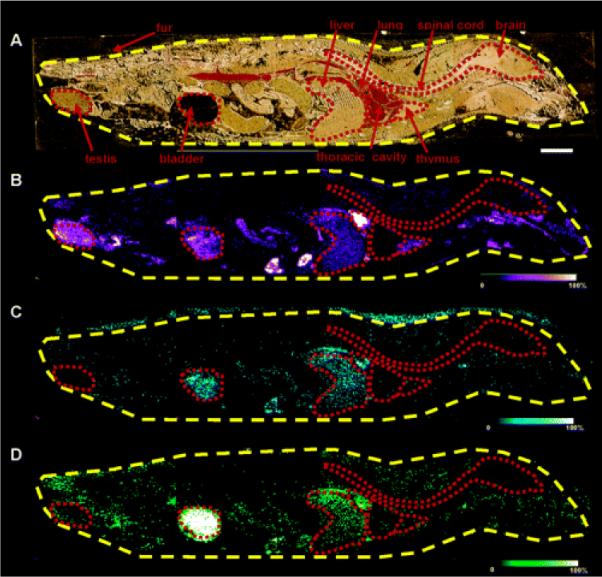
Optical image of a 6 h post OLZ dosed rat tissue section across four gold MALDI target plates (A). Organs outlined in red. MS/MS ion image of OLZ (m/z 256) (B). MS/MS ion image of N-desmethyl metabolite (m/z 256) (C). MS/MS ion image of 2-hydroxymethyl metabolite (m/z 272) (D). Bar, 1 cm. Reprinted with permission from Reference 56. Copyright 2006 American Chemical Society.
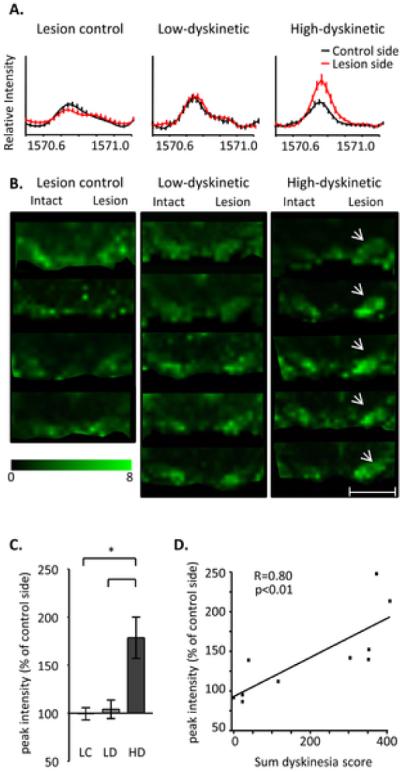
(A) Average MS traces show a higher dynorphin B peak in high dyskinetic (HD) group (average MS ± SEM, n = 5 and 5 in low dyskinetic (LD) and HD group, respectively). (B) MALDI IMS of DynB ion images of animals from control (n = 4), LD (n = 5) and HD (n = 5) group. The HD group display clearly elevated DynB in both high medial and lateral substatia nigra (SN) (arrows). (C) The increase in DynB peak intensity was most pronounced in the lateral tier of SN. Values are expressed as mean % peak area of intact SN ± SEM (p<0.01 HD vs. LD, HD vs. control). (D) Correlation of Dyn B peak intensities and the cumulative dyskinesia score. Scale bar = 2 mm. Reprinted with permission from Reference 75. Copyright 2011 Ljungdahl et al.
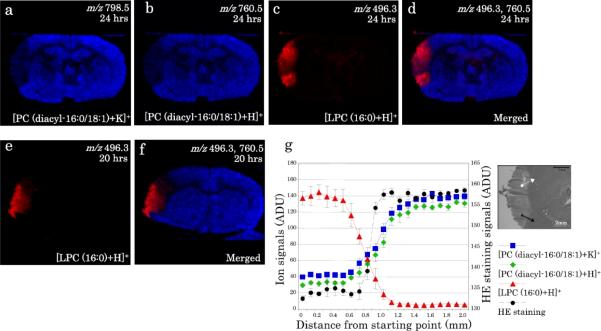
Distributions of PC (16:0/18:1) and LPC (16:0) in the ischemic brain. (a–d) Distributions of [PC (16:0/18:1)+K]+ (a), [PC (16:0/18:1)+H]+ (b) and [LPC (16:0)+H]+ (c) in the ischemic brain at 24 h after injury as well as a merged image (d) are presented. In (d), ion signals of [PC (16:0/18:1)+H]+ and [LPC (16:0)+H]+ are indicated by blue and red, respectively. (e, f) Distributions of [LPC (16:0)+H]+ (e) in the ischemic brain at 20 h after injury as well as a merged image (f) are presented. In (f), ion signals of [PC (16:0/18:1)+H]+ and [LPC (16:0)+H]+ are indicated by blue and red, respectively. (g) The intensities of each ion were plotted across the border from the ischemic area to the normal area, as indicated. The inset indicates the measured area on the adjacent section stained by H&E. To indicate the border of the injured area, the H&E staining signals at the corresponding position were also quantified and plotted on the graph. Data were corrected from five adjacent zones and the normalized intensities are presented as means ± 1 SD. Reprinted with permission from Reference 239. Copyright 2010 IBRO. Published by Elsevier, Ltd.
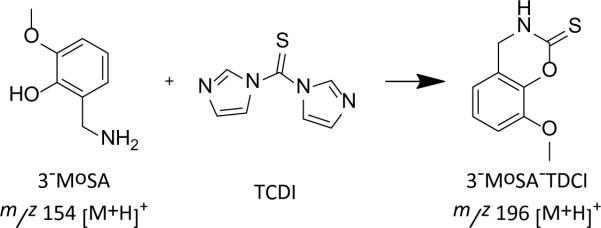
On-tissue chemical derivatization of 3-methoxysalicylamine for MALDI-imaging mass spectrometry. Reaction of 3-MoSA with TCDI.
References
-
- Goodwin RJA, Iverson SL, Andren PE. Rapid Commun. Mass Spectrom. 2012;26:494. - PubMed
-
- Kreye F, Hamm G, Karrout Y, Legouffe R, Bonnel D, Siepmann F, Siepmann J. J Control Release. 2012 - PubMed
-
- Schoenheimer R, Rittenberg D. Science. 1935;82:156. - PubMed
-
- Schoenheimer R. The Dynamic State of Body Constituents. Harvard University Press; Cambridge, MA: 1942.
-
- Schoenheimer R, Rittenberg D. Physiol. Rev. 1940;20:218.
Publication types
MeSH terms
Substances
Grants and funding
LinkOut - more resources
Full Text Sources
Other Literature Sources
Medical
