. 2013 Feb 8:13:73.
doi: 10.1186/1471-2407-13-73.

Multicellular tumor spheroid models to explore cell cycle checkpoints in 3D

Affiliations

Multicellular tumor spheroid models to explore cell cycle checkpoints in 3D

Jennifer Laurent et al. BMC Cancer. .

Abstract

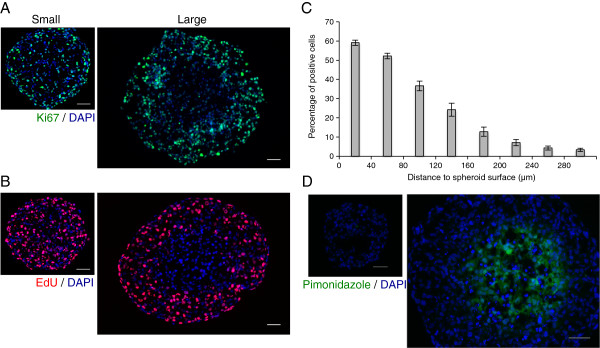
Background: MultiCellular Tumor Spheroid (MCTS) mimics the organization of a tumor and is considered as an invaluable model to study cancer cell biology and to evaluate new antiproliferative drugs. Here we report how the characteristics of MCTS in association with new technological developments can be used to explore the regionalization and the activation of cell cycle checkpoints in 3D.

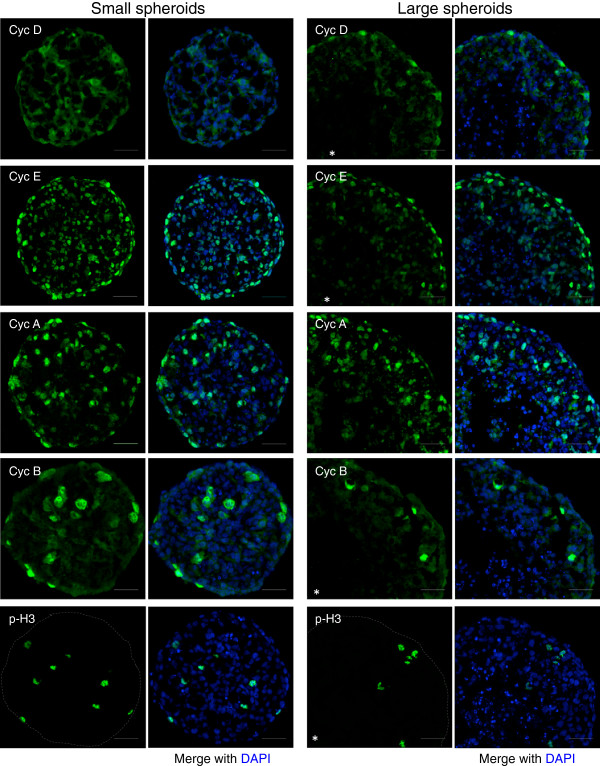
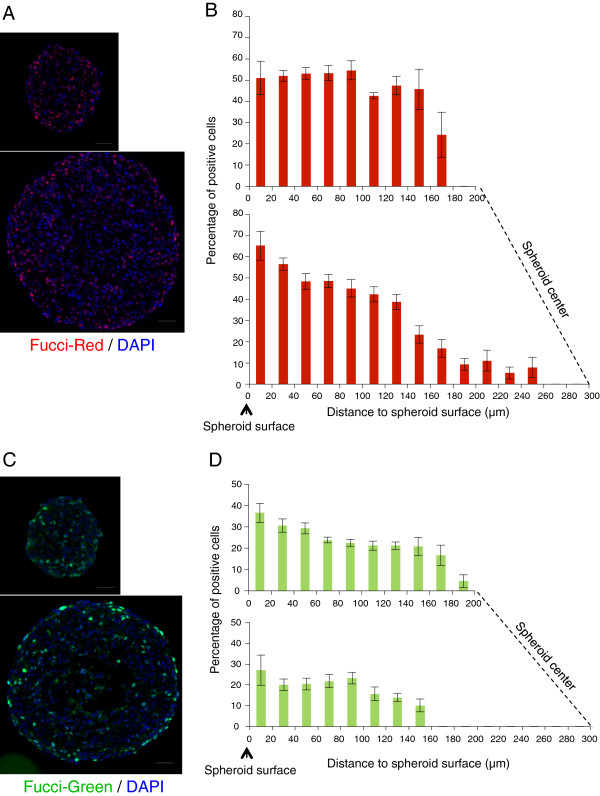
Methods: Cell cycle and proliferation parameters were investigated in Capan-2 spheroids by immunofluorescence staining, EdU incorporation and using cells engineered to express Fucci-red and -green reporters.

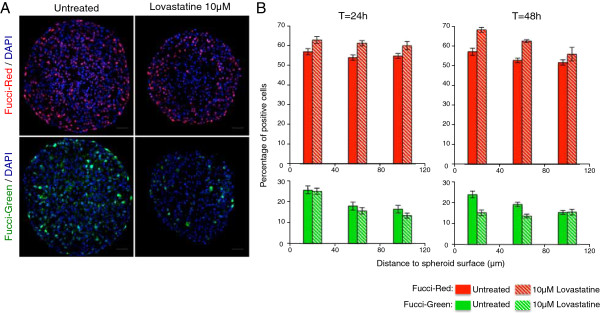
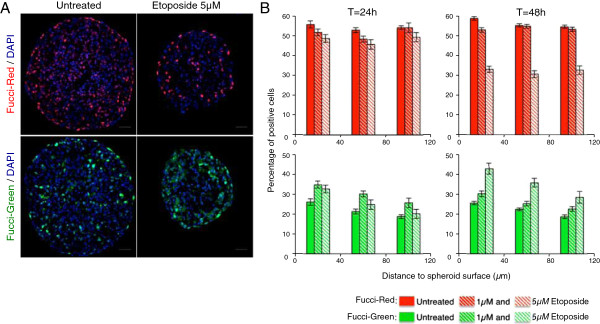
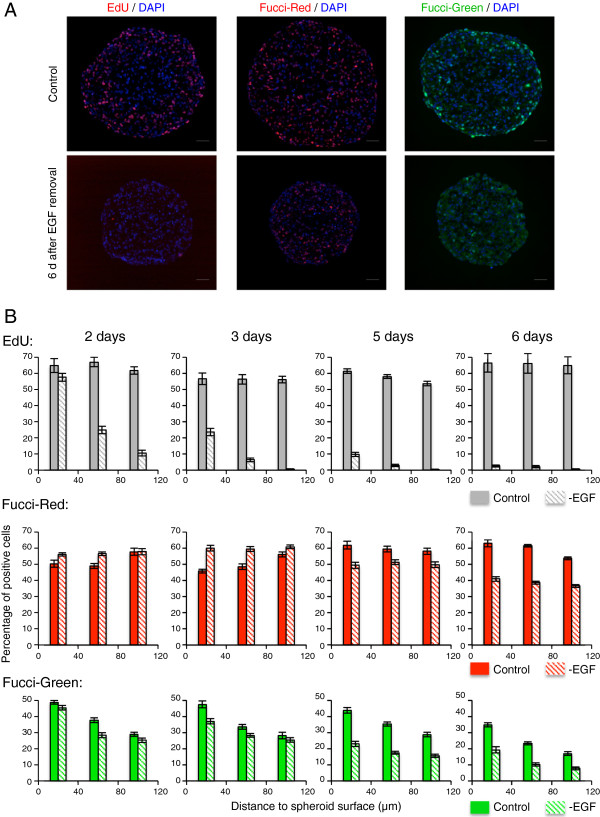
Results: We describe in details the changes in proliferation and cell cycle parameters during spheroid growth and regionalization. We report the kinetics and regionalized aspects of cell cycle arrest in response to checkpoint activation induced by EGF starvation, lovastatin treatment and etoposide-induced DNA damage.

Conclusion: Our data present the power and the limitation of spheroids made of genetically modified cells to explore cell cycle checkpoints. This study paves the way for the investigation of molecular aspects and dynamic studies of the response to novel antiproliferative agents in 3D models.


Figures

Figure 1
Figure 1
Proliferation gradient characterization during Capan-2 multicellular tumor spheroids growth. (A) Immunodetection of proliferative cells (Ki-67, green) on a frozen section of a small Capan-2 spheroid (300 μm in diameter, left) or a large Capan-2 spheroid (500 μm in diameter, right). Nuclei are stained with DAPI (blue). Scale bar: 50 μm. (B) Visualization of proliferative cells after 24 h of EdU incorporation (red) on a frozen section of a small Capan-2 spheroid or a large spheroid. Nuclei are stained with DAPI (blue). Scale bar: 50 μm. (C) Graphic representation of the percentage of proliferative cells after 24 h of EdU incorporation related to the distance to spheroid surface within Capan-2 MCTS measuring 500 μm +/− 20 μm in diameter. Data correspond to the mean +/− SEM of percentage of EdU positive cells from 10 sections similar to the one shown in (B) from 4 different spheroids. (D) Visualization of the hypoxia by pimonidazole detection (green) on frozen sections from a small spheroid or a large spheroid. Nuclei are stained using DAPI (blue). Scale bar: 50 μm.
Figure 2
Figure 2
Expression of cell cycle regulators in small and large Capan-2 spheroids. Immunofluorescence staining with the indicated antibodies and DAPI performed on small (left column) and large (right column) Capan-2 spheroids Scale bar: 50 μm. The star indicates approximately the center of large spheroids.
Figure 3
Figure 3
Cell cycle distribution in Capan-2 spheroids expressing the Fucci-Red or -Green reporters. (A, C): Visualization of the G1 and S-G2 cells on a frozen section of a large Capan-2 spheroid expressing the Fucci-red and Fucci-green reporters respectively. Nuclei are stained with DAPI (blue). Scale bar: 50 μm. (B, D): Graphic representations of the percentage of cells expressing the Fucci-red or Fucci-green reporters related to the distance to spheroid surface within Capan-2 MCTS measuring 340 μm +/− 20 μm (top) or 580 μm +/− 20 μm (bottom) in diameter. The relative position of the spheroid center is indicated. Data correspond to the mean+/−SEM of percentage of positive cells on 7-10 sections from 3-4 different spheroids.
Figure 4
Figure 4
Lovastatin-induced cell cycle arrest in G1. (A): Capan-2 spheroids treated or not with 10 μM lovastatin for 48 h. Visualization of Fucci-red and Fucci-green expressing cells. Nuclei are stained with DAPI (blue). Scale bar: 50 μm. (B) Capan-2 spheroids treated or not with 10 μM lovastatin for 24 or 48 h. Quantification of the percentage of Fucci-red and Fucci-green expressing cells as a function of the distance to the spheroid surface.
Figure 5
Figure 5
G2/M checkpoint activation in MCTS treated with etoposide. (A): Capan-2 spheroids treated or not with 5 μM etoposide for 48 h. Visualization of Fucci-red and Fucci-green expressing cells. Nuclei are stained with DAPI (blue). Scale bar: 50 μm. (B) Capan-2 spheroids treated or not with 1 μM or 5 μM etoposide for 24 or 48 h. Quantification of the percentage of Fucci-red and Fucci-green expressing cells as function of the distance to the spheroid surface. For each condition, data correspond to the mean+/−SEM of percentage of positive cells on 10-30 sections from 2 or 3 independent experiments with 5 to 10 different spheroids each.
Figure 6
Figure 6
Cell cycle arrest in G1 and G2 in response to EGF removal. (A): Capan-2 spheroids control or 6 days after EGF removal. Visualization of EdU incorporation (left), Fucci-red (middle) and Fucci-green (right) expressing cells. Nuclei are stained with DAPI (blue). EdU has been incorporated for 24 h. Scale bar: 50 μm. (B) Quantification of the percentage of EdU (top), Fucci-red (middle) and Fucci-green (bottom) expressing cells as a function of the distance to the spheroid surface. 0-40 μm, 40-80 μm and 80-120 μm intervals are considered. For each condition, data correspond to the mean+/−SEM of percentage of positive cells on 10-30 sections from 2 or 3 independent experiments with 5 to 10 different spheroids each.

References

    1. Dubessy C, Merlin JM, Marchal C, Guillemin F. Spheroids in radiobiology and photodynamic therapy. Crit Rev Oncol Hematol. 2000;36(2-3):179–192. doi: 10.1016/S1040-8428(00)00085-8. - DOI - PubMed
    1. Sutherland RM. Cell and environment interactions in tumor microregions: the multicell spheroid model. Science. 1988;240(4849):177–184. doi: 10.1126/science.2451290. - DOI - PubMed
    1. Friedrich J, Ebner R, Kunz-Schughart LA. Experimental anti-tumor therapy in 3-D: spheroids-old hat or new challenge? Int J Radiat Biol. 2007;83(11-12):849–871. doi: 10.1080/09553000701727531. - DOI - PubMed
    1. Hirschhaeuser F, Menne H, Dittfeld C, West J, Mueller-Klieser W, Kunz-Schughart LA. Multicellular tumor spheroids: an underestimated tool is catching up again. J Biotechnol. 2010;148(1):3–15. doi: 10.1016/j.jbiotec.2010.01.012. - DOI - PubMed
    1. Desoize B, Jardillier J. Multicellular resistance: a paradigm for clinical resistance? Crit Rev Oncol Hematol. 2000;36(2-3):193–207. doi: 10.1016/S1040-8428(00)00086-X. - DOI - PubMed

Publication types

MeSH terms