. 2013 Feb 5;17(2):261-70.
doi: 10.1016/j.cmet.2013.01.005.

HRG1 is essential for heme transport from the phagolysosome of macrophages during erythrophagocytosis

Affiliations

HRG1 is essential for heme transport from the phagolysosome of macrophages during erythrophagocytosis

Carine White et al. Cell Metab. .

Abstract

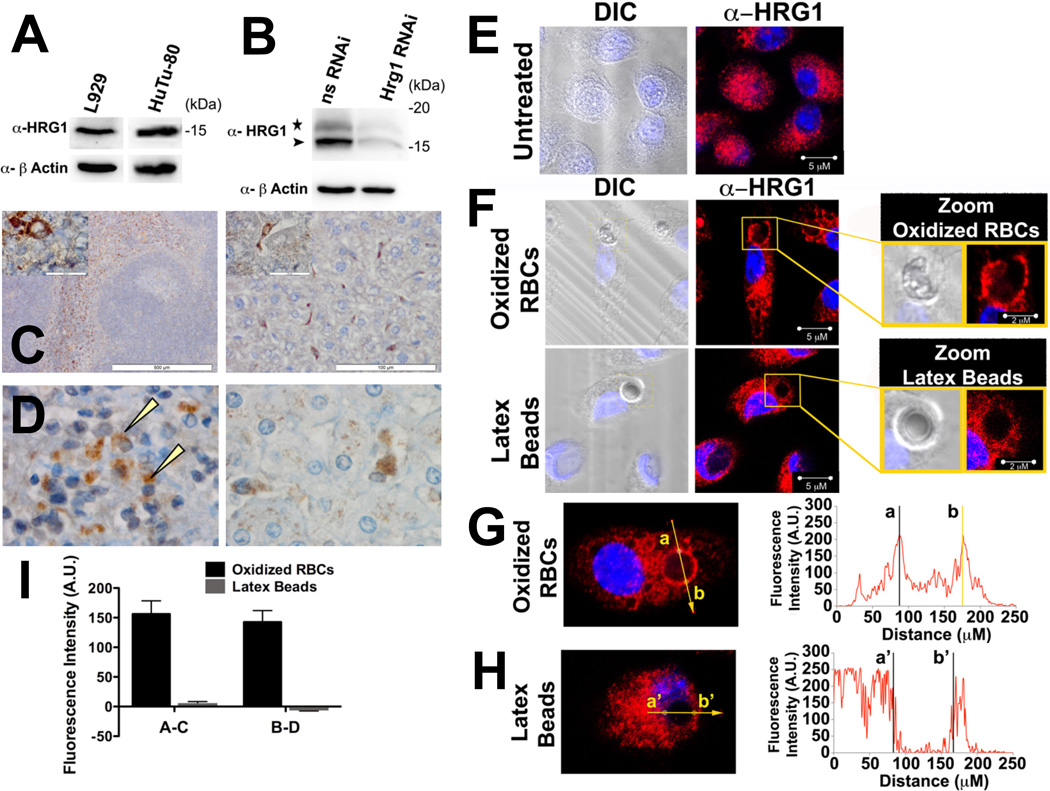
Adult humans have about 25 trillion red blood cells (RBCs), and each second we recycle about 5 million RBCs by erythrophagocytosis (EP) in macrophages of the reticuloendothelial system. Despite the central role for EP in mammalian iron metabolism, the molecules and pathways responsible for heme trafficking during EP remain unknown. Here, we show that the mammalian homolog of HRG1, a transmembrane heme permease in C. elegans, is essential for macrophage iron homeostasis and transports heme from the phagolysosome to the cytoplasm during EP. HRG1 is strongly expressed in macrophages of the reticuloendothelial system and specifically localizes to the phagolysosomal membranes during EP. Depletion of Hrg1 in mouse macrophages causes attenuation of heme transport from the phagolysosomal compartment. Importantly, missense polymorphisms in human HRG1 are defective in heme transport. Our results reveal HRG1 as the long-sought heme transporter for heme-iron recycling in macrophages and suggest that genetic variations in HRG1 could be modifiers of human iron metabolism.


Figures

Figure 1
Figure 1. HRG1 protein is expressed in human and mouse macrophages of the reticuloendothelial system
(A) Immunoblot of HRG1 protein in the mouse fibroblast cell line L929 and the human duodenal cell line HuTu-80. (B) The α-HRG1 antibody detects mouse Hrg1 specifically. Immunoblot of Hrg1 protein in mouse bone marrow-derived macrophages (BMDM) transfected with either non-specific RNAi (nsRNAi) or with mHrg1 RNAi. The arrowhead indicates the predicted 15 kDa Hrg1 band. The star marks a doublet band that is also suppressed by mHrg1 RNAi. For (A) and (B), actin is shown as a loading control. (C,D) Immunohistochemistry of Hrg-1 expression in mouse spleen (C, left panel), mouse liver (C, right panel), human spleen (D, left panel) and human liver (D, right panel). Yellow and black arrowheads indicate HRG1 expresssion in macrophages and hepatocytes, respectively. Hrg1 staining appears as a brown stain on a blue hematoxylin background. Final magnification: (C, left panel) 4X with 100X insert, (C, right) 20X with 100X insert, (D, left) 40X and (D, right) 100X. (E, F) Immunofluorescence imaging of endogenous Hrg1 localization in BMDM that were untreated (E) or fed either oxidized RBCs (F, upper panel) or latex beads (F, lower panel). Hrg1 protein was detected using a rabbit α-HRG1 antibody followed by α-rabbit Alexa-568. Nuclei were stained with DAPI. Right panel shows zoom-in pictures of the phagolysosome of BMDM fed RBCs or latex beads. (G, H) Quantification of the red fluorescence intensity corresponding to Hrg1 protein localization at the phagolysosomal membrane of BMDM fed RBCs (markers a and b in G), or latex beads (markers a’ and b’ in H). (I) Quantification of the peak of fluorescence at the phagolysosomal membrane in BMDM fed either oxidized RBCs or latex beads. For each condition, 10 phagolysosomes were analyzed. The change in fluorescence intensity at the phagolysosomal membrane was assessed by calculating [Fluorescence at membrane (points a and b)– Fluorescence at point 5µm away from membrane (points c and d)]. Quantification was performed using Zeiss Zen software for confocal microscopy. See also Figure S1.
Figure 2
Figure 2. Hrg1 mRNA and protein are regulated by erythrophagocytosis and heme in mouse BMDM
(A) qRT-PCR time course analysis of Hrg1 mRNA levels in BMDM fed either RBCs (EP, ●) or latex beads (○). (B) Immunoblot of Hrg1 protein levels in BMDM 1 hour and 24 hours following feeding with RBCs or latex beads, or in time-matched controls grown in heme-depleted serum media (HD). Ferritin levels are shown as a control for increases in intracellular Fe levels in cells fed RBCs or grown in heme. (C) qRT-PCR analysis of Hrg1 mRNA levels in BMDM fed increasing numbers of RBCs, in the presence or absence of the iron chelator desferrioxamine (DFO, 100 µM). Increasing ratios of RBCs: BMDM were added to pre-cultured BMDM. mRNA levels were assessed 4 hours following EP. D) Immunoblot of Hrg1 expression in BMDMs fed increasing ratios of RBCs: BMDM. Samples were analyzed 24 hrs following EP. (E) Immunoblot of Hrg-1 protein levels in BMDM exposed to 20 µM heme:arginate in the presence or absence of 100 µM DFO. (F) qRT-PCR analysis of Hrg1 mRNA levels in BMDM treated with 100 µM Fe:NTA in the presence or absence of 0.5 mM succinyl acetone (SA). (G) Immunoblot of Hrg-1 protein levels in BMDM exposed to increasing concentrations of ZnPPIX:arginate. (B, D, E & G) Actin is shown as a loading control. For (A, C, and F) Changes in mRNA levels were assessed as fold change compared to control samples from BMDM grown in HD media. Values were normalized to Gapdh mRNA levels (internal control). Error bars represent standard error of the mean (SEM). See also Figure S2.
Figure 3
Figure 3. Hrg1 protein levels are increased in RES macrophages of mice injected with phenylhydrazine, damaged RBCs, or heme, and in the Fechm1Pas mouse
Hrg1 immunohistochemistry on mouse livers was performed 24-hours after treatment with PBS (A, left panel) or phenylhydrazine hydrochloride (PHZ, A right panel); untreated RBCs (B, left panel) or oxidatively damaged RBC (B, right panel), vehicle (C, left panel) or heme (C, right panel). (D) Hrg1 IHC in livers from a wildtype mouse in which Hrg1 is localized primarily in macrophages (D, left panel) or a ferrochelatase deficient (Fechm1Pas) mouse in which it is highly expressed in hepatocytes (D, right panel). Hrg1 staining appears as a brown stain on a blue hematoxylin background. Original magnification: (A–C) 100X, (D) 20X. See also Figure S3.
Figure 4
Figure 4. Hrg-1 mediates heme transport from the phagolysosome during erythrophagocytosis
(A) Immunoblot of Hrg1 protein levels in BMDM transfected with either nsRNAi or Hrg1 RNAi and fed RBCs (EP, 20:1 RBC:BMDM) in the presence or absence of the iron chelator desferrioxamine. Actin is shown as a loading control. The right panel shows quantitation of the intensity of Hrg1 bands relative to nsRNAi HD controls, and normalized to actin controls. (B–D) qRT-PCR of Hrg1 (B), Hmox1 (C) and Fpn1 (D) mRNA levels in BMDM transfected with ns RNAi or Hrg1 RNAi. BMDM were fed RBCs (EP) in the presence or absence of the iron chelator desferrioxamine (DFO, 100 µM). Values represent the fold change relative to HD nsRNAi controls, normalized to Gapdh (2−ΔΔ CT). Samples were harvested 4 hours post EP. Statistical analysis for (C) and (D) for EP and EP + DFO conditions: n=6, nsRNAi vs Hrg1 RNAi p<0.0001. Error bars represent the SEM. Values with different letter labels are significantly different (p <0.05). (E) Immunoblot of ferritin levels in BMDM treated with either ns RNAi or Hrg1 RNAi and fed RBCs (EP, 10:1 RBC:BMDM). Actin is shown as loading control. See Fig. S4D for Hrg1 immunoblot. See also Figure S4.
Figure 5
Figure 5. The P36L polymorphism in human and zebrafish HRG1 results in defective heme transport in yeast, zebrafish, and BMDM
(A) Topology of human HRG1. The arrows indicate the polymorphic positions. (B) The P36L human variant fails to rescue the growth of the hem1Δ(6D) yeast strain under low heme concentrations. hem1Δ(6D) yeast strains stably expressing either pYes-DEST52 vector control, hHRG-1-HA, or hHRG-1 P36L-HA were grown overnight in 2% w/v raffinose SC (-His) medium and spotted in serial dilution on 2% w/v raffinose SC (-His, + 0.4% w/v galactose) plates supplemented with 0.25 µM or 10 µM hemin. (+) positive control: + 0.4% w/v glucose, + 250 µM ALA, (−) negative control:+ 0.4% galactose, - ALA, - hemin. Plates were incubated at 30°C for 3 days before imaging. (C) The P36L polymorph is defective in heme transport in yeast. hem1Δ(6D) yeast strains stably expressing either pYes-DEST52 vector control, hHRG-1-HA, or hHRG-1 P36L-HA were co-transformed with pCYC1-LacZ and grown in 2% w/v raffinose SC (-His, -Trp) medium for 12 h, washed, and grown in 2% w/v raffinose SC (-His, -Trp, + 0.4% w/v galactose) medium supplemented with 1 µM or 2.5 µM hemin. Galactosidase activity (Miller units) was measured in cell lysates. Statistical analysis: n=3, Vector vs hHRG1-HA p<0.0001, Vector vs P36L-HA p>0.05; Error bars represent the SEM. (D) The P34L variant of zebrafish hrg1a is unable to rescue the hematological defects associated with hrg1a MO2 (hrg1a MO2 + zf hrg1a P34L vs hrg1a MO2, P>0.05) compared to wild-type zfhrg1a (hrg1a MO2 + zf hrg1a vs hrg1a MO2, P<0.01). Zebrafish embryos injected with hrg1a MO2 (2.7 ng/ embryo) exhibit a hematological defect (hrg1a MO2 vs uninjected, P<0.001; see Figure S8B). Rescue experiments were performed by co-injecting hrg1a MO2 with 120 pg/embryo of hrg1a mRNA or 120 pg/embryo of hrg1a P34L mRNA in 1–2 cell stage embryos. Following O-dianisidine staining at 48 hpf (hours post fertilization), the numbers of affected embryos showing erythroid defects were counted; ~ 150 embryos were analyzed per morpholino treatment. The graph shows the percentage of morphants (erythroid defect) and wild type (no erythroid defect) embryos. Error bars represent the SEM. (E) Golgi HRP activity is dependent on heme. HEK-293 cells were grown in HD media (−) and pre-treated with 100 µM DFO or 0.5 mM succinyl acetone (SA) where indicated. Following transfection with a construct expressing either vector control or Golgi-HRP, cells were exposed to 2 µM heme:arginate for 24 h prior to harvesting. Golgi-HRP activity from lysates was assessed using on-blot chemiluminescence following SDS-PAGE. HRP protein was detected on a separate immunoblot using a rabbit α-HRP antibody. Actin is shown as a loading control. (F) Dose response of HRP activity in BMDM transduced with adenovirus expressing Golgi-HRP in the presence of the indicated concentrations of heme. Inset represents data for 0 to 5 µM Heme in enlarged format. (G, H) Golgi-HRP activity in BMDM treated with 0.5 µM heme: arginate (G) or fed RBCs at a 1:1 RBC:BMDM ratio (H). BMDM were co-transduced with adenovirus expressing Golgi HRP and either pShuttle-CMV vector, hHRG1-HA, or hHRG1 P36L-HA (see Fig. S5E and S5F). Cell lysates were assessed for peroxidase activity (µU/ml). Values were normalized for total protein levels of corresponding lysates. Statistical analysis: HRP assay heme-treated samples, n=9, Vector vs hHRG1-HA p<0.0001, Vector vs P36L-HA p>0.05; EP-treated samples, n=9, Vector vs hHRG1-HA p<0.0001, Vector vs P36L-HA p>0.05; Error bars represent the SEM. (C, G and H), Values with different letter labels are significantly different (p<0.05). (I) Proposed model for Hrg1-mediated heme transport in macrophages. Following phagocytosis of a senescent RBC by a macrophage cell, the RBC is sequestered in the phagolysosomal compartment and degraded via the activity of various enzymes, yielding the release of heme. During EP, HRG1 traffics from the endolysosomal compartment to the phagolysosomal membrane, where it functions to transport heme into the cytosol. Heme may be delivered to 3 separate pathways: 1) degradation by the HMOX1/2 enzymes; this results in the release of iron, which may be exported back into the circulation via ferroportin (FPN1), or stored into ferritin (FTN); 2) incorporation in toto into hemoproteins or 3) export via FLVCR. See also Figure S5.

Similar articles

Cited by

References

    1. Abboud S, Haile DJ. A novel mammalian iron-regulated protein involved in intracellular iron metabolism. J Biol Chem. 2000;275:19906–19912. - PubMed
    1. Adams PC, Reboussin DM, Barton JC, McLaren CE, Eckfeldt JH, McLaren GD, Dawkins FW, Acton RT, Harris EL, Gordeuk VR, et al. Hemochromatosis and iron-overload screening in a racially diverse population. N Engl J Med. 2005;352:1769–1778. - PubMed
    1. Andrews NC. Disorders of iron metabolism. N Engl J Med. 1999a;341:1986–1995. - PubMed
    1. Andrews NC. Medical Progress: Disorders of iron metabolism. The New England journal of medicine. 1999b;341:1986–1995. - PubMed
    1. Bard F, Casano L, Mallabiabarrena A, Wallace E, Saito K, Kitayama H, Guizzunti G, Hu Y, Wendler F, Dasgupta R, et al. Functional genomics reveals genes involved in protein secretion and Golgi organization. Nature. 2006;439:604–607. - PubMed

Publication types

MeSH terms