. 2013 Feb 5;17(2):282-90.
doi: 10.1016/j.cmet.2013.01.007.

The IRP1-HIF-2α axis coordinates iron and oxygen sensing with erythropoiesis and iron absorption

Affiliations

The IRP1-HIF-2α axis coordinates iron and oxygen sensing with erythropoiesis and iron absorption

Sheila A Anderson et al. Cell Metab. .

Abstract

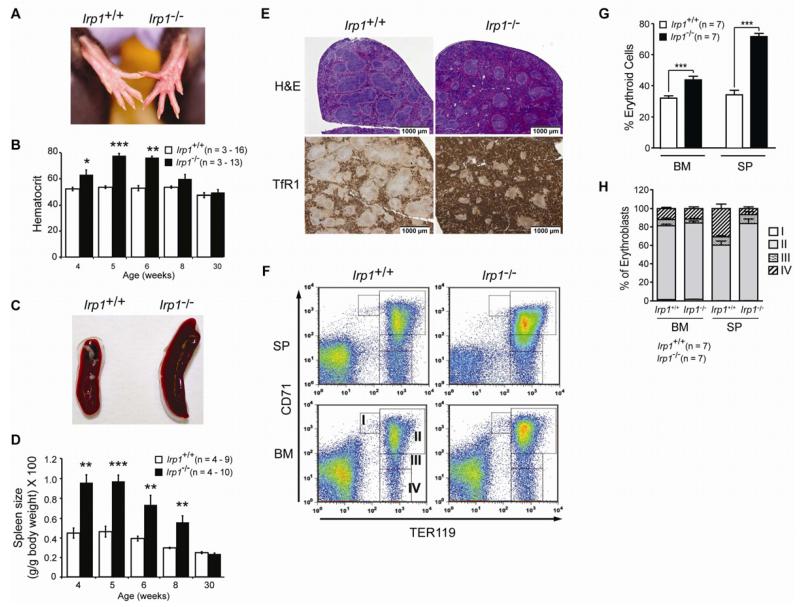
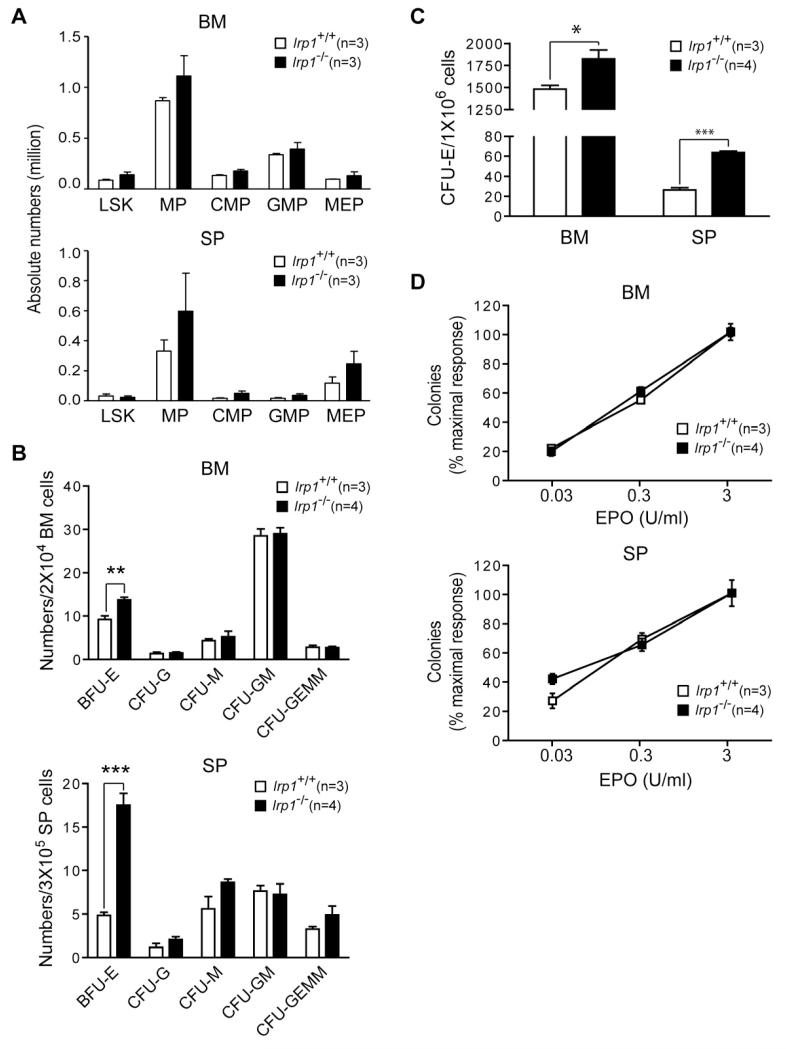
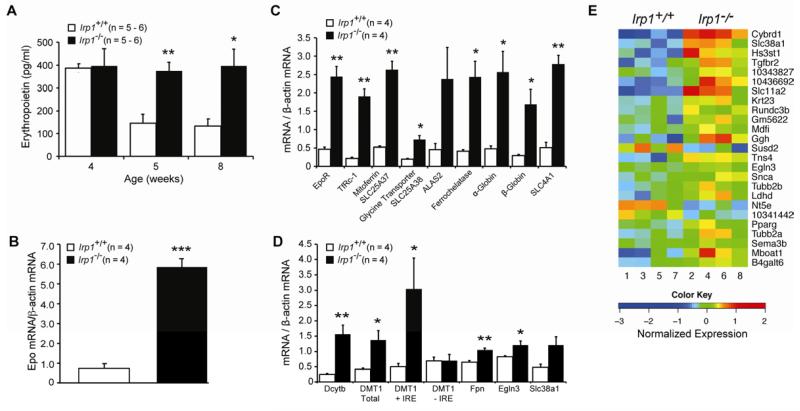
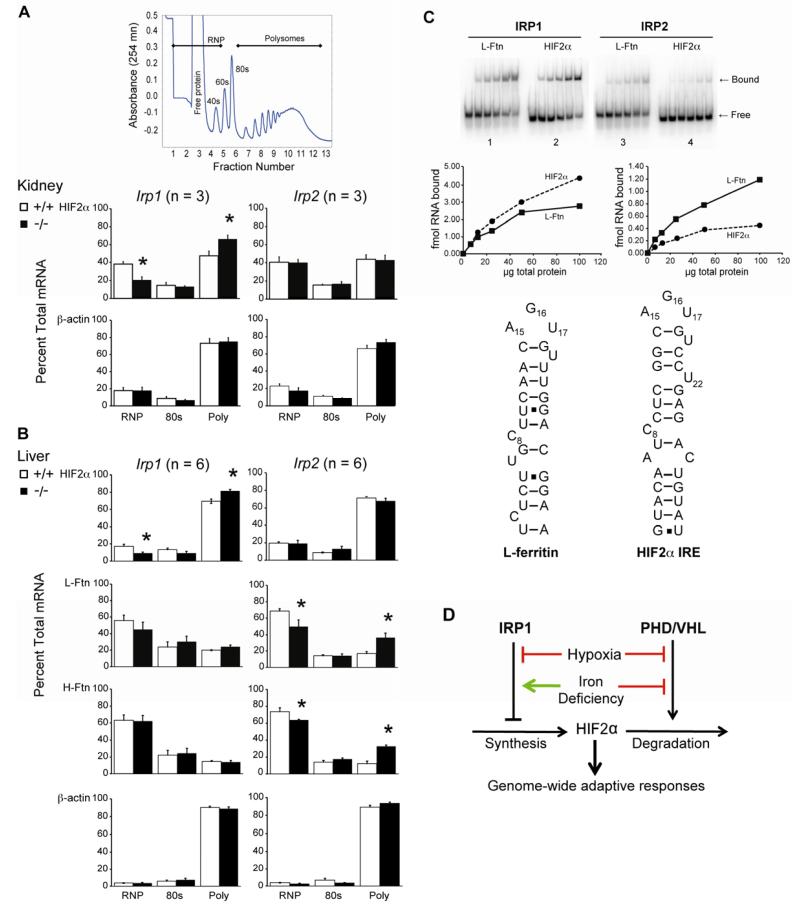
Red blood cell production is a finely tuned process that requires coordinated oxygen- and iron-dependent regulation of cell differentiation and iron metabolism. Here, we show that translational regulation of hypoxia-inducible factor 2α (HIF-2α) synthesis by iron regulatory protein 1 (IRP1) is critical for controlling erythrocyte number. IRP1-null (Irp1(-/-)) mice display a marked transient polycythemia. HIF-2α messenger RNA (mRNA) is derepressed in kidneys of Irp1(-/-) mice but not in kidneys of Irp2(-/-) mice, leading to increased renal erythropoietin (Epo) mRNA and inappropriately elevated serum Epo levels. Expression of the iron transport genes DCytb, Dmt1, and ferroportin, as well as other HIF-2α targets, is enhanced in Irp1(-/-) duodenum. Analysis of mRNA translation state in the liver revealed IRP1-dependent dysregulation of HIF-2α mRNA translation, whereas IRP2 deficiency derepressed translation of all other known 5' iron response element (IRE)-containing mRNAs expressed in the liver. These results uncover separable physiological roles of each IRP and identify IRP1 as a therapeutic target for manipulating HIF-2α action in hematologic, oncologic, and other disorders.


Figures

Figure 1
Figure 1. Polycythemia and Extramedullary Erythropoiesis in IRP1-deficient Mice
[A] Rear paws showing greater redness in Irp1−/− mice. [B] Hematocrit for Irp1+/+ and Irp1−/− mice. Samples were collected from the retroorbital sinus or by cardiac puncture and hematocrit was from CBC analysis. See Table S1. For 30 wk Irp1+/+ mice n = 2. [C] Spleen from 6 wk old WT and Irp1−/− mice. [D] Spleen weight as a percent body weight as a function of age. For 30 wk Irp1+/+ mice n = 2. [E] H & E staining (top) or immunohistochemistry for TfR1 (CD71) (bottom) in spleen. [F] FACS analysis of cells isolated from bone marrow (BM) and spleen (SP) with staining for the erythroid marker Ter119 and CD71 (TfR). The cell populations are separated into stages I – IV reflecting increasing differentiation of the erythroblasts as described (Socolovsky et al., 2001). [G] Percentage of nucleated cells that are erythroblasts in BM and SP. [H] Erythroblast differentiation state in BM and SP as determined by FACS. For panels B, D, G and H results are expressed as mean ± SEM. * = P <0.05; ** = P < 0.01; *** = P < 0.001. Unless noted 5 wk old mice were used. See Tables S1, S3 and Figure S1.
Figure 2
Figure 2. Specific Increase in Erythroid Progenitors in Irp1−/− Mice
[A] Abundance of myeloid progenitor cells (LSK: lineage Sca-1+, c-kit+; MP: myeloid progenitors; CMP: common myeloid progenitors; GMP: granulocyte macrophage progenitors; MEP; megakaryocyte erythroid progenitors in spleen (SP) and bone marrow (BM). For panels B, C and D, BM and SP cells were isolated from Irp1+/+ and Irp1−/− mice and plated in duplicate in M3234 medium with 3 U/ml (B and C) or varying concentrations (D) of Epo. [B] Average percentage of maximum number of colonies formed in culture. For BFU-E (burst forming unit-erythroid), CFU-G (colony forming unit (CFU)-granulocyte), CFU-M (CFU-macrophage), CFU-GM (CFU-granulocyte-macrophage) and CFU-GEMM (CFU-granulocyte, erythroid, macrophage, megakaryocytic) colony formation, BM and SP cells were plated in M3434 medium, and colonies counted at day 7 after plating. [C] CFU-E (CFU-erythroid) number in BM and SP. [D] CFU-E number as a function of Epo concentration. Error bars show SEM. * p<0.05, ** p<0.01, *** p<0.001. Mice were 5 wk old.
Figure 3
Figure 3. HIF-2α Hyperactivity in IRP1-deficient Mice
[A] Serum Epo (pg/ml) in 4 wk, 5 wk and 8 wk old mice. [B] Kidney Epo mRNA level at 5 wk. [C] Erythroid differentiation gene mRNA levels in spleen at 5 wk. [D] Duodenal mRNA level for iron transport proteins and other HIF-2α (e.g. EGLN3) targets dependent on HIF-2α for induction in iron deficiency (5 wk). [E] Microarray analysis of duodenal mucosal cells at 5 wk. Response of each of 4 mice/genotype is shown. Posterior probability of differential expression for all genes is greater the 0.95. Expression of 5 erythroid genes (globin chains α1212 and ALAS2) is not shown. Results in this figure are expressed as mean ± SEM. * = P <0.05; ** = P < 0.01; *** = P < 0.001. (see Methods and Figure S2).
Figure 4
Figure 4. Selective Dysregulation of HIF-2α mRNA Translation in Irp1−/− Mice
[A] Kidney polysome profile (PP) analysis at 8 wk. A typical PP is shown. [B] Liver PP analysis at 8 wk. [C] EMSA from Irp2−/− or Irp1−/− kidney cytosol. Panels 1 and 2 show binding of RNAs (0.5 nM) using Irp2−/− kidney cytosol so binding is to IRP1. Panels 3 and 4 show binding of RNAs (0.5 nM) using Irp1−/− kidney cytosol so binding is to IRP2. Result is representative of n = 2 experiments. Proposed secondary structure of L-ferritin and HIF-2α IRE. [D] Model of the impact of IRP1 on HIF-2α regulation. Results in panels A and B are expressed as mean ± SEM * = P <0.05; ** = P < 0.01; *** = P < 0.001. See Tables S4 and S5.

References

    1. Anderson CP, Shen M, Eisenstein RS, Leibold EA. Mammalian iron metabolism and its control by IRPs. Biochim. Biophys. Acta. 2012;1823:1468–1483. - PMC - PubMed
    1. Andrews NC, Bridges KR. Disorders of iron metabolism and sideroblastic anemia. In: Nathan DG, Oski SH, editors. Nathan and Oski’s Hematology in Infancy and Childhood. W.B. Saunders; Philadelphia, PA: 1998. pp. 423–461.
    1. Bullock GC, Delehanty LL, Talbot AL, Gonias SL, Tong WH, Rouault TA, Dewar B, Macdonald JM, Chruma JJ, Goldfarb AN. Iron control of erythroid development by a novel aconitase-associated regulatory pathway. Blood. 2010;116:97–108. - PMC - PubMed
    1. Cooperman SS, Meyron-Holtz EG, Olivierre-Wilson H, Ghosh MC, McConnell JP, Rouault TA. Microcytic anemia, erythropoietic protoporphyria, and neurodegeneration in mice with targeted deletion of IRP 2. Blood. 2005;106:1084–1091. - PMC - PubMed
    1. Davis MR, Shawron KM, Rendina E, Peterson SK, Lucas EA, Smith BJ, Clarke SL. Hif-2α is translationally repressed in response to dietary iron deficiency. J. Nutr. 2011;141:1590–1596. - PMC - PubMed

Publication types

MeSH terms