. 2013 Feb 21;3(2):472-84.
doi: 10.1016/j.celrep.2013.01.017. Epub 2013 Feb 7.

Tcf15 primes pluripotent cells for differentiation

Affiliations

Tcf15 primes pluripotent cells for differentiation

Owen R Davies et al. Cell Rep. .

Abstract

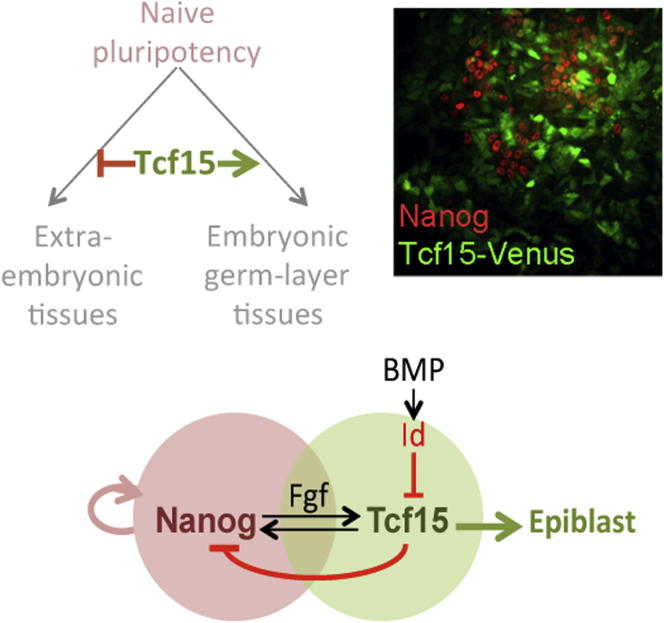
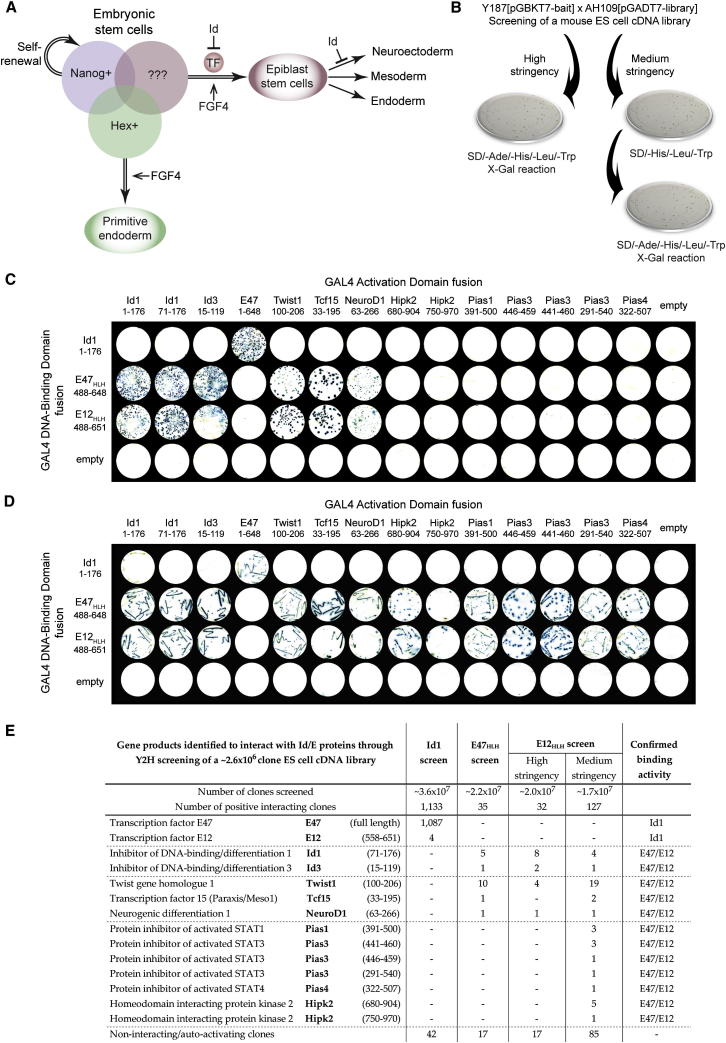
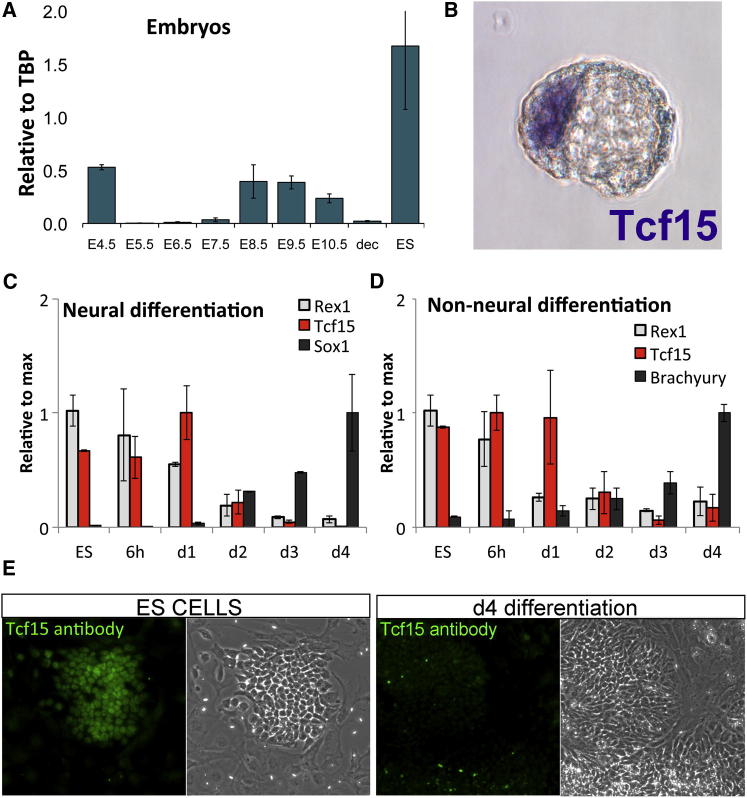
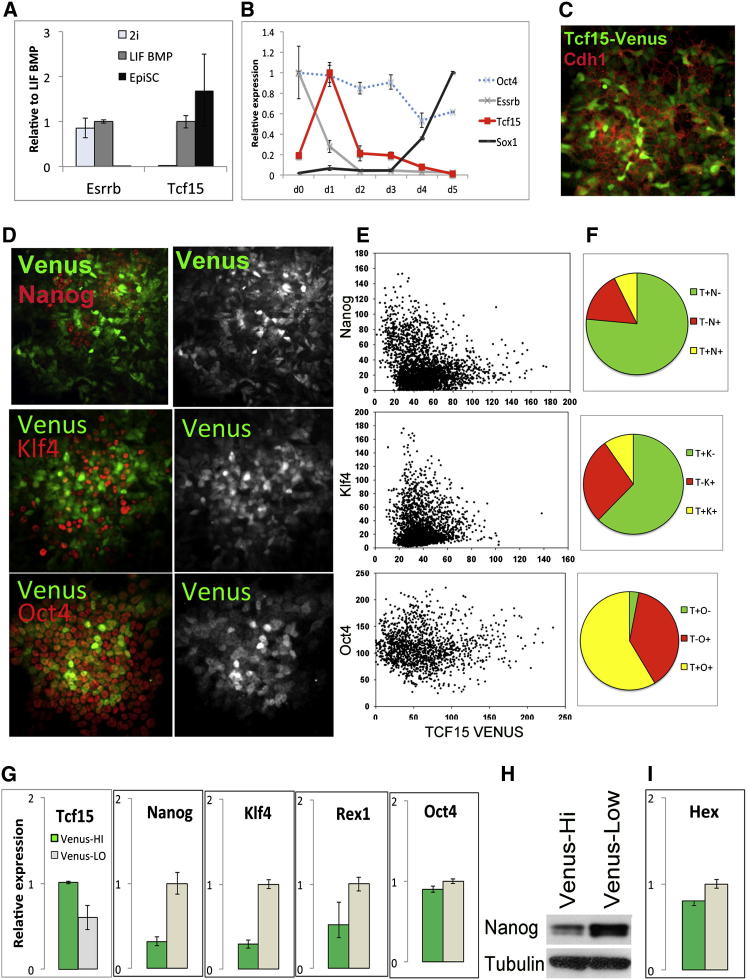
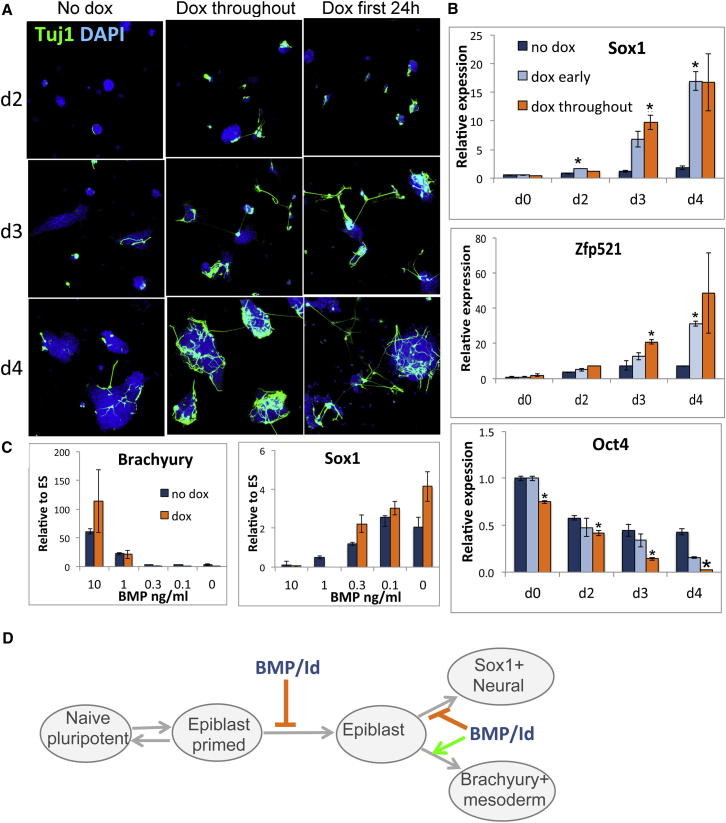
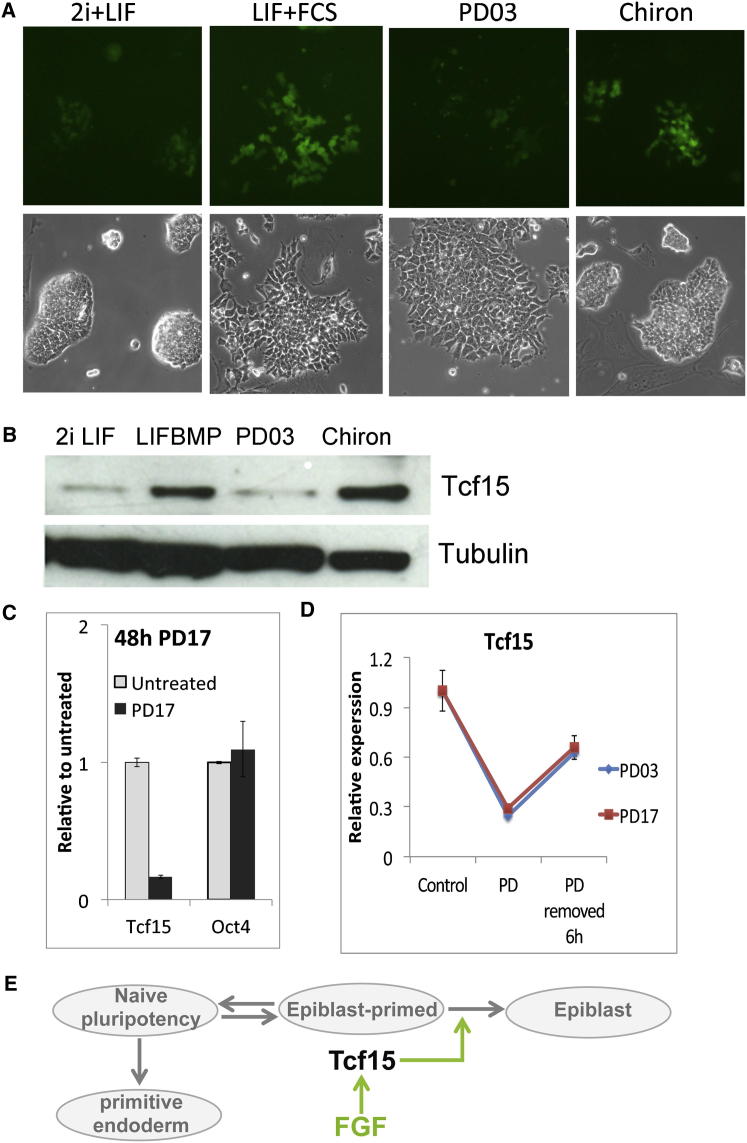
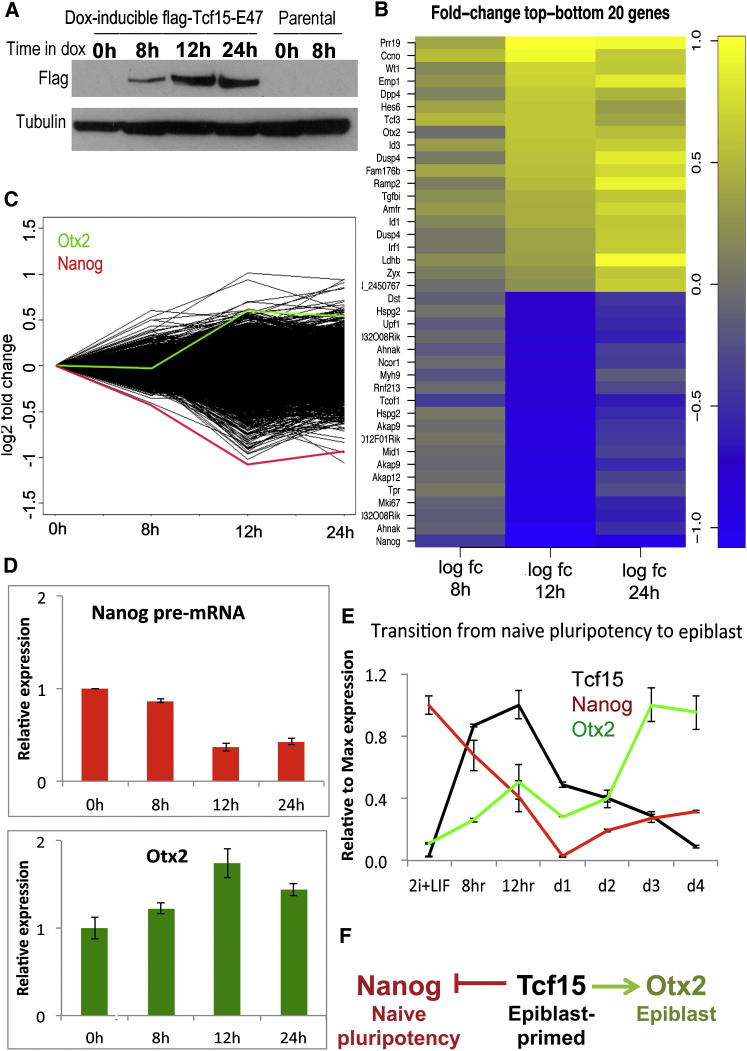
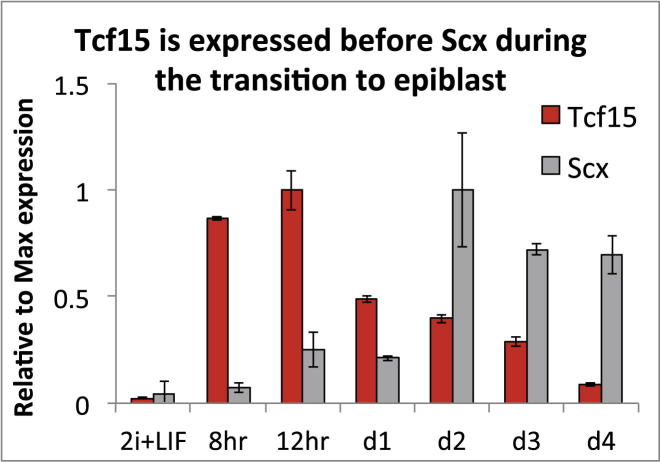
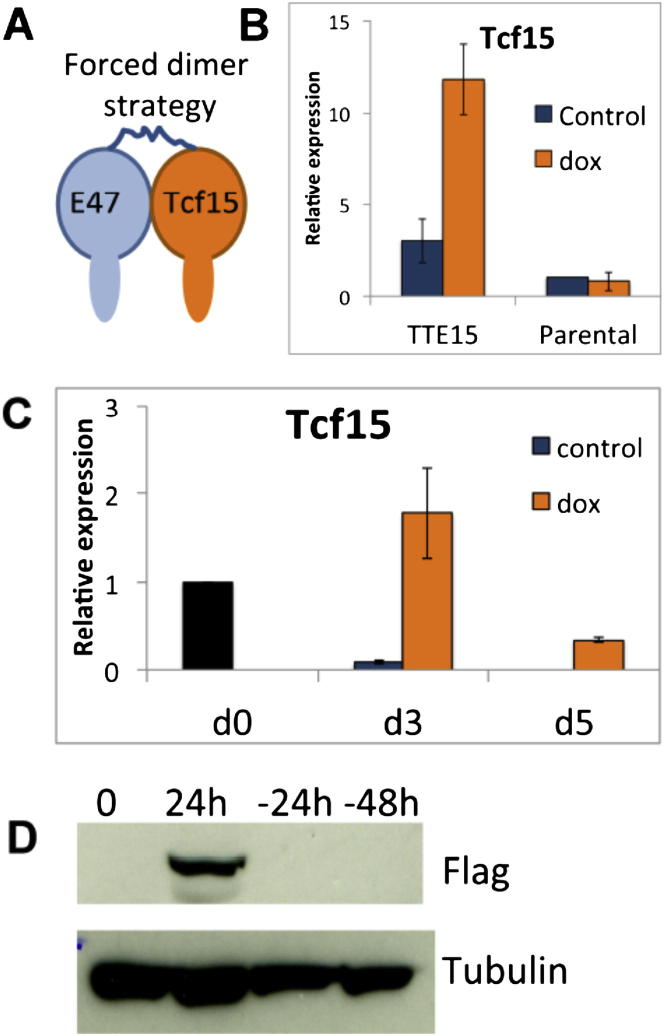
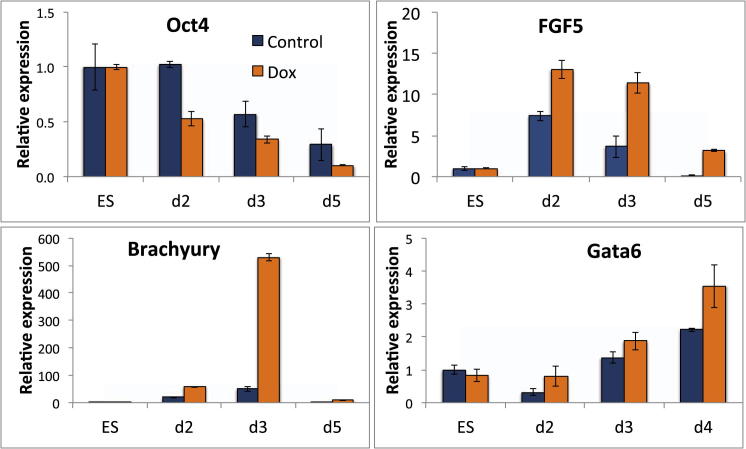
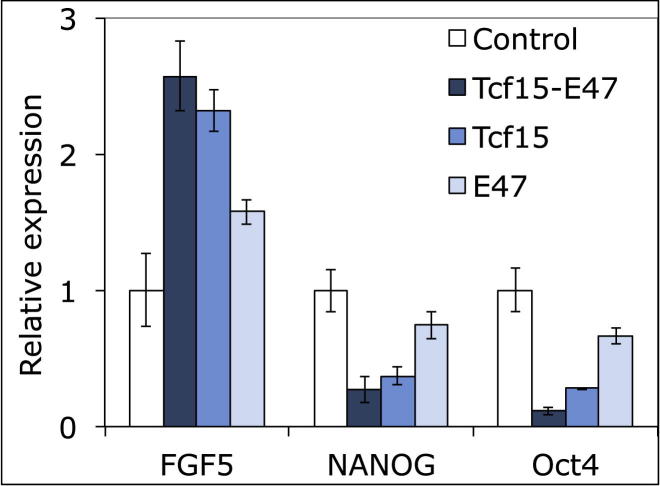
The events that prime pluripotent cells for differentiation are not well understood. Inhibitor of DNA binding/differentiation (Id) proteins, which are inhibitors of basic helix-loop-helix (bHLH) transcription factor activity, contribute to pluripotency by blocking sequential transitions toward differentiation. Using yeast-two-hybrid screens, we have identified Id-regulated transcription factors that are expressed in embryonic stem cells (ESCs). One of these, Tcf15, is also expressed in the embryonic day 4.5 embryo and is specifically associated with a novel subpopulation of primed ESCs. An Id-resistant form of Tcf15 rapidly downregulates Nanog and accelerates somatic lineage commitment. We propose that because Tcf15 can be held in an inactive state through Id activity, it may prime pluripotent cells for entry to somatic lineages upon downregulation of Id. We also find that Tcf15 expression is dependent on fibroblast growth factor (FGF) signaling, providing an explanation for how FGF can prime for differentiation without driving cells out of the pluripotent state.


Figures

None
Graphical abstract
Figure 1
Figure 1
A Y2H Screen to Identify Transcription Factors Regulated by Id1 in ES Cells (A) FGF signaling primes pluripotent cells for differentiation. Id1 inhibits subsequent transitions: first to epiblast and then to neuroepithelium. We hypothesize that unknown Id-regulated transcription factors are expressed in epiblast-primed cells. (B) A Y2H library screen was performed by mating the Y187 yeast strain carrying the pGBKT7-bait vector (Id1, E47HLH, or E12HLH) with the AH109 yeast strain carrying the pGADT7-library vector (mouse ESC cDNA library). For high-stringency selection, positive interactors were determined by growth of mated yeast on SD/-Ade/-His/-Leu/-Trp media and positive X-Gal reaction (indicating activation of ADE2, HIS1 and LacZ reporter genes). For medium-stringency selection, positive interactions were determined by initial growth of mated yeast on SD/-His/-Leu/-Trp media (indicating activation of HIS1 reporter gene), with subsequent growth on SD/-Ade/-His/-Leu/-Trp media and positive X-Gal reaction (indicating activation of ADE2, HIS1 and LacZ reporter genes). (C) High-stringency Y2H analysis of interactions among Id1, E47HLH, and E12HLH, and genes identified through library screens; positive interactors are determined by growth on SD/-Ade/-His/-Leu/-Trp media and positive X-Gal reaction. (D) Medium-stringency Y2H analysis of interactions among Id1, E47HLH, and E12HLH, and genes identified through library screens; positive interactions are determined by initial growth on SD/-His/-Leu/-Trp media with subsequent growth on SD/-Ade/-His/-Leu/-Trp media and positive X-Gal reaction. (E) The genes identified as pGADT7 vector inserts that interact with Id1, E47HLH, or E12HLH at the protein level within yeast are shown along with the number of times clones were identified in each screen, and whether each gene was confirmed as a true binding partner of Id1 or E47/E12 by subsequent analysis. The total numbers of noninteracting and autoactivating inserts identified are also shown.
Figure 2
Figure 2
Tcf15 Is Expressed in Pluripotent Cells (A) qPCR analysis of Tcf15 expression in embryos at different developmental ages. dec, decidual tissue; ES, embryonic stem cells. (B) In situ hybridization of an E4.5 mouse embryo with a Tcf15 probe. (C) qPCR analysis of ESCs undergoing differentiation into the neural lineage in serum-free media. (D) qPCR analysis of ESCs undergoing differentiation into a mixture of predominantly nonneural lineages in the presence of FCS and the absence of LIF. (E) Antibody staining for Tcf15 in ESCs cultures containing a mixture of ESCs and spontaneously differentiating cells or after 4 days differentiation in serum-free media. All data are represented as mean ±SD.
Figure 3
Figure 3
Tcf15 Marks a Subpopulation of Differentiation-Primed ES Cells (A) qPCR analysis of puro-selected Oct4GIP cells after at least 1 week of culture in 2i, LIF + BMP, or EpiSC conditions. (B) qPCR analysis of ESCs undergoing neural differentiation starting from 2i conditions. (C) Antibody staining for E-cadherin (Cdh1) in a population of Tcf15-Venus reporter ESCs in LIF + FCS. (D) Tcf15-gtxIRES-Venus reporter cells stained for Nanog, Klf4, or Oct4. (E) Quantitative immunofluorescence analysis of Tcf15-gtxIRES-Venus reporter cells stained for Nanog, Klf4, or Oct4. (F) Proportion of cells positive for Tcf15-Venus only (green) or Nanog/Klf4/Oct4 (red) or both. (G) qPCR analysis of subpopulations of ESCs gated for PECAM+ and sorted on the basis of Tcf15-Venus expression. (H) Western blot for Nanog in subpopulations of ESCs gated for PECAM+ and sorted on the basis of Tcf15-Venus expression. (I) qPCR analysis of subpopulations of ESCs gated for PECAM+ and sorted on the basis of Tcf15-Venus expression. All data are represented as mean ±SD. See also Figure S1.
Figure 4
Figure 4
Tcf15 Accelerates Differentiation (A) Tuj1 staining to detect neurons during neural differentiation of dox-inducible Tcf15-E47 ESCs. (B) qPCR analysis of dox-inducible Tcf15-E47 ESCs undergoing neural differentiation. (C) qPCR analysis of dox-inducible Tcf15-E47 ESCs after 4 days in N2B27 in the presence of various doses of BMP4. (D) BMP/Id suppresses the transition of ESCs to EpiSC and then the transition of EpiSC toward neural progenitors. All data are represented as mean ±SD. See also Figure S2.
Figure 5
Figure 5
Tcf15 Drives the Transition to Primed Epiblast and Suppresses Primitive Endoderm Differentiation (A) qPCR analysis of dox-inducible Tcf15-E47 ESCs after 4 days in N2B27 + LIF + BMP4. (B) Dox-inducible Tcf15-E47 ESCs after 4 days in N2B27 + LIF + BMP4. Second panel shows cells that received a 24 hr pulse of dox during the first day. (C) Dox-inducible Tcf15-E47 ESCs after 4 days in N2B27. Treatment with dox eliminates spontaneous differentiation into primitive-endoderm-like cells. (D) qPCR analysis of dox-inducible Tcf15-E47 cells during differentiation in N2B27. (E) qPCR analysis of dox-inducible Tcf15-E47 cells after transfer to EpiSC conditions. All data are represented as mean ±SD. See also Figures S3 and S4.
Figure 6
Figure 6
Tcf15 Is Regulated by FGF Signaling (A) Tcf15-Venus cells cultured for 6 days in N2B27 under the stated conditions. (B) Western blot analysis of E14tg2a cells cultured for 6 days in N2B27 under the stated conditions. (C) qPCR analysis of E14tg2a cells treated for 48 hr with the FGFR inhibitor PD17. (D) qPCR analysis of E14tg2a cells in N2B27 + LIF + BMP treated for 48 hr with the FGFR inhibitor PD17 or the ERK inhibitor PD0325901 or 6 hr after washout of inhibitors. (E) FGF upregulates Tcf15 expression and drives the transition to epiblast. All data are represented as mean ±SD.
Figure 7
Figure 7
Tcf15 Downregulates Nanog and Upregulates Otx2 (A) Western blot analysis of flag-Tcf15-E47 or parental cells in ESCs at various time points after addition of dox. (B) Genes that respond most strongly to Tcf15-E47 after 12 hr dox treatment. Note that Tcf3 refers to the E2A gene and detects the E47 transgene in this experiment. (C) Fold change in all genes within the microarray probe set. Nanog is highlighted in red and Otx2 is highlighted in green. (D) qPCR validation showing downregulation of Nanog pre-mRNA and Otx2 mRNA in response to dox-mediated induction of Tcf15-E47 in ESCs. (E) qPCR analysis showing the kinetics of Tcf15, Nanog, and Otx2 expression during the transition toward EpiSC. (F) Model. We propose that Tcf15 suppresses Nanog and activates Otx2 to drive pluripotent cells away from naive pluripotency and toward epiblast. All data are represented as mean ±SD.
Figure S1
Figure S1
Tcf15 Is Expressed Earlier than Scleraxis during the Transition to Epiblast, Related to Figure 3 qPCR analysis for Tcf15 (red) and Scx (gray) during the transition from naive pluripotency (2i+LIF) toward epiblast (FGF+Activin). All data are represented as mean ±SD.
Figure S2
Figure S2
Validation of Dox-Inducible Cell Lines, Related to Figure 4 (A) Forced dimer strategy: Tcf15 is tethered to E47 through a flexible linker. (B) qPCR analysis for Tcf15 in dox-inducible Tcf15-E47 ESCs or parental control ESCs: 48h treatment with dox in LIF+FCS conditions. (C) qPCR analysis for Tcf15 in dox-inducible Tcf15-E47 cells during neural differentiation. (D) Western blot to detect flag-tagged Tcf15 in dox-inducible Tcf15-E47 ESCs after 24h induction with dox or 24 or 48 hr after removal of dox. All data are represented as mean +/− standard deviation.
Figure S3
Figure S3
Tcf15 Accelerates Non-neural Differentiation, Related to Figure 5 qPCR analysis of dox- inducible Tcf15-E47 ESCs undergoing differentiation in FCS in the absence of LIF. All data are represented as mean +/− standard deviation.
Figure S4
Figure S4
Tcf15 but Not E47 Can Recapitulate the Pro-differentiation Activity of Tcf15-E47, Related to Figure 5 qPCR analysis of wild-type ESCs following transient transfection with plasmids encoding Tcf15-E47, Tcf15 monomer, E47 monomer, or empty vector control. Cells were cultured for four days in LIF+BMP in the absence of selection before qPCR analysis. All data are represented as mean +/− standard deviation.

References

    1. Acampora D., Di Giovannantonio L.G., Simeone A. Otx2 is an intrinsic determinant of the embryonic stem cell state and is required for transition to a stable epiblast stem cell condition. Development. 2012;140:43–55. - PubMed
    1. Bao S., Tang F., Li X., Hayashi K., Gillich A., Lao K., Surani M.A. Epigenetic reversion of post-implantation epiblast to pluripotent embryonic stem cells. Nature. 2009;461:1292–1295. - PMC - PubMed
    1. Benezra R. An intermolecular disulfide bond stabilizes E2A homodimers and is required for DNA binding at physiological temperatures. Cell. 1994;79:1057–1067. - PubMed
    1. Brons I.G., Smithers L.E., Trotter M.W., Rugg-Gunn P., Sun B., Chuva de Sousa Lopes S.M., Howlett S.K., Clarkson A., Ahrlund-Richter L., Pedersen R.A., Vallier L. Derivation of pluripotent epiblast stem cells from mammalian embryos. Nature. 2007;448:191–195. - PubMed
    1. Brown D., Wagner D., Li X., Richardson J.A., Olson E.N. Dual role of the basic helix-loop-helix transcription factor scleraxis in mesoderm formation and chondrogenesis during mouse embryogenesis. Development. 1999;126:4317–4329. - PubMed

Supplemental References

    1. Dunning M.J., Smith M.L., Ritchie M.E., Tavaré S. beadarray: R classes and methods for Illumina bead-based data. Bioinformatics. 2007;23:2183–2184. - PubMed
    1. Gentleman R.C., Carey V.J., Bates D.M., Bolstad B., Dettling M., Dudoit S., Ellis B., Gautier L., Ge Y., Gentry J. Bioconductor: open software development for computational biology and bioinformatics. Genome Biol. 2004;5:R80. - PMC - PubMed
    1. Li G., Liu T., Tarokh A., Nie J., Guo L., Mara A., Holley S., Wong S.T.C. 3D cell nuclei segmentation based on gradient flow tracking. BMC Cell Biol. 2007;8:40. - PMC - PubMed
    1. Wettenhall J.M., Smyth G.K. limmaGUI: a graphical user interface for linear modeling of microarray data. Bioinformatics. 2004;20:3705–3706. - PubMed

Publication types

MeSH terms

Associated data