Comparative Study
. 2013 Mar;15(3):284-94.
doi: 10.1038/ncb2690. Epub 2013 Feb 10.

miR-126 and miR-126* repress recruitment of mesenchymal stem cells and inflammatory monocytes to inhibit breast cancer metastasis

Affiliations
Comparative Study

miR-126 and miR-126* repress recruitment of mesenchymal stem cells and inflammatory monocytes to inhibit breast cancer metastasis

Yun Zhang et al. Nat Cell Biol. 2013 Mar.

Abstract

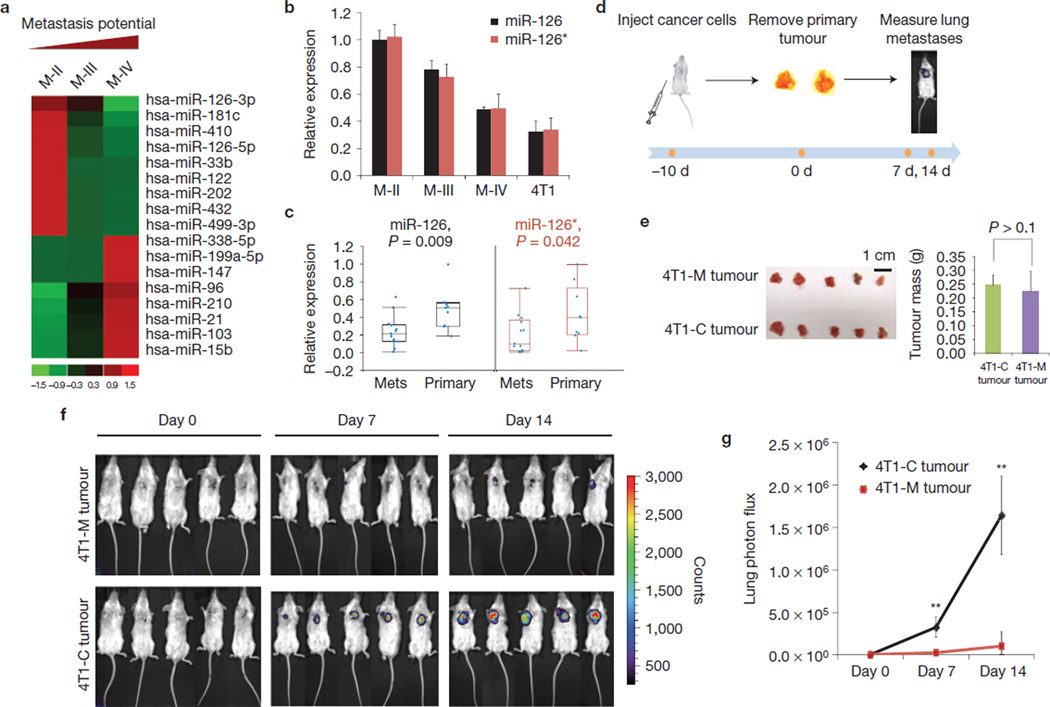
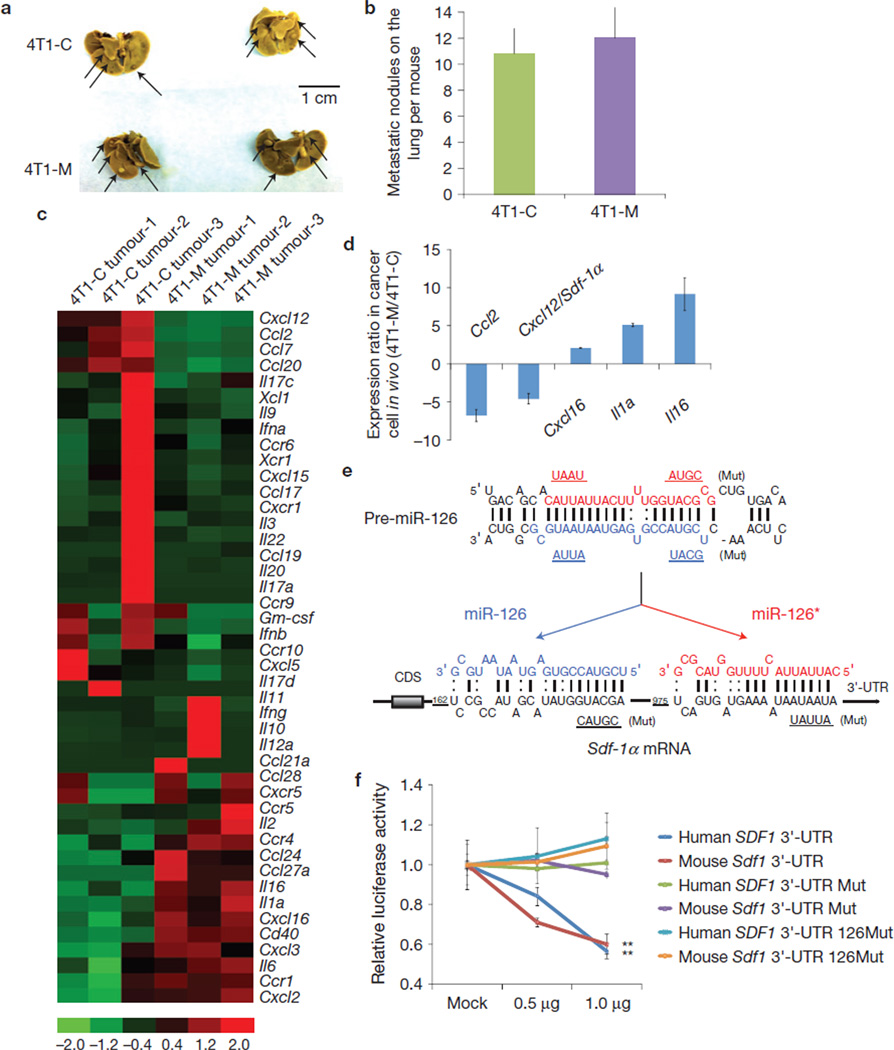
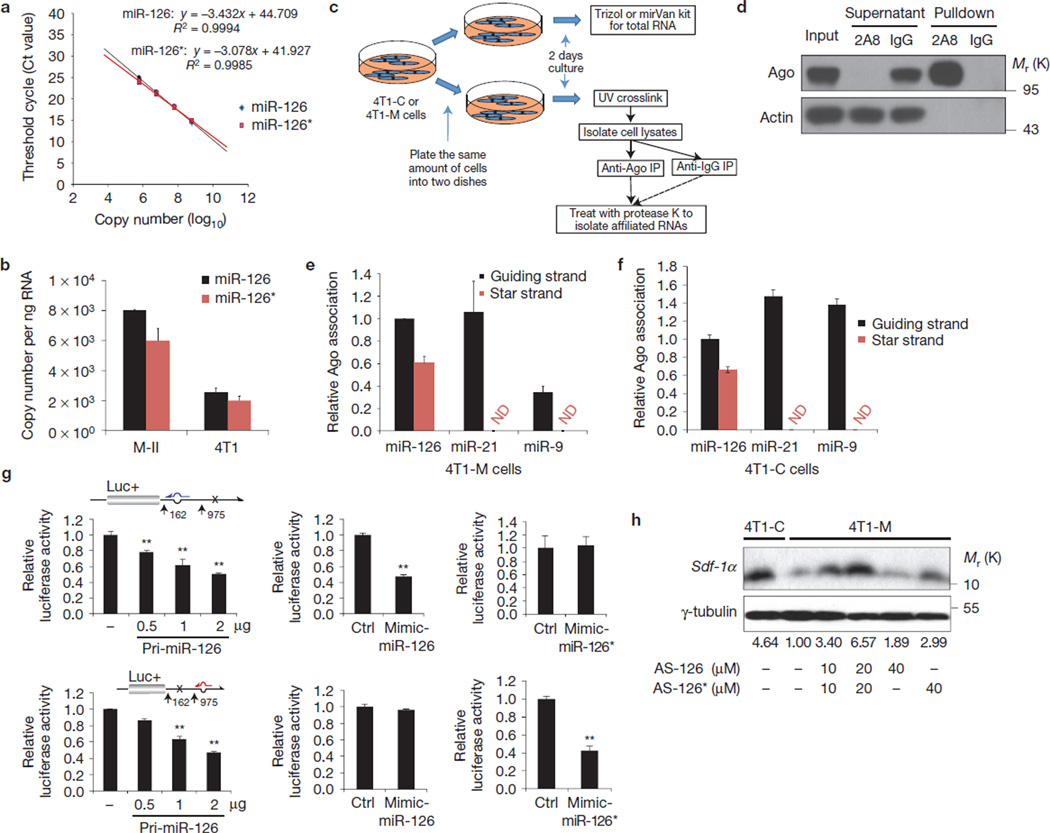
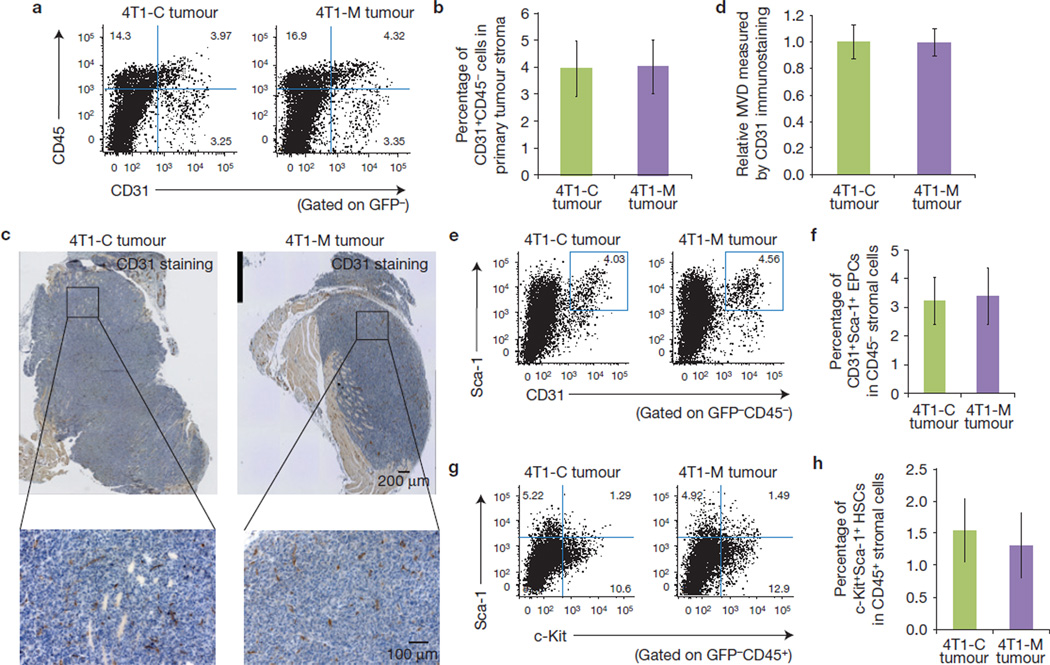
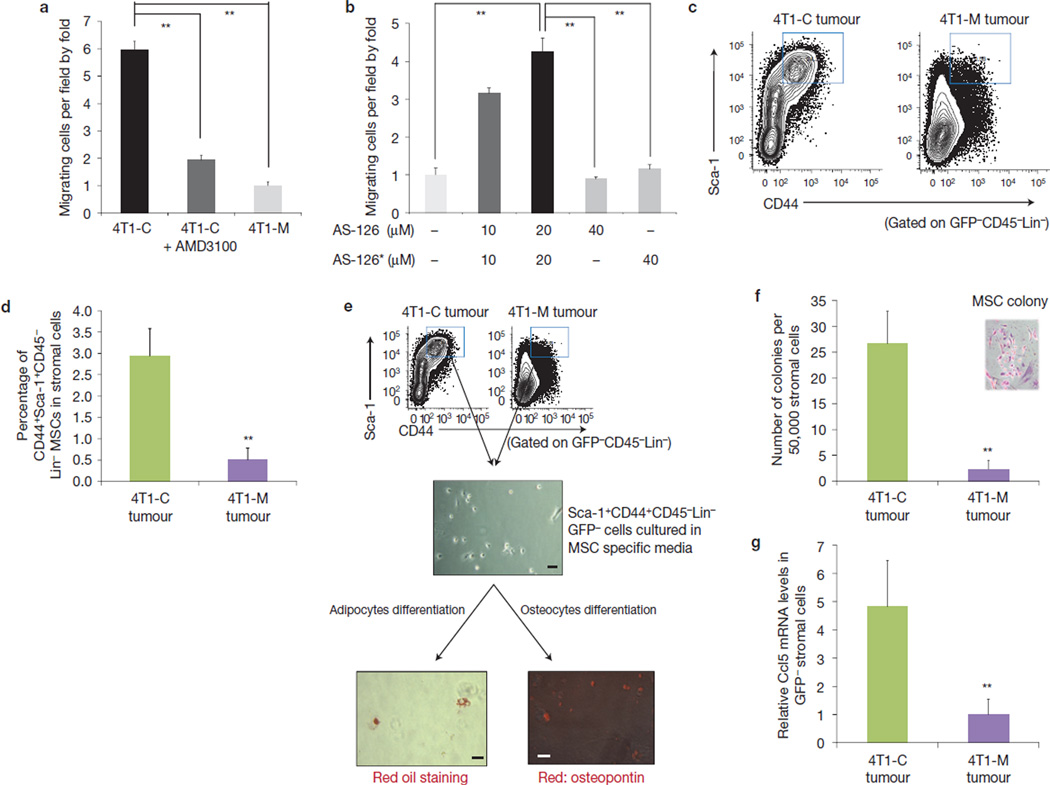
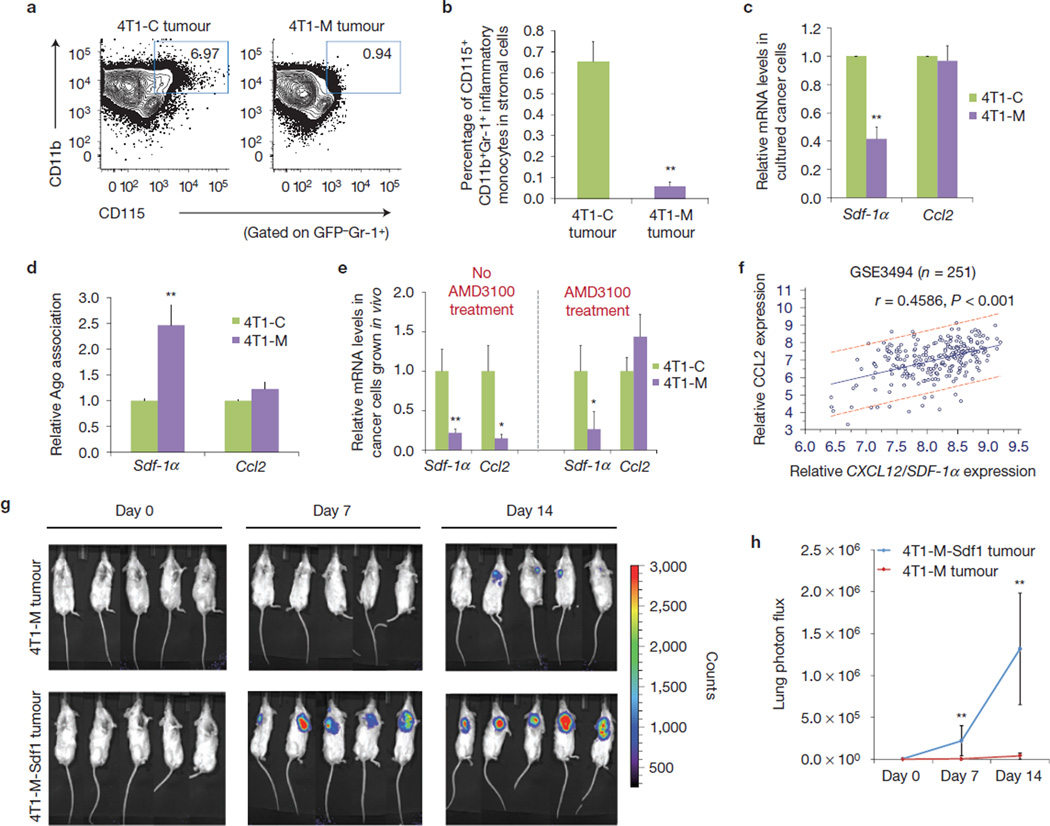
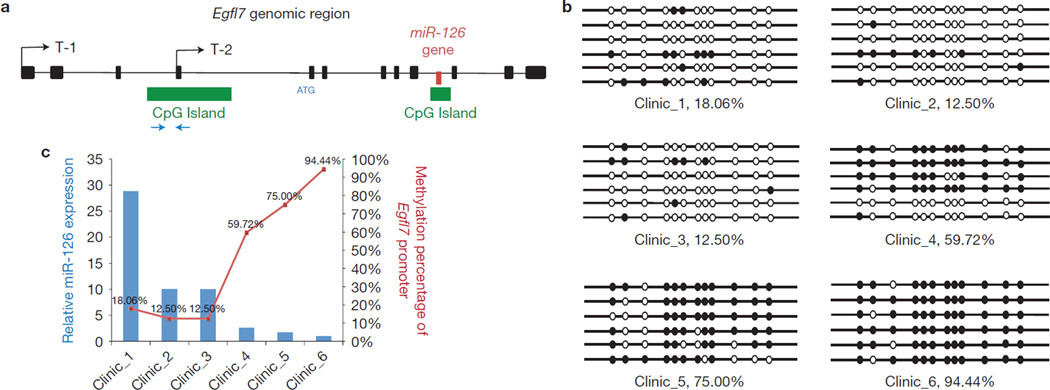
The tumour stroma is an active participant during cancer progression. Stromal cells promote tumour progression and metastasis through multiple mechanisms including enhancing tumour invasiveness and angiogenesis, and suppressing immune surveillance. We report here that miR-126/miR-126(*), a microRNA pair derived from a single precursor, independently suppress the sequential recruitment of mesenchymal stem cells and inflammatory monocytes into the tumour stroma to inhibit lung metastasis by breast tumour cells in a mouse xenograft model. miR-126/miR-126(*) directly inhibit stromal cell-derived factor-1 alpha (SDF-1α) expression, and indirectly suppress the expression of chemokine (C-C motif) ligand 2 (Ccl2) by cancer cells in an SDF-1α-dependent manner. miR-126/miR-126(*) expression is downregulated in cancer cells by promoter methylation of their host gene Egfl7. These findings determine how this microRNA pair alters the composition of the primary tumour microenvironment to favour breast cancer metastasis, and demonstrate a correlation between miR-126/126(*) downregulation and poor metastasis-free survival of breast cancer patients.


Figures

Figure 1
Figure 1
Identification of miR-126 and miR-126* as potential suppressors of breast cancer metastasis. (a) A partial list of microRNAs whose expression pattern correlates with metastatic potential in M-II (MCF10 AT1k, benign), M-III (MCF10 Ca1h, low metastatic) and M-IV (MCF10 Ca1a.c11, high metastatic) cells. A total of 242 microRNAs were tested in a quantitative-rtPCR-based array as previously described. Data were normalized using U6 RNA. (b) miR-126 and miR-126* expression were inversely correlated with metastatic potential. The relative expression levels of miR-126 and miR-126* were measured by quantitative rtPCR and normalized to U6 RNA. The data presented are shown as mean±s.d. collected from three independent experiments. (c) miR-126 and miR-126* are expressed at a higher level in primary breast tumours than in metastatic tumour samples. The relative expression levels of miR-126 and miR-126* in 9 primary and 13 metastatic tissues were measured by quantitative rtPCR and normalized to U6 RNA. In the box-and-whisker plot, each point represents one sample. The central box represents the values from the lower to upper quartile. The middle line represents the median. The horizontal line extends from the minimum to the maximum value excluding far-out values. (d) Schematic procedure of in vivo tumour implantation and lung metastases measurement. (e) Pri-miR-126 ectopic expression had little impact on primary tumour size or weight. Approximately 5×10⁴ control or ectopic pri-miR-126-expressing 4T1 cells harbouring a luciferase reporter were implanted into the mammary fat pad of 6-week-old female BALB/c mice. After 10 days, tumours grown at the primary site were surgically removed and weighed. The data presented are shown as mean±s.d. collected from five independent experiments. (f) Pri-miR-126 suppressed the formation of lung metastases by 4T1 cells. Metastatic lung lesion formation was monitored by the appearance of luciferase activity using imaging apparatus 7 and 14 days after primary tumour removal, n = 5 in each group. (g) Quantification of the results shown in f. The data are shown as mean±s.d. collected from five independent experiments. **P < 0.01.
Figure 2
Figure 2
Identification of Sdf-1α as a target for miR-126/126*. (a) Representative lung images showing the metastatic nodules formed two weeks after 4T1-C and 4T1-M cells were intravenously inoculated into BALB/c mice through the tail vein. The lung tissues were stained with Bouin’s solution. Arrows indicate metastatic nodules. (b) Quantification of he number of metastatic nodules on the lungs formed by 4T1-C and 4T1-M cells. The data presented are shown as mean±s.d. collected from five independent experiments. (c) List of cytokines and chemokines or their receptors with a more than twofold expression difference between carcinoma cells dissociated from 4T1-C and 4T1-M cell-derived tumours in vivo. Tumour samples from three mice for each cell type were used in the analysis as indicated. (d) Five cytokines and chemokines with significantly altered expression (P < 0.05) from the list in c were confirmed using quantitative rtPCR and normalized with β-actin. The data presented are shown as mean±s.d. collected from three independent experiments. (e) The 3′-UTR of the Sdf-1α gene contains binding sites for both miR-126 and miR-126* according to bioinformatic analysis. Coloured underlined sequences show the point mutations used to generate the pri-miR-126Mut construct. Black underlined sequences show the point mutations used to generate human and mouse Sdf-1α 3′-UTR Mut constructs. (f) Pri-miR-126 suppressed the expression of a luciferase reporter gene harbouring the 3′-UTR of Sdf-1α. The pmiRGLO plasmid was modified by adding the human or mouse wild-type Sdf-1α 3′-UTR or the 3′-UTRs with mutations in regions complementary to both the miR-126 and miR-126* seed regions behind the firefly luciferase gene. HEK293T cells were transiently co-transfected with negative control (mock) or pri-miR-126 together with the indicated luciferase constructs, and luciferase activity was analysed 48 h later. Data are presented as relative firefly luciferase activity normalized to Renilla luciferase activity from the same construct. The data presented are shown as mean±s.d. collected from three independent experiments. **P < 0.01.
Figure 3
Figure 3
miR-126 and miR-126* regulate Sdf-1α independently. (a) Correlation of RNA input to the threshold of cycle (Ct) values for miR-126 and miR-126*. Single-strand miR-126 or miR-126* RNA input ranged from 10−10 to 10−3 pmol per RT reaction. (b) Quantitative rtPCR demonstrated similar miR-126 and miR-126* expression in M-II or 4T1 cells. The data presented are shown as mean±s.d. collected from three independent experiments. The standard curve generated in a was used to calculate the copy numbers. (c) The procedure for anti-Ago RNA immunoprecipitation (IP). Cells (4T1-C or 4T1-M) were divided into two parts for total RNA extraction (upper arrow) and anti-Ago immunoprecipitation followed by RNA extraction (lower arrow). (d) Western blot shows the specificity and efficiency of anti-Ago immunoprecipitation using 4T1-M cells; 2A8 is an anti-Ago antibody. (e) Both miR-126 and miR-126* incorporate into RISC in 4T1-M cells. RISC-associated microRNAs were examined by quantitative rtPCR in the immunoprecipitates generated using an anti-Ago antibody from 4T1-M cells, and normalized by comparison with their expression levels in whole-cell lysates. The data presented are shown as mean±s.d. collected from three independent experiments. ND, undetectable. (f) Both miR-126 and miR-126* incorporate into RISC in 4T1-C cells. The data presented are shown as mean±s.d. collected from 3 independent experiments. (g) miR-126 and miR-126* regulate SDF-1Α expression independently. The pmiRGLO plasmid containing the 3′-UTR of mouse SDF-1Α was modified into two plasmids containing the intact binding site for either miR-126 or miR-126* alone (blue represents miR-126; red represents miR-126*). These two plasmids were co-transfected with pri-miR-126, mimic miR-126 RNA duplex or mimic miR-126* RNA duplex separately. The data presented are shown as mean±s.d. collected from three independent experiments. (h) Western blotting was used to analyse the presence of Sdf-1α in the concentrated supernatant from 4T1-C or 4T1-M cells treated with anti-miR-126 or anti-miR-126* LNA oligonucleotides at the indicated concentrations. The whole-cell lysate from each sample of cells from which the supernatant was collected was blotted with anti-tubulin antibody as a loading control. The results were quantifed using ImageJ and normalized results are shown under the blots. Uncropped images of blots are shown in Supplementary Fig. S8.
Figure 4
Figure 4
miR-126/miR-126* do not suppress tumour angiogenesis or the recruitment of HSCs and EPCs. (a) Fluorescence-activated cell sorting (FACS) analysis of tumours showing the proportion of CD45CD31+ endothelial cells inside the GFP tumour-associated stroma. (b) Quantification of the percentage of endothelial cells in 4T1-C and 4T1-M tumour stroma. Error bars represent mean±s.d. collected from three independent experiments. P > 0.1 by Student’s t-test, indicating no statistical significance. (c) Representative CD31 immunostaining of 4T1-C- and 4T1-M-initiated tumours. Scale bars, 200 µm (upper panels) and 100 µm (lower panels). (d) Relative microvascular density (MVD) determined by CD31 staining. Five random fields in each tumour were counted for MVD. Error bars represent mean±s.d. from three independent experiments. P > 0.1 by Student’s t-test, indicating no statistical significance. (e) FACS analysis of tumours showing the proportion of CD31+Sca-1+ EPCs inside the GFP tumour-associated stroma. (f) Quantification of the percentage of EPCs in 4T1-C and 4T1-M tumour stroma. Error bars represent mean±s.d. collected from three independent experiments. P > 0.1 by Student’s t-test, indicating no statistical significance. (g) FACS analysis of tumours showing the proportion of CD45+Sca-1+c-Kit+ HSCs inside the GFP tumour-associated stroma. (h) Quantification of the percentage of HSCs in 4T1-C and 4T1-M tumours. Error bars represent mean±s.d. collected from three independent experiments. P > 0.1 by Student’s t-test, indicating no statistical significance.
Figure 5
Figure 5
miR-126/miR-126* suppress MSC migration through downregulating Sdf-1α in vitro and in vivo. (a) Migrating capability of MSCs towards supernatants from 4T1-C or 4T1-M cells. Approximately 5×10⁴ mouse MSCs were used for each Transwell assay over a period of 18 h. For AMD3100 treatment, MSCs were cultured in the presence of AMD3100 at the indicated concentration for 24 h before being plated into the upper chamber. Data are presented as mean±s.d. from three independent experiments. In each experiment, five random fields were counted to measure the migrating MSCs. (b) Results of a similar experiment as in a except that the cancer cells were treated with anti-miR-126 or anti-miR-126* LNA oligonucleotides for 24 h before the supernatant was collected. The concentrations of LNA oligonucleotides are indicated. Data are presented as mean±s.d. from three independent experiments. In each experiment, five random fields were counted to measure the migrating MSCs. (c) FACS analysis of tumours showing the proportion of Sca-1+CD44+CD45LinGFP MSCs inside the tumour-associated GFP stroma. (d) Quantification of the percentage of Sca-1+CD44+CD45LinGFP MSCs in 4T1-C- and 4T1-M-initiated tumour stroma. The data presented are shown as mean±s.d. collected from three independent experiments. (e) The tumour-derived Sca-1+CD44+CD45LinGFP population is able to differentiate into adipocytes and osteocytes. Sca-1+CD44+CD45LinGFP cells were isolated and cultured in MSC-specific medium (StemCell Technologies). These cells were then induced to differentiate into either adipocytes or osteocytes using the Mouse MSC Functional Identification Kit from R&D systems. Adipocytes were visualized using red oil staining. Osteocytes were identified by using an antibody against osteopontin. Scale bar, 50 µm. (f) Different MSC loads detected in the tumours as demonstrated by the colony-formation assay. Primary tumours with or without pri-miR-126 ectopic expression were collected 10 days after implantation. GFP tumour-associated stromal cells were purified using FACS. The stromal cells were counted and plated in MesenCult (StemCell Technologies) for 14 days for the detection of mouse MSCs. CFU-F colonies as shown in the figure inset were then counted, and normalized to the total number of plated stromal cells. Data are presented as mean±s.d. from three independent experiments. (g) Ccl5 mRNA expression is correlated with MSC presence in the tumours. Ccl5 mRNA was measured by rtPCR and normalized to β-actin using RNA isolated from GFP stromal cells derived from 4T1-C- and 4T1-M-initiated tumours. The data presented are shown as mean±s.d. collected from three independent experiments. **P < 0.01.
Figure 6
Figure 6
miR-126/miR-126* regulate inflammatory monocyte recruitment through indirectly downregulating Ccl2 in vivo. (a) FACS analysis of tumours showing the proportion of CD115+CD11b+Gr-1+ inflammatory monocytes inside the GFP tumour-associated stroma. (b) Quantification of the results shown in a for the percentage of CD115+CD11b+Gr-1+ inflammatory monocytes in 4T1-C- and 4T1-M-initiated tumour stroma. The data presented are shown as mean±s.d. collected from three independent experiments. (c) Sdf-1α and Ccl2 mRNA levels were measured by rtPCR and normalized to β-actin using RNA samples isolated from cultured 4T1-C and 4T1-M cells. The data presented are shown as mean±s.d. collected from three independent experiments. (d) The relative loading efficiency of Sdf-1α mRNA and Ccl2 mRNA into RISC in 4T1-M versus 4T1-C cells. RISC-affiliated mRNAs were examined by quantitative rtPCR in the immunoprecipitates from 4T1-C or 4T1-M cells generated using an anti-Ago antibody, and normalized to expression levels in whole-cell lysates. The data presented are shown as mean±s.d. collected from three independent experiments. (e) Expression levels of Sdf-1α and Ccl2 mRNA in GFP+ 4T1-C or 4T1-M cells isolated from tumours were determined by rtPCR and normalized to β-actin as indicated. The procedure for AMD3100 treatment is described in Methods. The data presented are shown as mean±s.d. collected from three independent experiments. (f) Correlation analysis between SDF-1Α and CCL2 expression profiles in breast cancer samples using the GSE3494 data set (n = 251). (g) Rescued Sdf-1α expression overcomes the suppressive effects of pri-miR-126 on the formation of lung metastases by 4T1-M cells. Approximately 5×10⁴ 4T1-M or 4T1-M-Sdf1 cells harbouring a luciferase reporter were inoculated into the mammary fat pad of 6-week-old female BALB/c mice as previously described. Primary tumours were surgically removed and metastatic lung lesion formation was monitored by the appearance of luciferase activity using imaging apparatus 7 and 14 days after primary tumour removal, n = 5 in each group. (h) Quantification of the results shown in g. The data presented are shown as mean±s.d. collected from five independent experiments. *P < 0.05. **P < 0.01.
Figure 7
Figure 7
Epigenetic regulation of miR-126 biogenesis through changes in the methylation status of the host gene Egfl7 T2 promoter. (a) Schematic illustration of the location of the miR-126 gene inside an intron of Egfl7. Blue arrows indicate the region used for bisulphite genomic sequencing analysis. (b) Bisulphite genomic sequencing analysis of the CpG island of the Egfl7 T-2 promoter in clinical breast tumour samples. Bisulphite sequencing PCR primers were designed using MethPrimer software, and a 205-nucleotide region containing 12 CpG islands was amplified after bisulphite conversion. The PCR products were then cloned into pCRTM4 – TOPO TA vectors (Invitrogen). For each sample, six colonies were picked for sequencing and the indicated methylation percentage was calculated on the basis of the status of sequenced CpG islands. Black circles and open circles represent methylated and unmethylated CpG dinucleotides, respectively. (c) The miR-126 expression profile correlates with the methylation status of the Egfl7 T2 promoter. miR-126 expression was determined by rtPCR and normalized to U6 RNA in these clinical samples. The methylation percentage was calculated using the bisulphite genomic sequencing results from b.

Comment in

References

    1. Parkin DM, Bray F, Ferlay J, Pisani P. Global cancer statistics, 2002. CA Cancer J. Clin. 2005;55:74–108. - PubMed
    1. Nguyen DX, Bos PD, Massague J. Metastasis: from dissemination to organ-specific colonization. Nat. Rev. Cancer. 2009;9:274–284. - PubMed
    1. Valastyan S, Weinberg RA. Tumour metastasis: molecular insights and evolving paradigms. Cell. 2011;147:275–292. - PMC - PubMed
    1. Chaffer CL, Weinberg RA. A perspective on cancer cell metastasis. Science. 2011;331:1559–1564. - PubMed
    1. Hanahan D, Coussens LM. Accessories to the crime: functions of cells recruited to the tumour microenvironment. Cancer Cell. 2012;21:309–322. - PubMed

Publication types

MeSH terms

Associated data