. 2013 Mar;16(3):264-6.
doi: 10.1038/nn.3329. Epub 2013 Feb 10.

Long-term dynamics of CA1 hippocampal place codes

Affiliations

Long-term dynamics of CA1 hippocampal place codes

Yaniv Ziv et al. Nat Neurosci. 2013 Mar.

Abstract

Using Ca(2+) imaging in freely behaving mice that repeatedly explored a familiar environment, we tracked thousands of CA1 pyramidal cells' place fields over weeks. Place coding was dynamic, as each day the ensemble representation of this environment involved a unique subset of cells. However, cells in the ∼15-25% overlap between any two of these subsets retained the same place fields, which sufficed to preserve an accurate spatial representation across weeks.


Figures
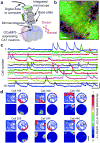
Figure 1
Figure 1. Ca2+-imaging in hundreds of place cells in freely behaving mice
(a) A tiny microscope equipped with a microendoscope images pyramidal cells expressing GCaMP3 via control of a CaMKIIα promoter. The microscope's base plate is fixed to the skull, for repeated imaging of the same cells. (b) 705 cells (red somata) identified by Ca2+-imaging in a behaving mouse (Movie 1), atop a mean fluorescence image (green) of CA1. Blood vessels appear as shadows. (c) Relative fluorescence changes (ΔF/F) for 15 of the cells in b. (d) Spatial distributions of the mouse's location during Ca2+ excitation, for 6 example cells in a mouse that explored two distinct arenas. Upper panels, blue lines show the mouse's trajectory; red dots mark the mouse's position during Ca2+ events. Lower panels, Gaussian-smoothed (σ = 3.5 cm) density maps of Ca2+ events, normalized by the mouse's occupancy time per unit area and the cell's maximum response in the two arenas. Scale bars: 100 μm in b; 10 s (horizontal) and 5% ΔF/F (vertical) in c; 20 cm in d.
Figure 2
Figure 2. Basic aspects of CA1 place codes are stable over weeks
(a) Mice trained to run back and forth on a linear track (days in black). During Ca2+-imaging sessions (red), the mice performed the same behavior. (b) The mouse's trajectory (blue lines) and its locations during cellular Ca2+ excitation (red dots) illustrate place cell activity. (c, d) Gaussian-smoothed (σ = 8.75 cm) maps of Ca2+ activity on the track, shown for the subsets of cells on Day 15 with statistically significant place fields during left, c, or right, d, motion. 85–93% of cells had a place field for one direction only; dark blue marks the lack of a place field for the other direction. Cells from four mice are pooled, ordered by place fields' centroid locations. Ca2+ maps are normalized by each cell's maximum activity during left, c, and right, d, motion. (e) The fraction of cells with statistically significant place fields, expressed as a percentage of cells found in each session (mean ± s.e.m.; 807–1000 total cells per day; n = 4 mice), was constant over the study for each motion direction (colored bars) and in total (inset). (f) The ensemble of all place fields found in each session covered the entire track. Place fields are shown as smoothed maps of Ca2+ excitation as in c and d, ordered by centroid location on each day and pooled across four mice and both movement directions. (g) Spatial distributions of place fields' centroid locations were constant over 1 mo. Place fields' centroids were tallied in 3.5-cm bins (mean ± s.e.m; n = 4 mice; 178–268 cells per day). Color key is the same as for h and indicates the day of imaging. (h) Cumulative distributions of place fields' widths did not evolve (mean ± s.e.m). Place fields had a median (± 33% confidence interval) width of 24 ± 3.5 cm. Scale bars: 10 cm in b; 84 cm in f.
Figure 3
Figure 3. Place fields are spatially invariant and temporally stochastic while preserving a stable representation at the ensemble level
(a) 826 cells showed Ca2+ activity in one mouse over 45 days. Number of sessions in which each cell was active is shown via the color scheme in b. (b) Histogram of number of sessions in which each of 2960 cells from 4 mice was active. Error bars show s.d. from counting statistics. Inset: A constant fraction of all cells detected over 10 sessions was active each day. Colored data are from individual mice. Mean ± s.e.m is in black. (c) If a cell had Ca2+ activity in one session, the odds (blue data; mean ± s.e.m) it also had Ca2+ activity in a subsequent session declined with the elapsed time interval. If a cell had a statistically significant place field in one session, the odds (red data) it had a place field in a subsequent session also declined with time. (d) If they reappeared, place fields generally did not shift their centroid locations. Distributions of centroid shifts (colored by days between sessions; mean ± s.e.m.) were indistinguishable (Kolmogorov-Smirnov test; P ≥ 0.17), sharply peaked at zero, and highly distinct from the null hypothesis place fields would randomly re-locate (P = 4·10-67; Kolmogorov-Smirnov test). Inset: Cumulative histograms of shift magnitudes. 74–83% were ≤7 cm. Median shift (3.5 cm) was much less than the median place field width (24 cm). (e–g) Place field maps for cells found on multiple days, ordered by place fields' centroid positions on day 5 (e), day 20 (f), or day 35 (g), reveal continuous evolution of the ensemble representation of space. Data pooled across 4 mice. (h) Time-lapse decoders retain substantial accuracy over 30 days. Reconstructions of the mouse's trajectory (colored curves) and its actual position (black curves). Three paired reconstructions compare: Right, time-lapse decoders trained on data from day 5, using all cells with place fields on both days of each pair; Left, decoders trained on data from the same day as the test trial. Each pair uses an equal number of cells, optimally chosen in left to minimize errors. (i) Median errors in estimating the mouse's position are ∼7–13 cm (black points; mean of the median errors ± s.e.m.), even for decoders trained on data from 30 days prior. Red points are for decoders trained on data from the same day as test data, using equal numbers of cells as black points and optimally chosen to minimize errors. Gray points are errors using shuffled traces of Ca2+ activity from the same day as training data (averaged over 10,000 shuffles). (j) Cumulative distributions of decoding error magnitudes (mean ± s.e.m.). Black curve: Test and training data from same day. Colored curves: Test data 5-30 days apart from that used for training. Gray curve: Decoders tested on shuffled data. Scale bars: 100 μm in a; 84 cm in e–g; 2 s (horizontal) and 10 cm (vertical) in h.

References

    1. O'Keefe JNL. The Hippocampus as a Cognitive Map. Clarendon Oxford; 1978.
    1. Leutgeb S, et al. Independent codes for spatial and episodic memory in hippocampal neuronal ensembles. Science. 2005;309:619–623. 309/5734/619 [pii] 10.1126/science.1114037. - PubMed
    1. Buzsaki G. Large-scale recording of neuronal ensembles. Nat Neurosci. 2004;7:446–451. 10.1038/nn1233 nn1233 [pii] - PubMed
    1. Muller RU, Kubie JL, Ranck JB., Jr Spatial firing patterns of hippocampal complex-spike cells in a fixed environment. J Neurosci. 1987;7:1935–1950. - PMC - PubMed
    1. Thompson LT, Best PJ. Long-term stability of the place-field activity of single units recorded from the dorsal hippocampus of freely behaving rats. Brain Res. 1990;509:299–308. 0006-8993(90)90555-P [pii] - PubMed

Publication types