. 2013 Mar;45(3):325-9.
doi: 10.1038/ng.2553. Epub 2013 Feb 10.

Endogenous retroviruses function as species-specific enhancer elements in the placenta

Affiliations

Endogenous retroviruses function as species-specific enhancer elements in the placenta

Edward B Chuong et al. Nat Genet. 2013 Mar.

Abstract

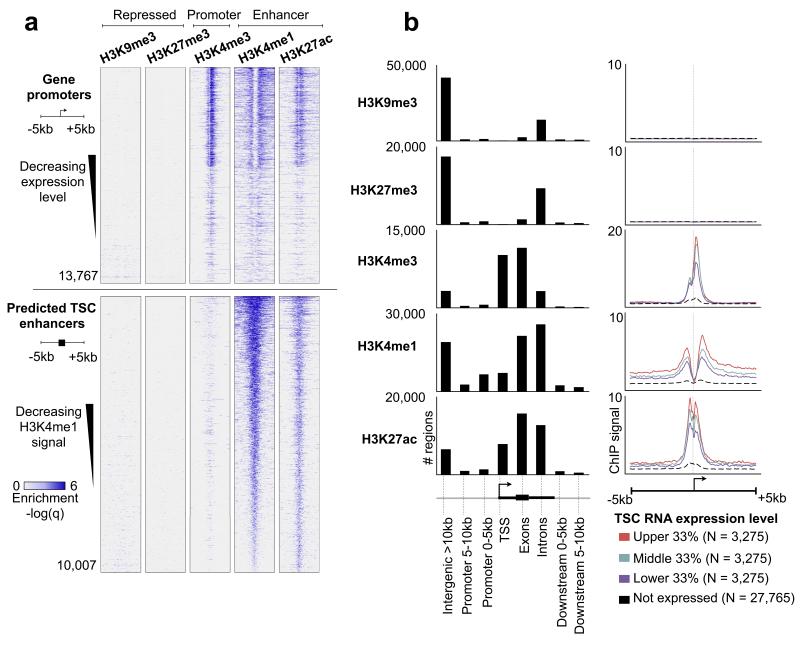
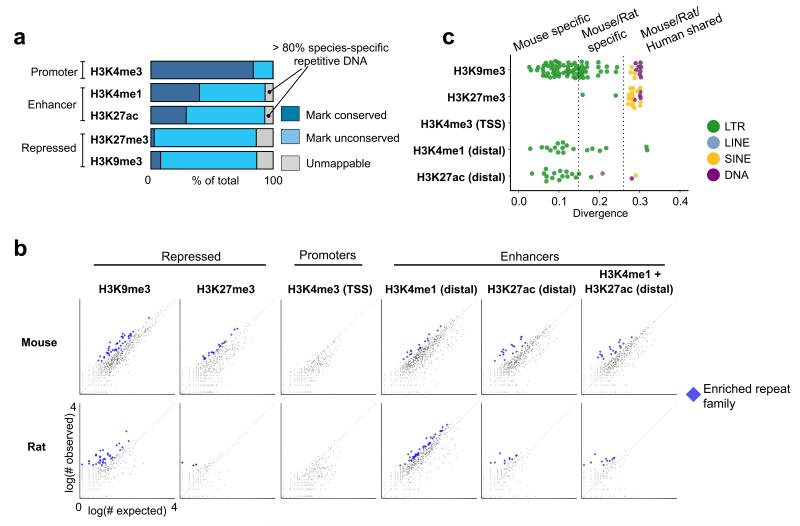
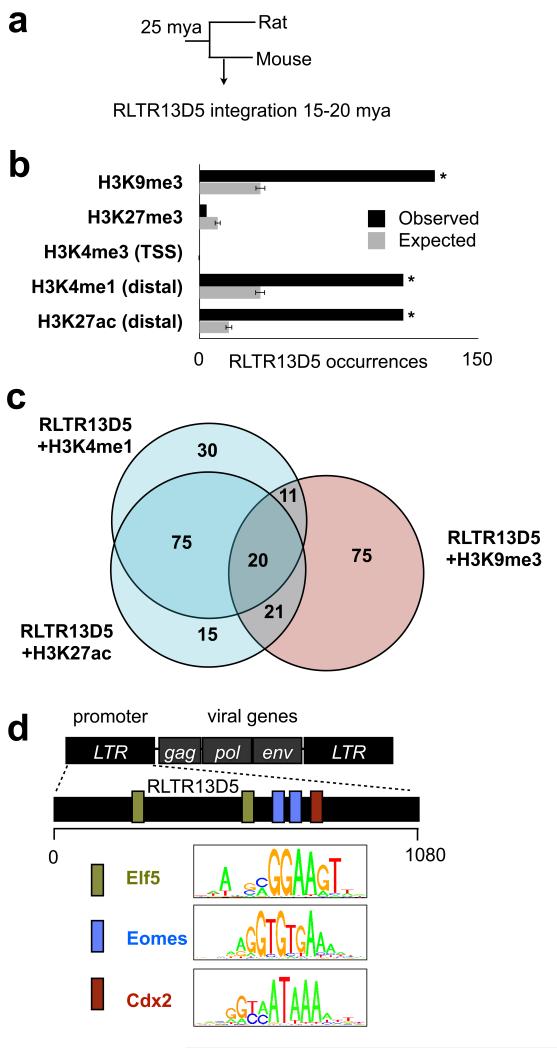
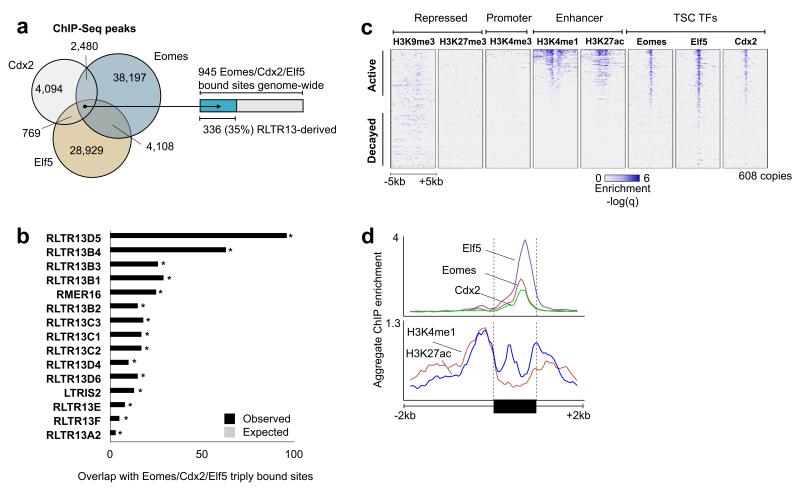
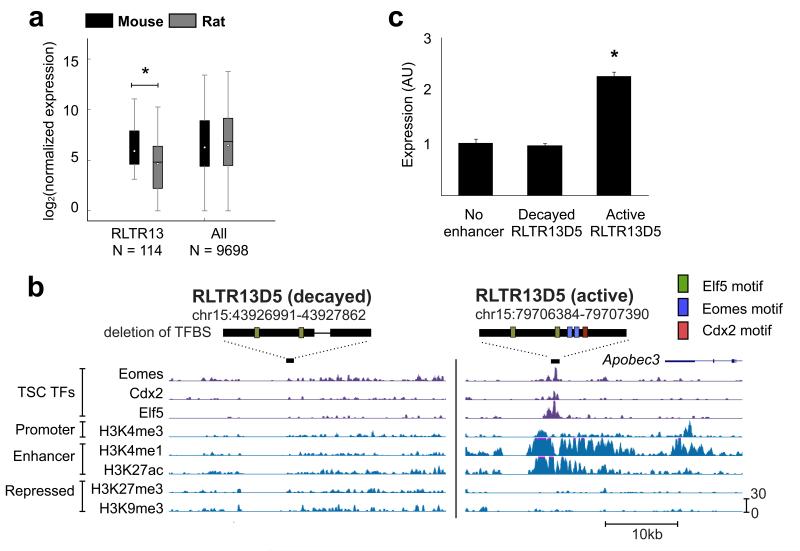
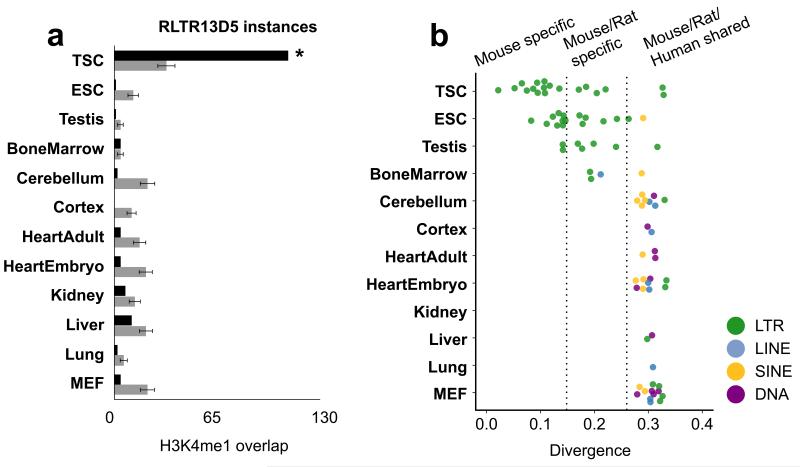
The mammalian placenta is remarkably distinct between species, suggesting a history of rapid evolutionary diversification. To gain insight into the molecular drivers of placental evolution, we compared biochemically predicted enhancers in mouse and rat trophoblast stem cells (TSCs) and found that species-specific enhancers are highly enriched for endogenous retroviruses (ERVs) on a genome-wide level. One of these ERV families, RLTR13D5, contributes hundreds of mouse-specific histone H3 lysine 4 monomethylation (H3K4me1)- and histone H3 lysine 27 acetylation (H3K27ac)-defined enhancers that functionally bind Cdx2, Eomes and Elf5-core factors that define the TSC regulatory network. Furthermore, we show that RLTR13D5 is capable of driving gene expression in rat placental cells. Analysis in other tissues shows that species-specific ERV enhancer activity is generally restricted to hypomethylated tissues, suggesting that tissues permissive for ERV activity gain access to an otherwise silenced source of regulatory variation. Overall, our results implicate ERV enhancer co-option as a mechanism underlying the extensive evolutionary diversification of placental development.


Figures

Figure 1
Figure 1. The epigenetic landscape of mouse TSCs using histone ChIP-Seq
(a) Top five panels: heatmap representation of histone ChIP-Seq enrichment across gene promoters. Each row represents a 10 kb window centered at the gene TSS and extending 5 kb upstream and 5 kb downstream (see cartoon left side). Genes are sorted by decreasing expression levels. Lower five panels are the same histone marks, centered around predicted enhancers (defined as regions co-enriched for H3K27ac + H3K4me1 and located >5 kb away from a gene TSS), and sorted by decreasing average H3K4me1 enrichment across the window. (b) Left panel: distribution of histone marks within genomic elements, including gene TSS, exons, introns, promoters (0-5 or 5-10 kb away from TSS), and intergenic regions (>10 kb away from TSS). The Y axis represents the total number of marks present in each category. Right panel: averaged ChIP-Seq enrichment profile across a 10 kb window centered on the gene TSS. Genes are grouped into 4 categories: high expression (red), medium expression (green), low expression (blue), and nondetectable expression (black dashed). The Y axis represents the average ChIP-Seq enrichment (q value).
Figure 2
Figure 2. Comparison between mouse and rat reveals over abundance of species specific ERVs in enhancer regions
(a) Rat TSC ChIP-Seq defined regulatory elements were mapped to their orthologous position in the mouse genome. If the same histone mark was present in mouse, then the element was considered epigenetically conserved. For unconserved elements, we further distinguished whether the genomic DNA was mappable to the other genome, or derived from species-specific sequence. Each category is represented as a fraction of the total number of elements in the ChIP-Seq dataset (dark blue: rat-mouse conserved elements, light blue: unconserved regions gray: unmappable elements). In both species, the unmappable regions were predominantly composed of species-specific TEs. (b) We deduced whether the frequency of any type of TE was enriched within each class of regulatory element. Each point represents a single TE family, composed of up to several thousand copies genome-wide. For each family, the number of individual copies observed residing within a set of regulatory elements (Y axis) is plot against a random expectation (X axis). Significantly overrepresented families are indicated in blue. (c) Overrepresented mouse TE families from (b) are plot against the average nucleotide divergence of their individual copies versus the consensus sequence, which is a proxy for the evolutionary age of the TE. Each point is colored based on the class of TE. Divergence measurements representing the distance between mouse/rat and mouse/human are depicted by dotted lines. ERVs: endogenous retroviruses; TE: transposable elements.
Figure 3
Figure 3. Mouse-specific ERV RLTR13D5 is highly enriched within placental enhancers
(a) Phylogenetic tree indicating approximate RLTR13D5 integration time in mouse genome. (b) Examination of all 608 instances of RLTR13D5 shows that this family is highly enriched within the enhancer marks H3K4me1 (Bonferroni P = 4.5 × 10⁻²⁹, binomial test) and H3K27ac (P = 4.2 × 10−57) as well as for the repressive mark H3K9me3 (P = 1.5 × 10−36). This is illustrated in a barplot comparing the observed number of RLTR13D5 copies within a histone modification to the random expectation. The random expectation is displayed as the average over 1000 randomized datasets, and error bars indicate standard deviation. (c) Venn Diagram showing that RLTR13D5 instances containing the H3K4me1 and H3K27ac enhancer marks are distinct from those containing the repressive mark H3K9me3. (d) Diagram of RLTR13D5, whose sequence originally derives from a long terminal repeat (LTR) segment of an ERV. The RLTR13D5 consensus sequence harboring predicted binding sites for Eomes, Cdx2, and Elf5, which are depicted by colored boxes across the 1080 bp-long consensus sequence. Uniprobe motifs used to scan the sequence are shown in the legend.
Figure 4
Figure 4. Core TSC transcription factors bind RLTR13D5 copies
(a) Venn diagram representing the genomic overlap between Eomes, Cdx2, and Elf5 ChIP-Seq binding sites. (b) Barplot showing TEs overrepresented within the 945 genomic regions triply bound by Eomes, Cdx2, and Elf5. The top 15 results are shown, where black bars represent the observed overlap and gray represents the random expectation (< 1 in all cases). All TEs displayed are significantly overrepresented (Bonferroni P < 4.1 × 10⁻¹⁸, binomial test). (c) Heatmap representation of all 608 RLTR13D5 copies. Rows represent 10kb windows centered on an individual copy, and the ChIP enrichment signal from each experiment is displayed in each column. Elements are sorted by decreasing average H3K4me1 signal across the 10 kb window. (d) Aggregate ChIP enrichment profiles for transcription factors (top panel) and histones (bottom) across all RLTR13D5 copies, including 2 kb flanking genomic regions. LTR: Long terminal repeat. ERV: endogenous retrovirus.
Figure 5
Figure 5. RLTR13D5 functions to drive trophoblast expression
(a) Boxplot depicting normalized 3′ RNA-Seq levels for both mouse and rat. Whiskers extend to 1.5 times the inner quartile range. For genes neighboring Eomes/Elf5/Cdx2 triply bound RLTR13 elements within 100 kb, mouse expression levels are higher than in rat (P = 0.0036, Wilcoxon signed rank test). (b) UCSC genome screenshots of the “decayed” and “active” RLTR13D5 copies used in the luciferase assay. Above each screenshot, the element is represented by a black rectangle with predicted binding sites as in Fig. 4a. The decayed copy harbors a deletion represented by the thin black line. (c) Luciferase assay demonstrating reporter activity driven by “active” versus “decayed” RLTR13D5 copies (P = 3.5 × 10⁻⁷, T test). Relative luciferase activity is expressed as the means ± S.D.
Figure 6
Figure 6. RLTR13D5 enhancer cooption is placental-specific and species-specific ERV enhancer activity is restricted to TSCs, ESCs and testes
(a) Barplot of enrichment of RLTR13D5 within tissue enhancer datasets as predicted by distal H3K4me1. (b) Dotplot of TEs enriched in tissue enhancer datasets, generated using distal H3K4me1 regions following Fig. 2c. Only TSC, ESC, and testis exhibit widespread enrichment of recently integrated ERVs within enhancer regions.

References

    1. Mossman HW. Vertebrate Fetal Membranes: Comparative Ontogeny and Morphology; Evolution; Phylogenetic Significance; Basic Functions; Research Opportunities. Rutgers University Press; 1987.
    1. Enders A. Reasons for Diversity of Placental Structure. Placenta. 2009;30(Supplement):15–18. - PubMed
    1. Crespi B, Semeniuk C. Parent-offspring conflict in the evolution of vertebrate reproductive mode. Am Nat. 2004;163:635–653. - PubMed
    1. Haig D. Genetic conflicts in human pregnancy. The Quarterly Review of Biology. 1993;68:495–532. - PubMed
    1. Knox K, Baker JC. Genomic evolution of the placenta using co-option and duplication and divergence. Genome Res. 2008;18:695–705. - PMC - PubMed

Publication types

MeSH terms

Substances

Associated data