. 2013 Jun:73:144-55.
doi: 10.1016/j.neuroimage.2013.01.072. Epub 2013 Feb 8.

Linking human brain local activity fluctuations to structural and functional network architectures

Affiliations

Linking human brain local activity fluctuations to structural and functional network architectures

A T Baria et al. Neuroimage. 2013 Jun.

Abstract

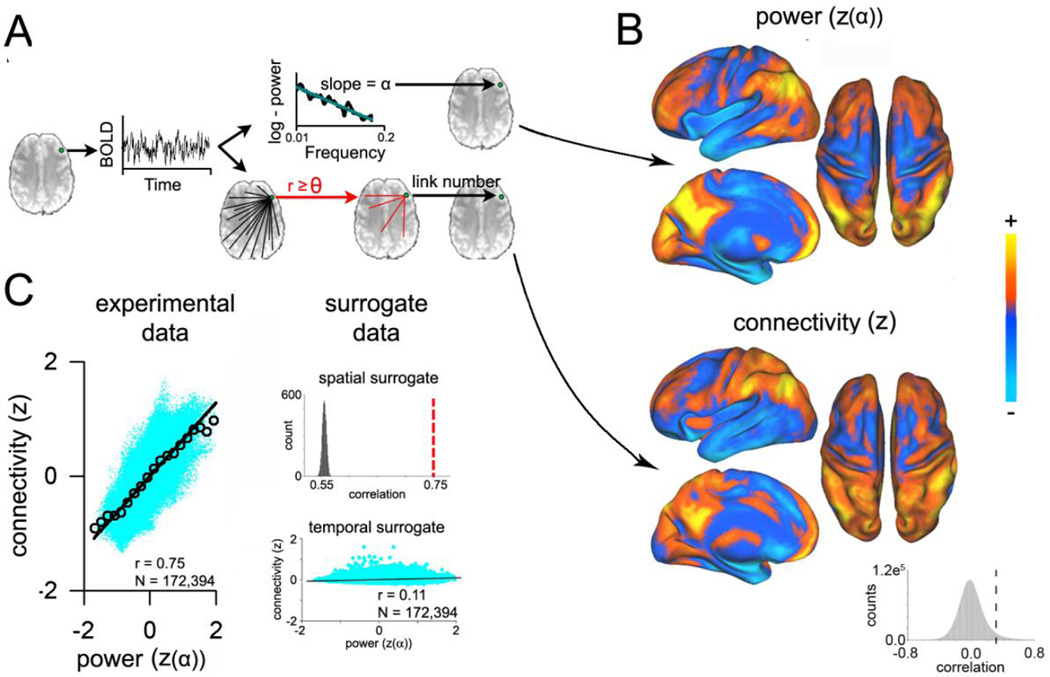
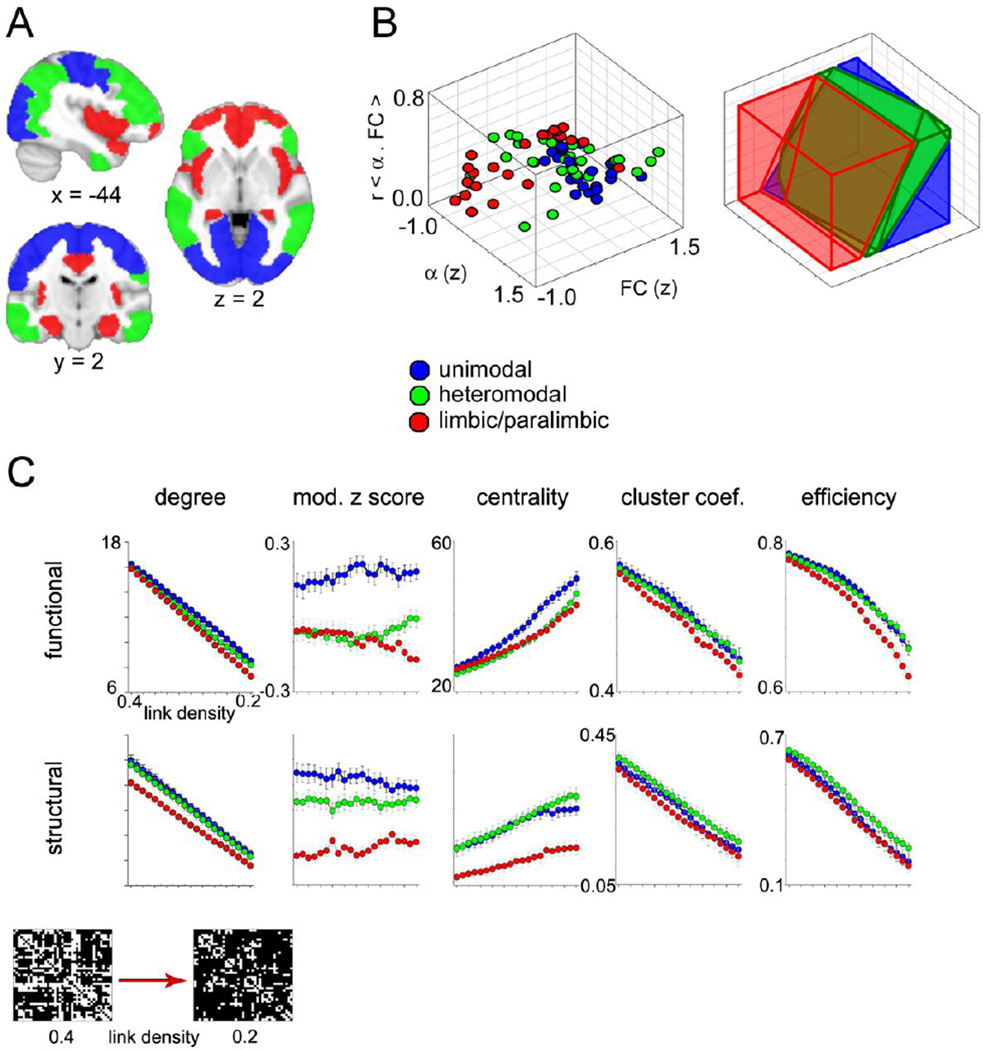
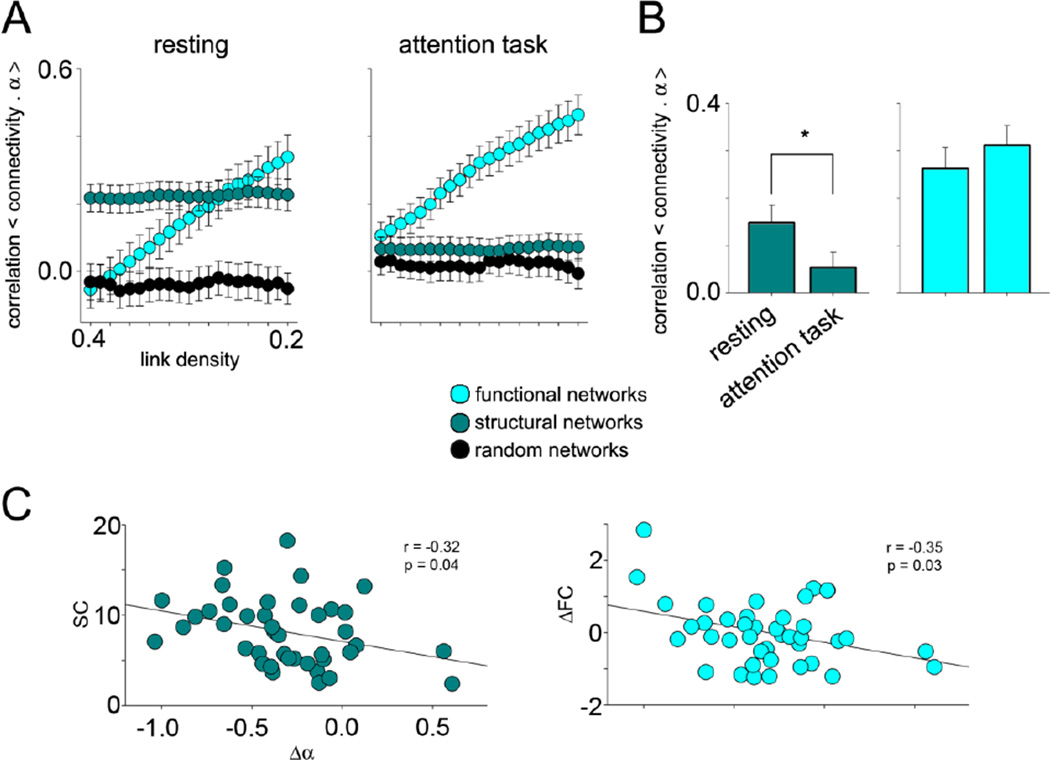
Activity of cortical local neuronal populations fluctuates continuously, and a large proportion of these fluctuations are shared across populations of neurons. Here we seek organizational rules that link these two phenomena. Using neuronal activity, as identified by functional MRI (fMRI) and for a given voxel or brain region, we derive a single measure of full bandwidth brain-oxygenation-level-dependent (BOLD) fluctuations by calculating the slope, α, for the log-linear power spectrum. For the same voxel or region, we also measure the temporal coherence of its fluctuations to other voxels or regions, based on exceeding a given threshold, Θ, for zero lag correlation, establishing functional connectivity between pairs of neuronal populations. From resting state fMRI, we calculated whole-brain group-averaged maps for α and for functional connectivity. Both maps showed similar spatial organization, with a correlation coefficient of 0.75 between the two parameters across all brain voxels, as well as variability with hodology. A computational model replicated the main results, suggesting that synaptic low-pass filtering can account for these interrelationships. We also investigated the relationship between α and structural connectivity, as determined by diffusion tensor imaging-based tractography. We observe that the correlation between α and connectivity depends on attentional state; specifically, α correlated more highly to structural connectivity during rest than while attending to a task. Overall, these results provide global rules for the dynamics between frequency characteristics of local brain activity and the architecture of underlying brain networks.


Figures

Figure 1
Figure 1. Spatial distribution of BOLD power and degree of FC are highly correlated
A) Methodology for voxel-wise analysis. To generate power distribution maps the resting state fMRI BOLD signal at each voxel was extracted and transformed to frequency space, using Welch’s method. The log-linear slope of the power spectrum was used to calculate α. Steeper slopes translate to higher α, or a greater distribution of power to the lower frequencies. Network degree, or connectivity, maps were generated by calculating the Pearson correlation at each voxel against all other voxels in the brain. The number of voxels exceeding threshold (r≥0.3) represent the number of functional links at each voxel. B) Group-averaged (N=21 subjects) distribution for α, and for connectivity (number of functional links). Individual α and connectivity maps were z-scored and averaged across subjects. Blue represents negative and yellow represents positive z-values. The spatial distributions of power and connectivity are generally similar. The inset histogram shows the distribution of pairwise correlations between 500 random voxels in each subject. The dotted line indicates the connection threshold at a Pearson correlation of 0.3. C) Voxel-wise spatial correlation (r = 0.75) of group average maps reveals high similarity between power and number of functional links (left). Spatially shuffling connectivity maps with wavelet re-sampling 5000 times reduces the average correlation to r = 0.56, which is significantly lower than the correlation with experimental data, referenced with the dotted line (upper inset). Similarly, after shuffling the phases of BOLD timeseries in Fourier space, and recalculating whole brain connectivity, correlation between α and connectivity was reduced to r = 0.11 (lower inset).
Figure 2
Figure 2. Frequency and network architecture properties vary with synaptic wiring
A) Subdivisions of the brain based on synaptic hodology. B) Group mean Z scored connectivity and α, and their correlation is plotted for each BA (left). Linear discriminant analysis was then performed on this data to test for misclassification of BAs (table S3). Classification space is plotted demonstrating a general segregation of unimodal and limbic-paralimbic regions, with some overlap from heteromodal regions (right). C) Network metrics differed across synaptically-grouped BAs. Data points represent the mean of each synaptic group, averaged across all subjects (N=21). Error bars are standard error. All metrics were significantly different (p < 0.01), except cluster coefficient for task functional networks (table S4). Modular degree exhibited the greatest differences, while efficiency and clustering coefficient were the least different. Inset displays an example connection matrix at the highest and lowest link density thresholds for a single subject.
Figure 3
Figure 3. Local BOLD fluctuations reflect connectivity depending on brain state
A) Structural and functional connectivity correlated differently with α according to scan condition. Each data point is the mean correlation for each synaptic group, averaged across subjects. Error bars indicate standard error. Two-way ANOVA revealed FC- α correlations were significantly greater than random networks for both scan conditions, but SC-α correlations were significant only during resting state. See table S5 for details. B) Differences between rest and task α-FC/SC correlations were averaged across link density thresholds for each subject. Bars represent the mean values across subjects, error bars represent standard error, and significance between task type is indicated with asterisks (p<0.001). In general, α-SC correlations were higher during rest while α-FC remained unchanged between scan conditions. C) The correlation between group mean change in α (Δα = task α – rest α) and SC, as well as between group mean Δα and ΔFC (task FC – rest FC) was calculated across BAs for all link densities (figure S8). Only the correlations at link density = 0.2 is shown here. SC and ΔFC were both negatively correlated to Δα, suggesting that BAs may be drawing energy from more local sources while attending to a task.

References

    1. Fox MD, Raichle ME. Spontaneous fluctuations in brain activity observed with functional magnetic resonance imaging. Nature reviews. Neuroscience. 2007;8(9):700–711. - PubMed
    1. Y A, et al. Functional Connectivity between Anatomically Unconnected Areas Is Shaped by Collective Network-Level Effects in the Macaque Cortex. Cereb Cortex. 2011 - PubMed
    1. Greicius MD, Supekar K, Menon V, Dougherty RF. Resting-state functional connectivity reflects structural connectivity in the default mode network. Cereb Cortex. 2009;19(1):72–78. - PMC - PubMed
    1. Vincent JL, et al. Intrinsic functional architecture in the anaesthetized monkey brain. Nature. 2007;447(7140):83–86. - PubMed
    1. Honey CJ, et al. Predicting human resting-state functional connectivity from structural connectivity. Proceedings of the National Academy of Sciences of the United States of America. 2009;106(6):2035–2040. - PMC - PubMed

Publication types

MeSH terms

LinkOut - more resources